Dear traders, dear stock market friends.
After the rapid rally in the DAX in November and December, many professional market participants were bracing themselves for a correction at the start of the new year. This did indeed occur, but the developments of the past week seem to have brought it to an end more quickly than many investors had anticipated.
Traders lag behind price movements
After the DAX broke out to a new all-time high in the first week of December, a consolidation at a high level followed. Although this lasted six weeks, it mainly developed along the time axis rather than the price axis. Based on the weekly closing prices, the extent of the correction was only 205 points or 1.22 %. Data on investor sentiment and sentiment analyses show that many investors had expected larger setbacks. The liquidation of short positions and the now neutral to positive sentiment were the trigger for a price increase last week amid strong volumes.
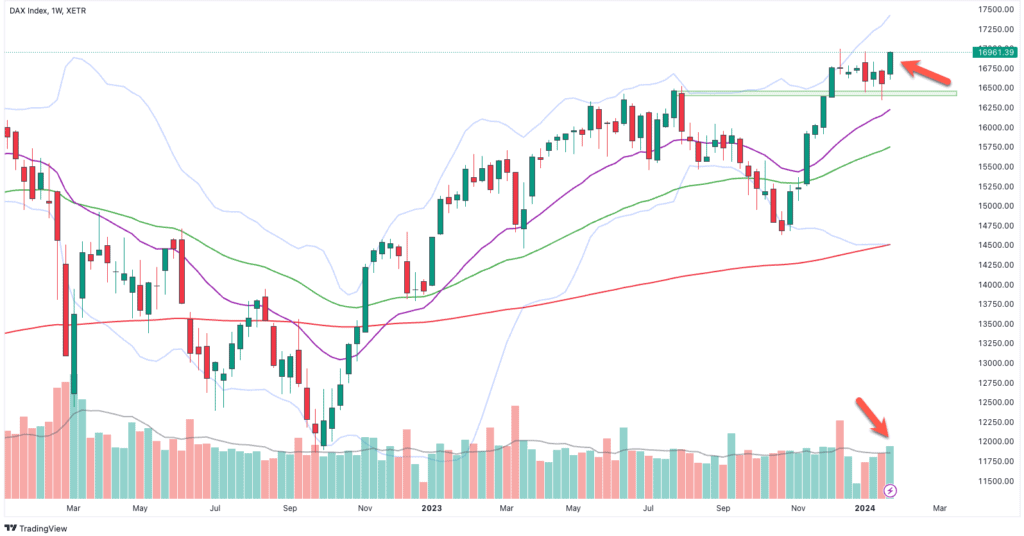
Auf dem folgenden Wochenchart ist zu erkennen, dass die Korrektur bis an das Niveau der vorherigen Allzeithochs aus dem Juli 2023 lief bei etwa 16.400 - 16.500 Punkten, bevor die Bullen erneut das Ruder übernahmen.

DAX weekly chart
Interest rate cuts expected in summer
The Governing Council of the European Central Bank met again last Thursday. Despite increasing economic concerns and calls for an interest rate cut, the ECB decided not to lower the key interest rate for the time being. This is the third time in a row that the monetary authorities have left the key interest rate unchanged at 4.5 %.
However, ECB President Christine Lagarde has commented on the possibility of an interest rate cut and emphasized that this is likely next summer. After an inflation rate of 2.4 % in November, inflation rose to 2.9 % in December compared to the same month last year; the core inflation rate, on the other hand, fell from 3.6 % to 3.4 %. The overarching trend towards disinflation continues despite the December data.
Chart breakout
The positive mood on the German stock market continued after the ECB meeting and continued until Friday evening. The index reached a new all-time high on a weekly and daily closing price basis. Looking at the daily chart, you can see that the DAX was able to break through the slightly downward sloping consolidation formation to the upside and broke through both the upper trend line and the upper Bollinger band. At the same time, the volume on Wednesday and Friday rose to the highest level of the current year, which can be seen as an additional bullish signal and suggests that the breakout will lead to a continuation of the trend. A short-term correction back to the trend channel line and daily EMA 20 would be a good opportunity to jump on the trend at the second attempt.
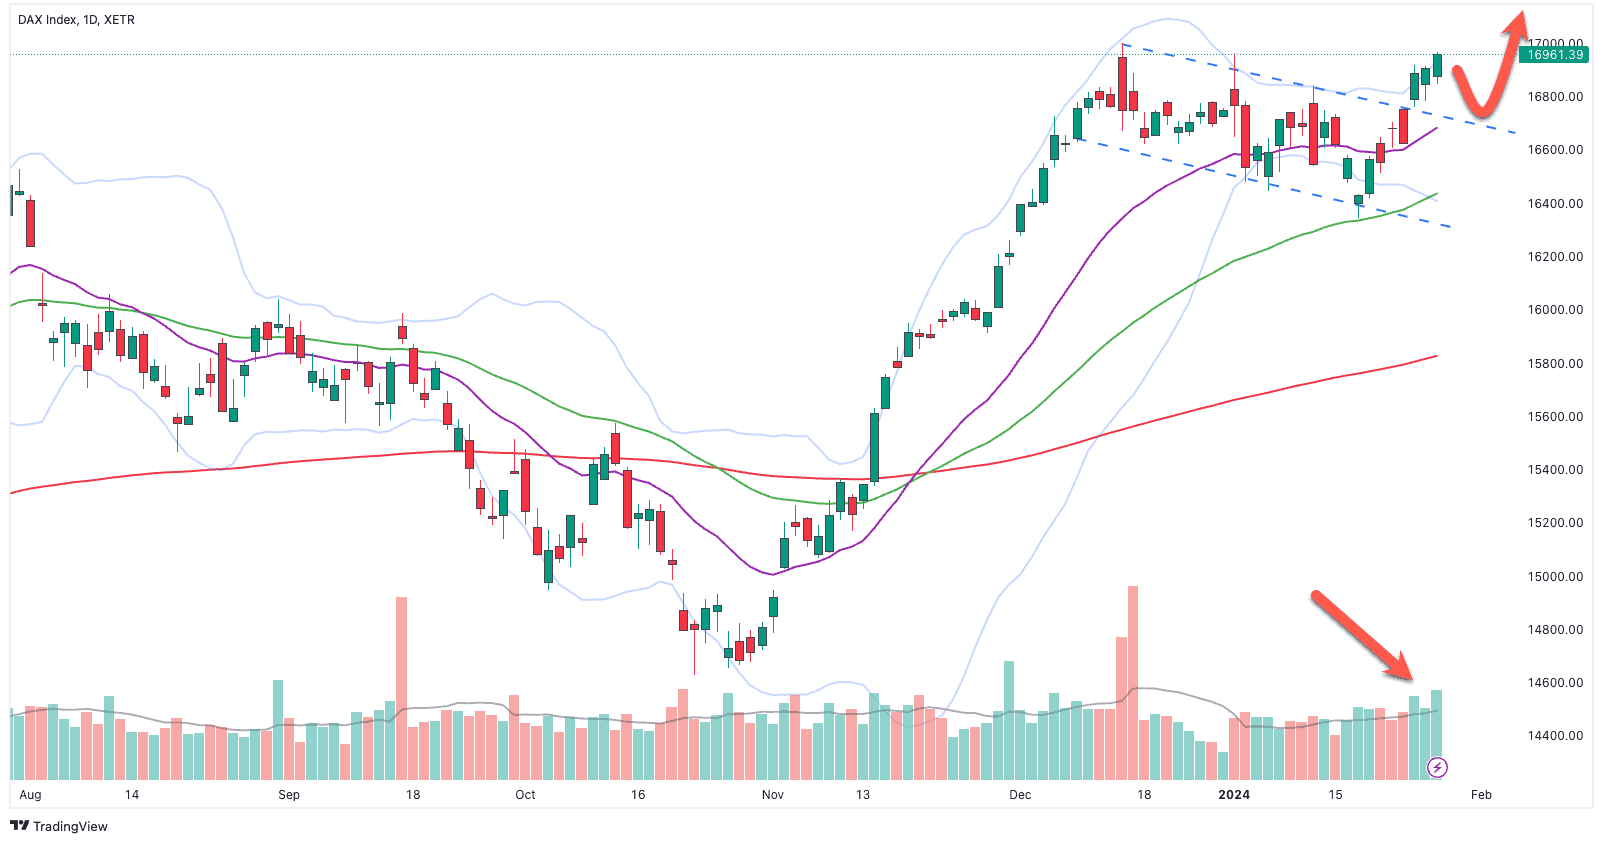
DAX daily chart
MDAX and SDAX comparatively weak
Small caps have recently performed somewhat weaker than the heavyweights in the DAX. The MDAX is still a long way from new 52-week highs and is showing relative weakness. For the chart picture to brighten, the index must at least rise above 27,700 to 27,800 points and break above the trend line including the local high from December, the weekly EMA 200 and the upper Bollinger band (weekly). If this breakout is successful, the chances of a continuation of the trend are also good here.
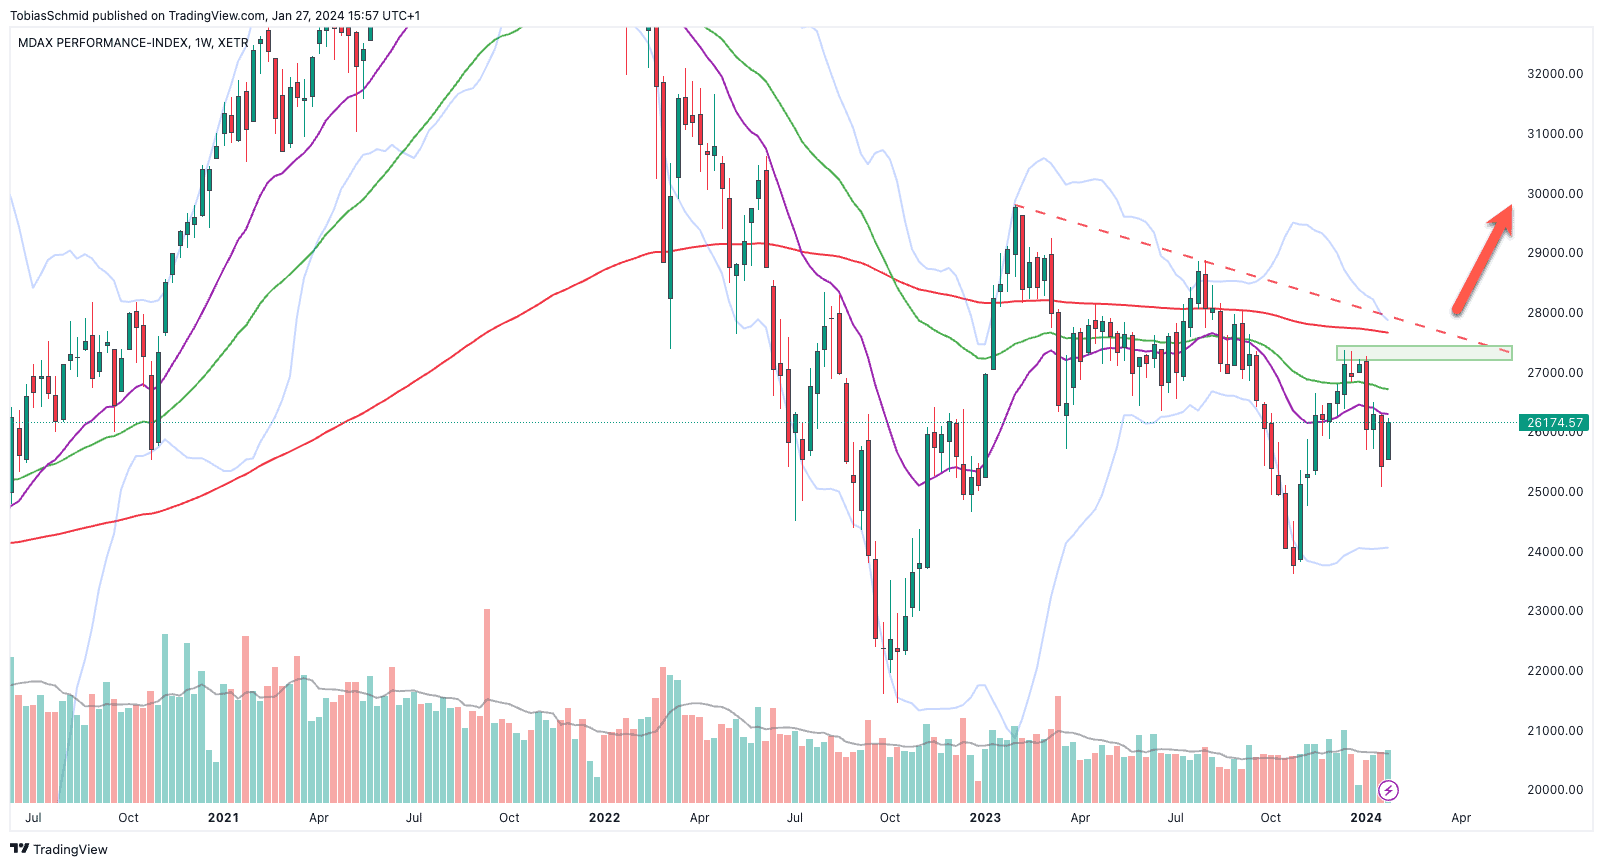 MDAX weekly chart
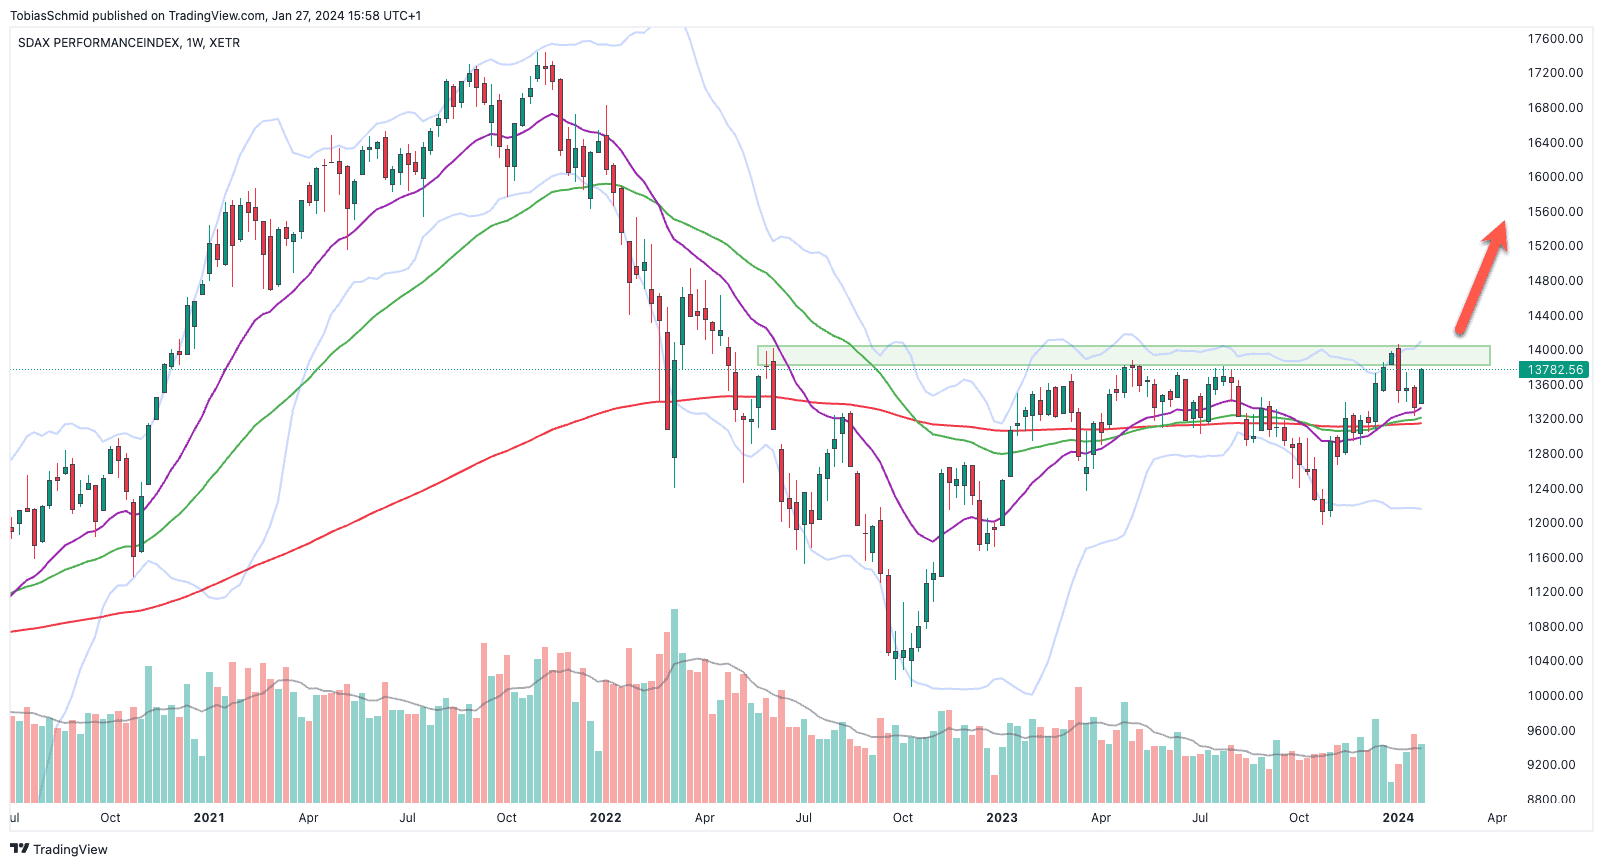
In the SDAX, the chart picture offers a little more reason for hope, at least visually at first glance. The small-cap index has broken above all important EMAs on the weekly chart and successfully defended them last week. A sustained breakout above 14,000 points would clear the way to the old all-time highs from November 2021 and generate a new bullish signal on the chart, which would increase the probability of a continuation of the trend.
Author Tobias Schmid
Date: 29.01.2024