Dear traders, dear stock market friends.
Last week, investors were preoccupied by concerns about an escalation of the Middle East conflict. Both the US and European stock markets came under pressure and ended the week in the red.
DAX continues correction
Although the DAX lost a few points over the course of the week, there was no sign of panic or a sharp sell-off. The correction was long overdue, particularly due to the strong previous price rally. The bull market is in no danger whatsoever, at least not at the moment. Price declines therefore primarily represent an opportunity to position oneself long in the direction of the overriding upward trend with a more favorable risk/reward ratio.
Battle for daily EMA 50
After the DAX started the new trading week with a small gain on Monday, a downward movement of around 260 points or almost 1.5% followed on Tuesday. As can be seen on the daily chart, the correction ended almost exactly at the daily SMA 50 (thin green line) and the daily EMA 50 (thick green line). This important short-term support zone was also defended on Wednesday, Thursday and Friday.
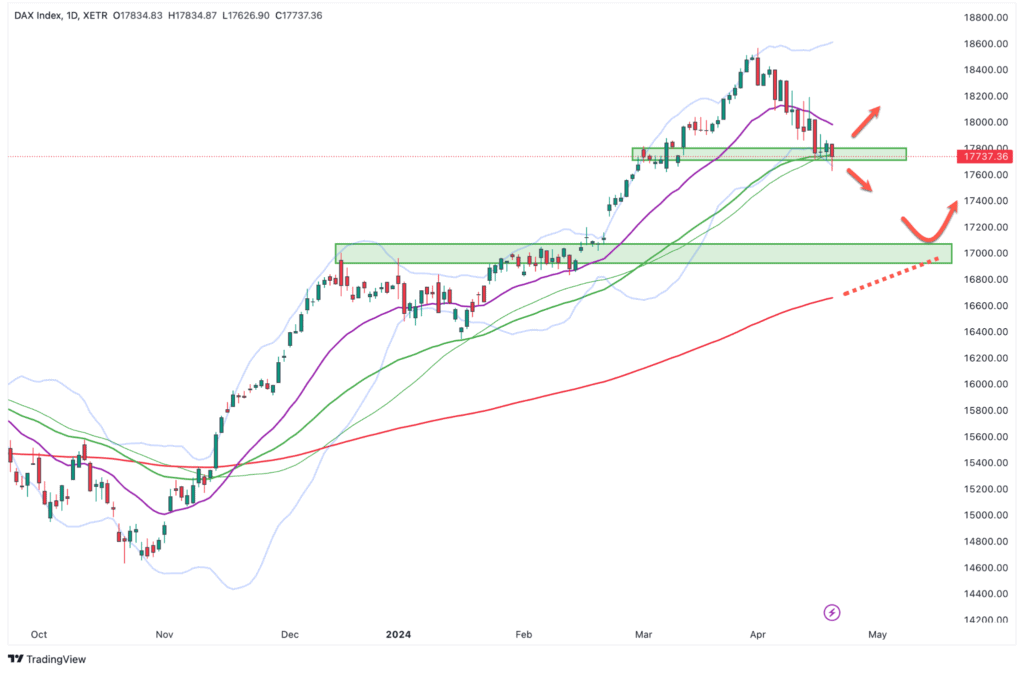
DAX daily chart
A daily closing price below the 50-day line would significantly increase the probability of a continuation of the correction. The next important support zone is located at around 17,000 points. On the one hand, the round price mark represents psychological support; on the other hand, the last local highs of the upward trend from December, January and February are located at this price level. In addition, there is the daily EMA 200, which currently stands at 16,662 points but is set to rise further over the next few days and should therefore reinforce the horizontal support area.
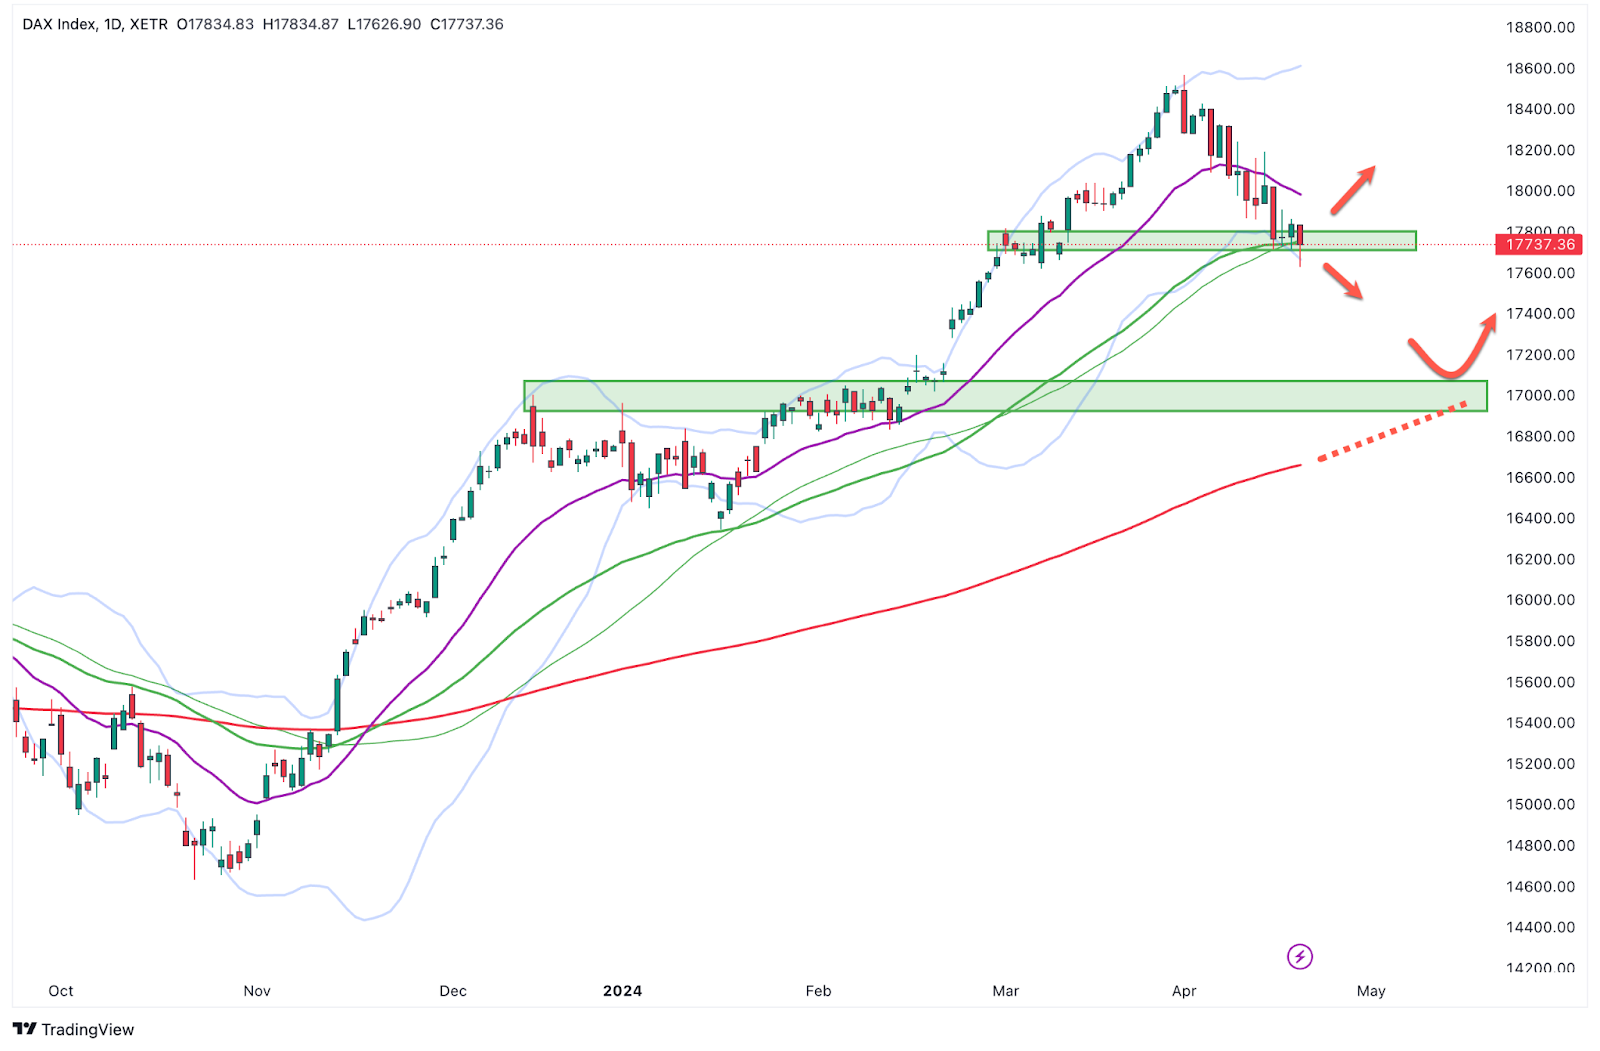
A sustained break of the 17,000 mark would not yet represent a technical break in the trend, but would at least cloud the short-term picture. The next clear support area is at 16,500 points. As can be seen on the weekly chart, there is cross-support here, consisting of horizontal support from last summer's highs and the upward trend line.
DAX weekly chart
In the chart, the area of the weekly EMA 20 has also been marked as a support zone. A break of the short-term support in the area of the daily EMA 50 does not necessarily mean that the DAX will fall to the daily EMA 200. The correction could also end in the area of the weekly EMA 20. It therefore makes sense to prepare primarily for the resumption of the overriding uptrend rather than trying to trade the correction with short positions.
Subordinate downward trend intact
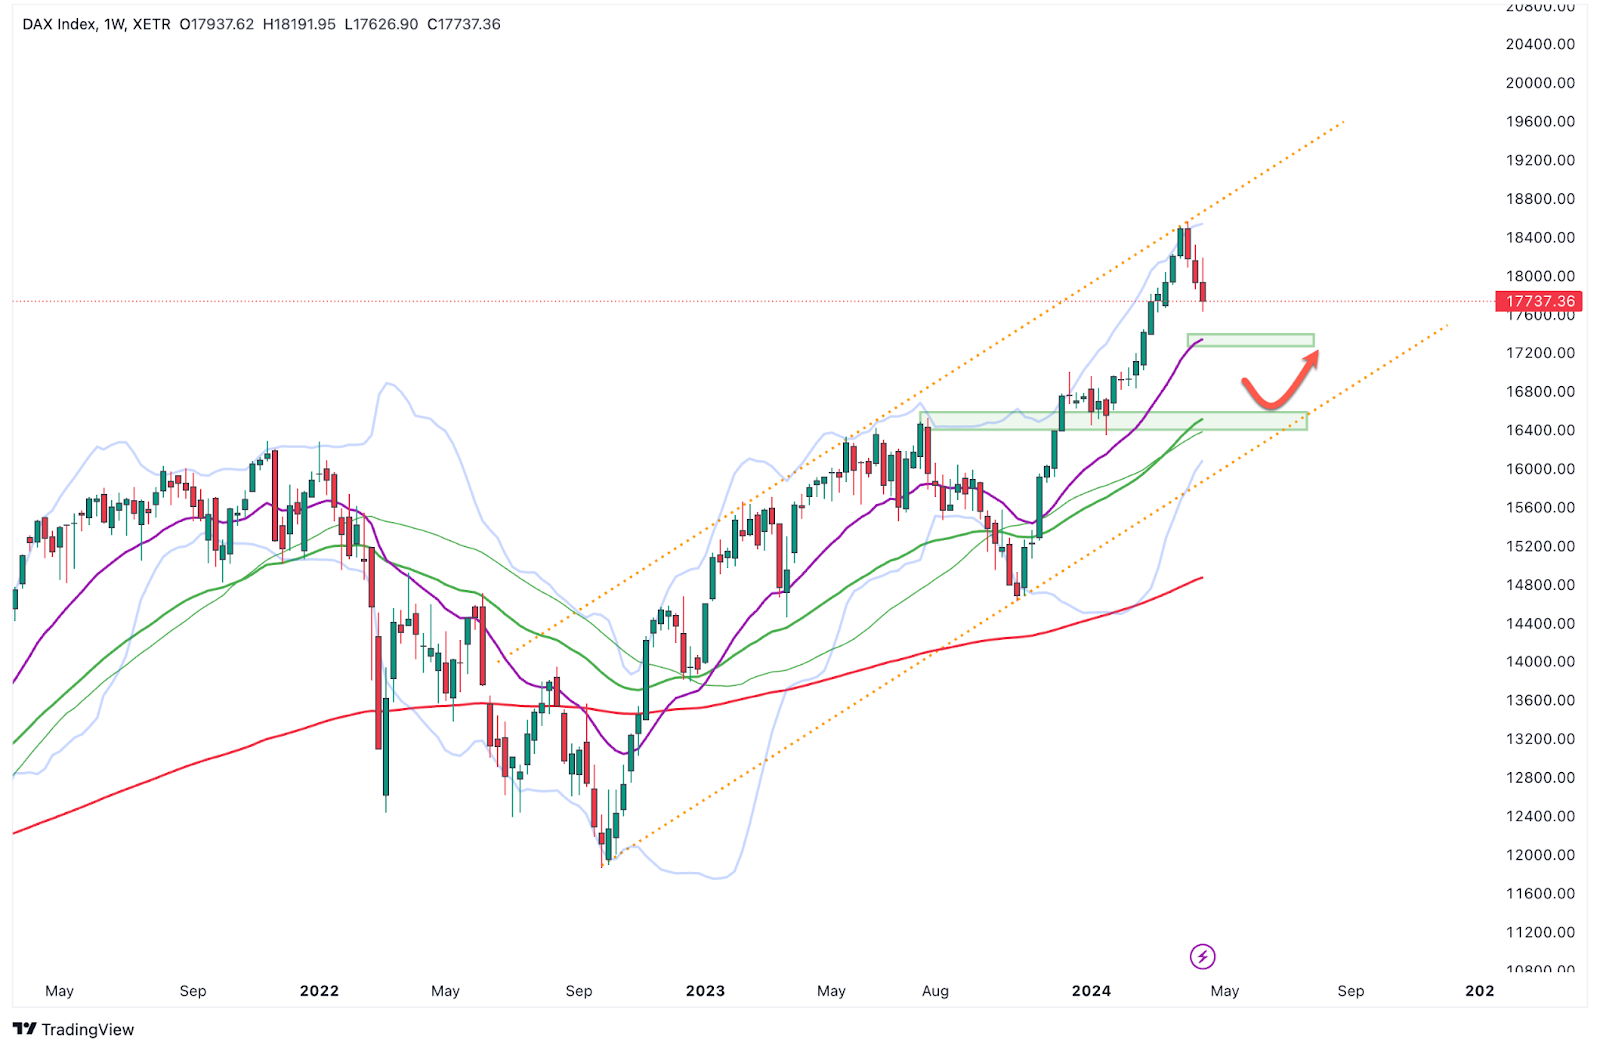
Instead of speculating on a rebound near a support zone or on the resumption of the overriding upward trend and taking the plunge, it is also possible to wait and see whether a subordinate trend reversal takes place. In this case, the subordinate trend is the secondary downtrend - i.e. the sequence of lower lows and lower highs - which represents the correction of the primary uptrend. The time unit used on the chart to visualize this trend is not decisive. The hourly chart is often well suited for this purpose. As can be seen on the following chart, the correction of the major uptrend runs in a "clean" downtrend in the next smaller trend size.
DAX hourly chart
As soon as this downward trend reverses, this is a signal for a new movement phase of the primary upward trend. A sequence of rising highs and rising lows should also become clearly visible again. In addition to the trend analysis according to the classic trend definition, it makes sense to observe the subordinate resistances and moving averages. A breakout above the downward trend line including the horizontal resistance area and the EMA 200 (red) on the hourly chart would be a clear signal and would indicate a continuation of the trend. If, on the other hand, new lows are generated right at the start of the week, this would indicate a continuation of the correction.
Author Tobias Schmid
Date: 22.04.2024