


For the fundamental valuation of a company, the profit generated is one of the most important factors. The company's profit serves as the basis for numerous share ratios that enable comparability between different shares. In addition to the absolute consideration of a company's profit or the relative consideration in comparison to other companies, profit growth in particular plays a decisive role and is a very reliable indicator of a company's success. In this article, you will learn how to determine the profit growth of a company and what to look out for.
Profit growth: definition
Earnings growth is the percentage increase in a company's earnings in a time period compared to the previous time period. Stock traders look at both quarterly and annual earnings growth. Continuous and high profit growth is often accompanied by a strong increase in the company's share price.
Calculation of profit growth
To calculate profit growth mathematically, the difference between the profit of the current time period and the profit of the previous time period is determined. The difference is then divided by the profit of the previous time period and multiplied by 100.
Profit growth = (profit current period - profit previous period) / profit previous period x 100
This is what they should pay attention to
Since there are several ways to determine a company's profit growth, you should always be aware of the data, time periods, and calculation method you are using.
Net income or earnings per share (EPS)
Earnings growth can either be calculated using the net profit figures or on the basis of earnings per share (EPS). Among stockbrokers, EPS is often used as the basis for calculation.
GAAP vs Non-GAAP
In the USA, it is customary to publish both earnings and earnings per share using two different calculation methods. The "United States Generally Accepted Accounting Principles" (US GAAP) are a standard for accounting in the USA. However, it also takes into account non-recurring income and expenses that can significantly affect earnings in individual quarters and years (e.g. the sale of a subsidiary, etc.). For this reason, investors often also look at non-GAAP earnings. Unfortunately, it is not always immediately obvious which data is used in each case.
Therefore, when calculating earnings growth, you should also be clear about which calculation method you are using (net income or EPS? GAAP or non-GAAP?).
Calendar year, fiscal year, TTM, MRQ
Earnings growth is generally determined on a quarterly and annual basis. In turn, there are various options: Profit growth on an annual basis can be calculated per fiscal year, per calendar year, or for the last 12 months (TTM = Trailing Twelve Months).
Since companies have defined different fiscal years, which often differ from the calendar year, there is a risk here that you lose the overview and no meaningful comparison between different companies or shares is possible. If you refer to the past calendar year, the data in the second half of the year may already be several months old.
For this reason, profit growth on an annual basis is often also indicated with the designation TTM. Here, the past 12 months are used and compared with the previous 12 months. With this method, you use the current data in each case and can compare the profit growth of different companies with each other.
When looking at earnings growth on a quarterly basis, you should be aware that due to the different fiscal years of different companies, the quarterly designations may differ from the calendar quarters. For example, Q1 2021 may include July 2020 to September 2020 for one company and January 2021 to March 2021 for another.
Therefore, you will often find the designation "MRQ" in data referring to a quarter. This abbreviation stands for "Most Recent Quarter" and refers to the last quarter for which results were published. Since some business models are influenced by seasonal factors, it is not uncommon to compare the most recent quarter with the same quarter of the previous year instead of the previous quarter.
Show profit growth in TWS
In the Trader Workstation (TWS) you can display the earnings growth for each share. There are three different key figures/descriptions or time periods available:
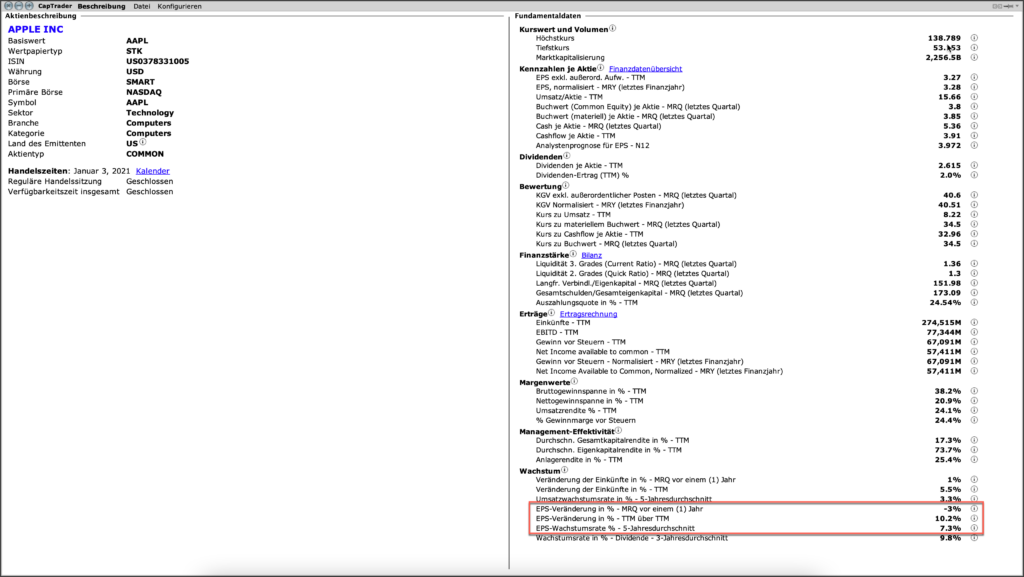
- EPS change in % - MRQ one (1) year ago
- Earnings growth in the last quarter compared with the same period of the previous year. Calculated on the basis of EPS.
- EPS change in % - TTM via TTM
- Earnings growth in the last 12 months compared with the same period of the previous year. Calculated on the basis of EPS.
- EPS growth rate % - 5-year average
- Average earnings growth over the last 5 years. Calculated on the basis of EPS.