Dear trader, dear stock market friends,
With a minus of 1.7 % on the first trading day and a minus of 3.1 % in the first trading week, the Nasdaq 100 had a weak start to the new stock market year 2024. This was preceded by a strong rally in recent weeks, which led to a net gain of 53.8 % for the full year 2023.
Both sentiment and all momentum indicators signaled a strongly overbought market, which is why the current correction should come as a surprise to very few investors.
Overarching upward trend intact
Aus markttechnischer Sicht ist eine Korrektur nach einer solch starken Aufwärtsbewegung als Zeichen eines gesunden Trends zu werten. Eine weitere ungebremste Fortsetzung der Rally hingegen wäre ein Zeichen der Übertreibung gewesen und hätte die Gefahr für ein “böses Ende” - das heißt einen deutlich stärkeren Kurseinbruch - erhöht.
Im nachfolgenden Wochen-Chart des Nasdaq 100 ist der langfristige Trendverlauf (Bewegungs- und Korrekturphasen) visualisiert. Die letzte Bewegung in Trendrichtung führte den Index von rund 14.200 Punkten auf einen neuen lokalen Hochpunkt bei rund 16.900 Punkten. Was die klassische Trend-Definition betrifft, gilt der langfristige Aufwärtstrend als intakt, solange der letzte lokale Tiefpunkt des Trends bei 14.100 - 14.200 Punkten nicht unterschritten wird.

Nasdaq 100 Index (Weekly)
Opportunities in the current market environment
As a result of the trend described above, positioning out of the correction in the direction of the overriding trend represents an attractive trading opportunity. This can be realized, for example, with directional trades in futures or ETFs on the Nasdaq 100. However, the index trend should also be taken into account for trades in individual stocks. Another attractive strategy in this market environment can be the sale of put options on the index, on index futures and on ETFs or shares; either with the aim of buying the underlying if necessary (cash-secured put) or purely speculatively, e.g. with bull put spreads.
Technical chart support
When and how exactly an entry is implemented depends on the individual strategy. It often makes sense to identify support levels and observe whether bullish signals occur here. Two support zones are shown in the following weekly chart.
Die erste Unterstützung befindet sich bei 16.000 - 16.100 Punkten. Hier fand der letzte charttechnische Ausbruch Anfang Dezember statt. Bemerkenswert ist dabei das stark angestiegene Volumen (roter Pfeil). Dies lässt vermuten, dass wir hier mit einer Gegenreaktion der Bullen rechnen können.
Bei 15.700 - 15.800 Punkten befindet sich die nächste wichtige Unterstützungszone. Auf diesem Kursniveau befindet sich der letzte lokale Hochpunkt des Aufwärtstrends aus dem Juli 2023. Zudem verläuft die Wochen-EMA 20 (lila) aktuell auf diesem Kursniveau. Abhängig von der zeitlichen Ausdehnung der Korrektur sehen wir zudem die Aufwärtstrendlinie (gestrichelte rote Linie), welche für Unterstützung sorgen könnte.
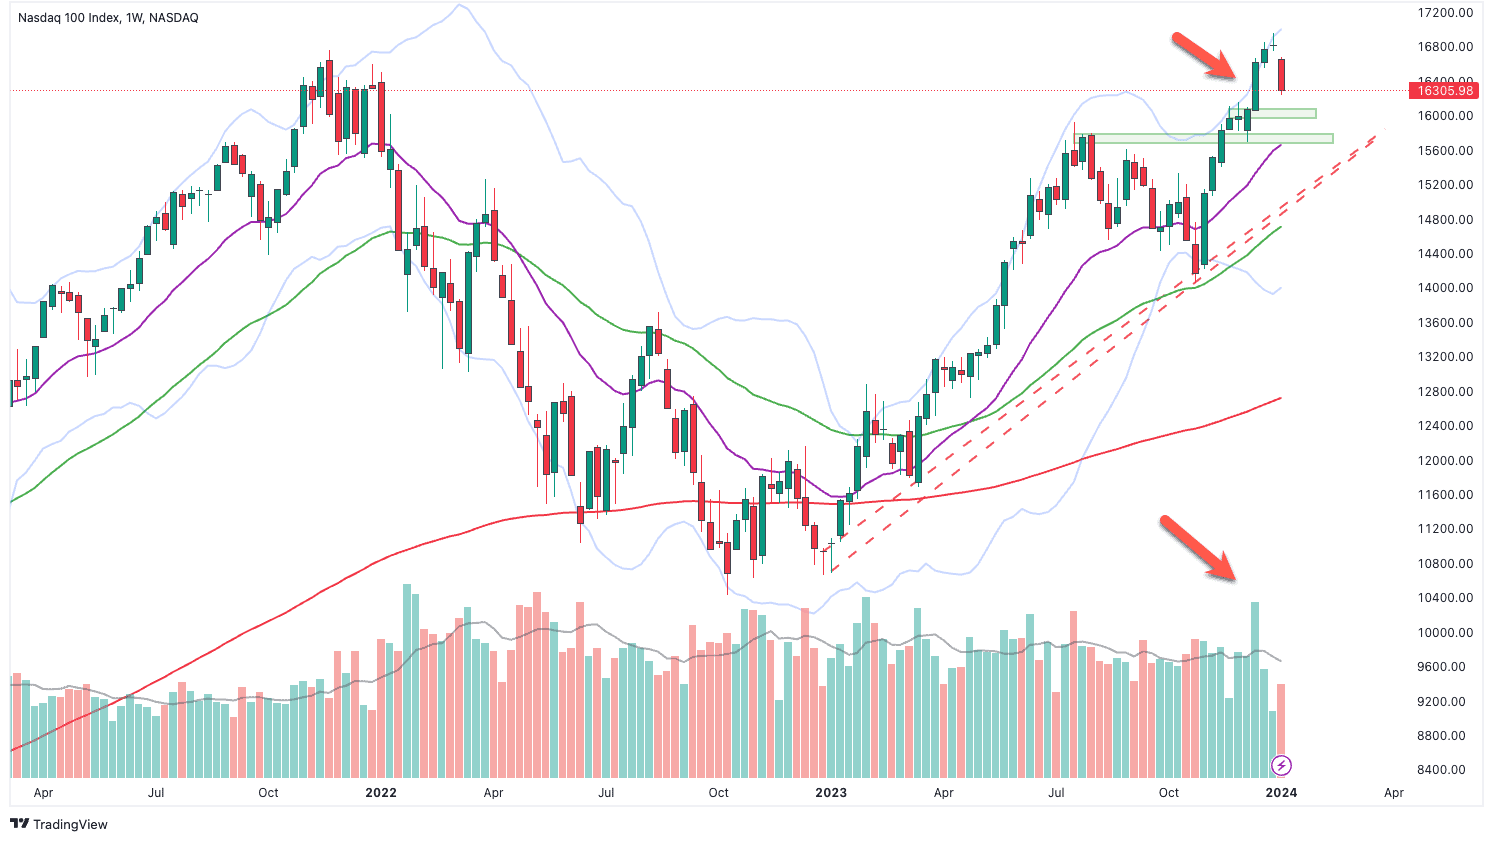
Nasdaq 100 weekly chart with support zones
The Fibonacci retracement levels are marked in the following daily chart. It can be seen that all three important correction levels coincide with the three local highs of the corrective movement in the summer months.
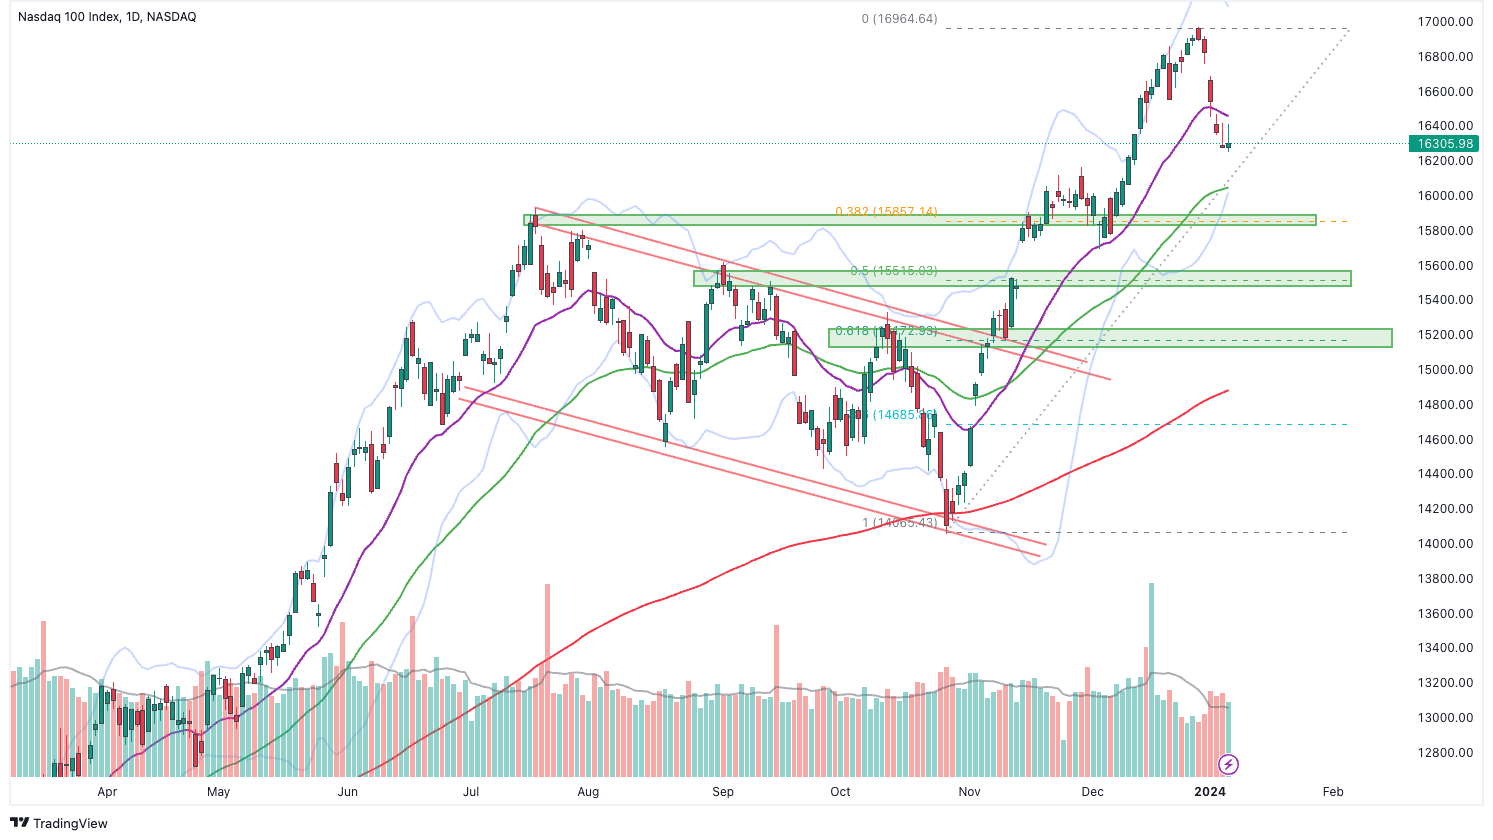
Nasdaq 100 daily chart with Fibonacci correction levels
Relative strength
Among the well-known American share indices, the Nasdaq 100 was the strongest index last year and technology shares led the upward trend of the broad market. In addition to the mere comparison of percentage performance, relationship charts are very well suited to recognizing the relative strength or weakness of a market and to identifying early changes in relative strength.
A relationship chart or relationship line is created when one underlying is divided by another. In this case, we use the well-known ETFs: QQQ and SPY. (The index itself can also be used.) The following chart shows that throughout 2023 the relation line trended upwards. Relationship charts can be analyzed using standard technical analysis tools. Moving averages and trend lines are very well suited to analyzing the trend of a relationship line in addition to the trend course.
The following chart still signals an upward trend based on the EMAs 20 and 50. However, if the Nasdaq 100 continues to show weakness in the coming weeks, there is a risk that the trend will be broken.
The analysis of the relative strength of technology stocks (QQQ:SPY) is also a tool that generates very valuable signals from the perspective of intermarket analysis. It can be seen, for example, that the bear market in 2022 was accompanied by a downward trend in the ratio line, i.e. by relative weakness in the Nasdaq 100. What is more, the ratio line announced the trend reversals of the broad market at an early stage or at least generated significant warning signals. The same happened at the beginning of 2023: Here, the relation line turned upwards and signaled a trend reversal of the broad market at an early stage.
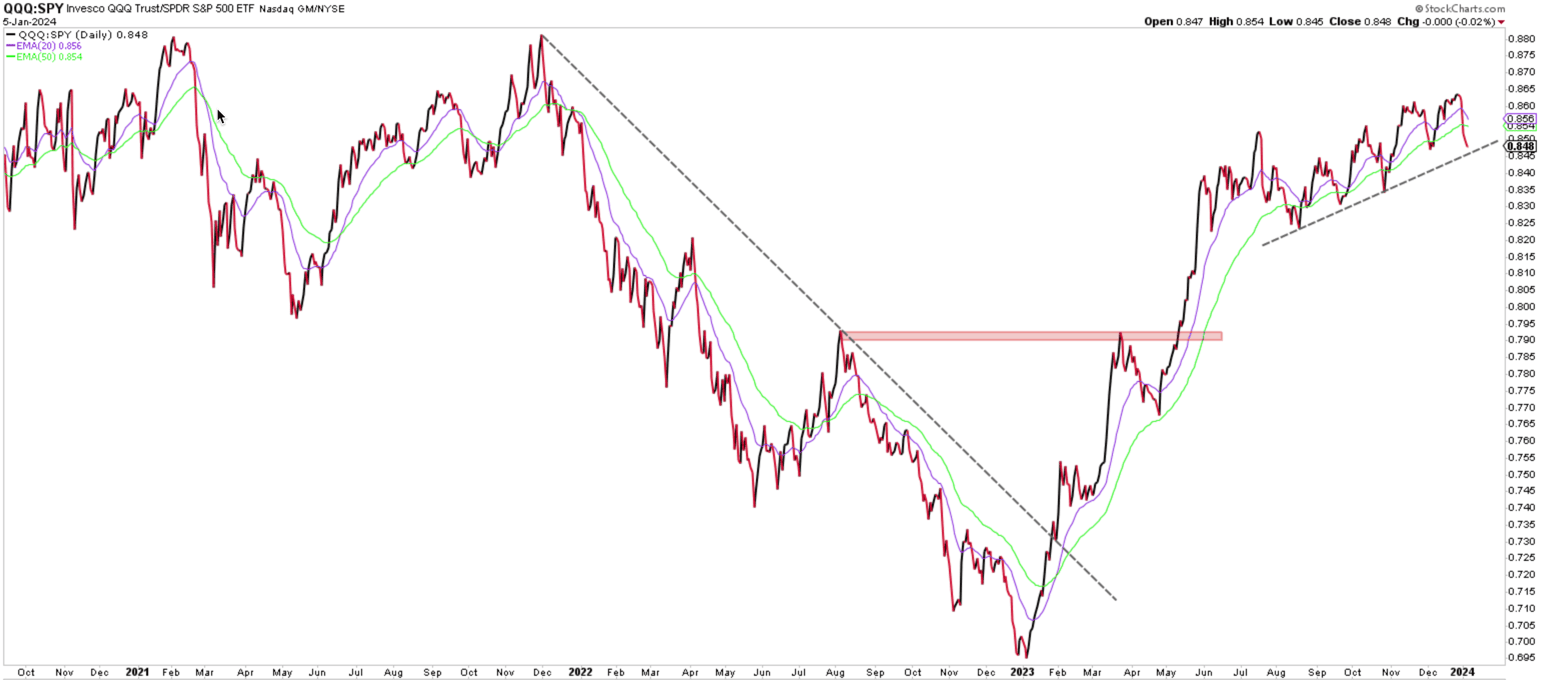
Relation line: Nasdaq 100 divided by S&P 500 (QQQ:SPY)
Author: Tobias Schmid
Date: 08.01.2024