Dear trader, dear stock market friends.
The Dow Jones Industrial Average reached a new all-time high in the second trading week of December 2023. The world's best-known share index was thus the first of the four most important US indices (S&P 500, Dow Jones, Nasdaq 100, Russell 2000) to achieve this after the bear market in 2022.
High expectations in the new year
Last year, the stock markets impressed with rising prices across the board. After the trend towards disinflation continued, the economy stabilized and the labour market proved robust, investor sentiment brightened again. The prospect of interest rate cuts ultimately boosted sentiment and led to a year-end rally worthy of the name.
However, the high expectations now also offer a certain degree of potential for disappointment. If, contrary to the currently prevailing consensus, a recession or economic weakness and/or a significant slump in the US labor market does occur, sentiment could turn again. The upcoming reporting season will provide important insights into the economic development and the sales and earnings figures of the large caps included in the Dow Jones.
Signs of overheating
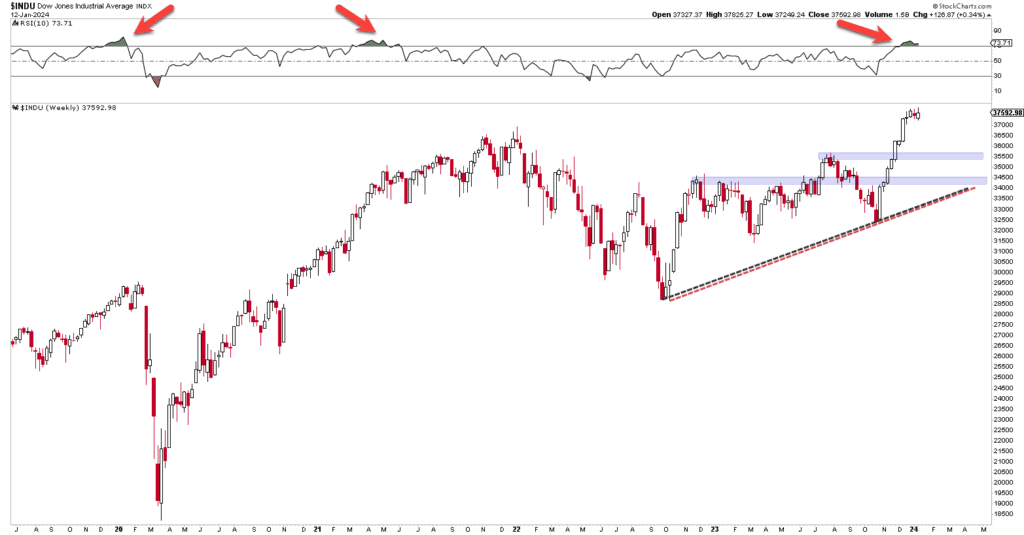
After the Dow Jones rose for nine consecutive weeks between October and December, we saw a consolidation at a high level in the first two weeks of the new year. The RSI (Relative Strength Index) with a period length of 10 weeks rose above 70 points, signaling an overbought level and increasing the probability of a correction or consolidation. In the last three cases in which the RSI rose above 70 points, there was a correction or at least a slowdown in the rise in the following weeks.
 Dow Jones Index weekly chart with RSI (10)
However, the RSI is basically nothing more than a momentum indicator. A so-called overbought level does not automatically mean that there must be a correction, but merely that the price has risen comparatively quickly. A look back at the years 2016 - 2018 shows that the RSI can also remain at an extreme level over a longer period of time in a bull market, accompanied by further price rises.
Between November 2016 and January 2018, the Dow Jones only knew one direction: up. This was despite the fact that the RSI was almost continuously quoted at levels above 70 points.
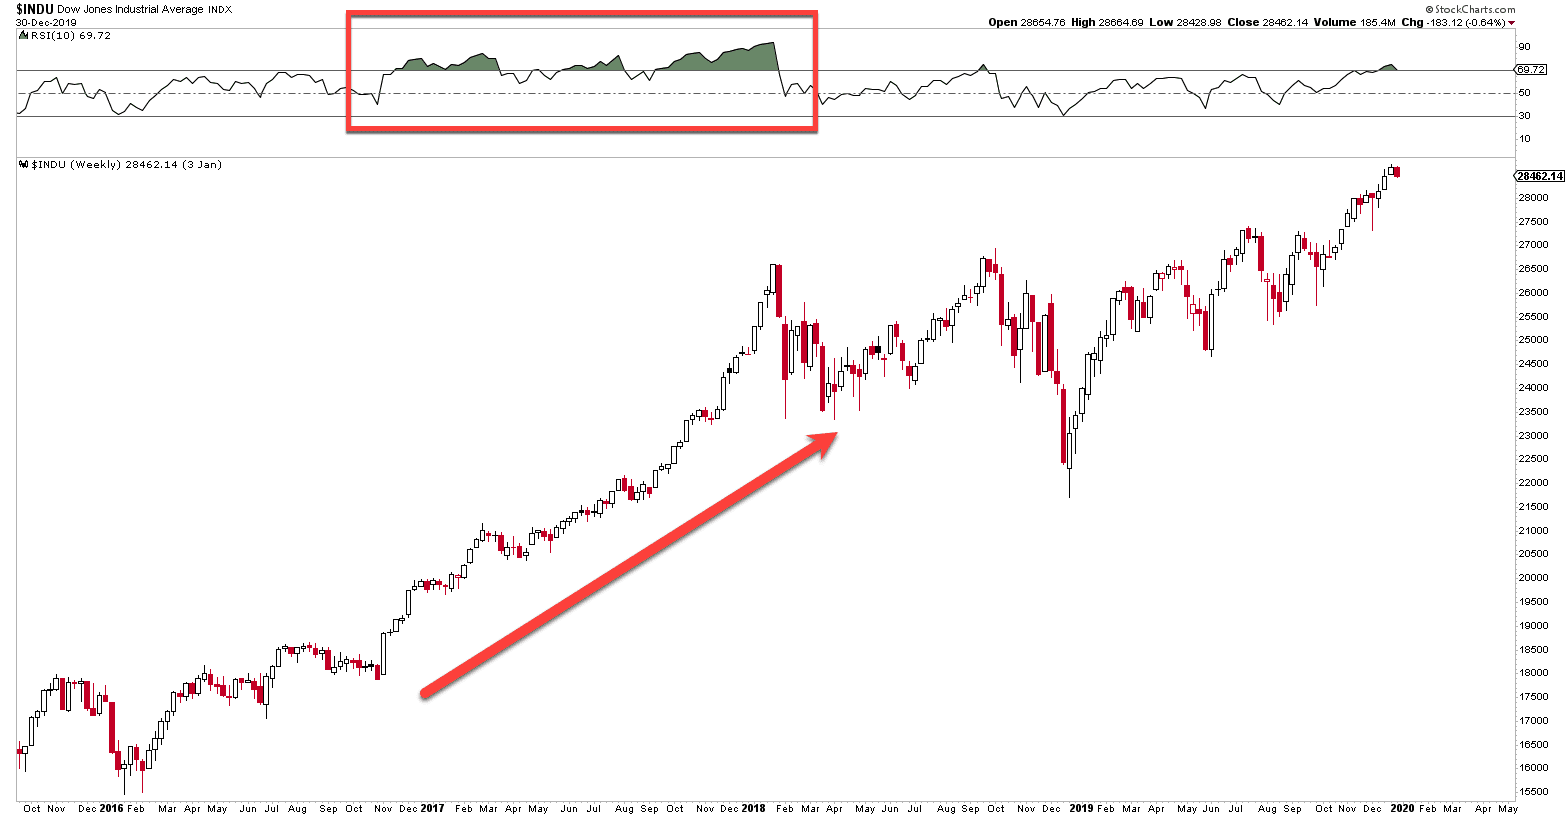 Dow Jones weekly chart: 2016 - 2019
What does the Dow Theory say?
A look at the weekly chart shows that the Dow Jones Index has recently formed a sequence of rising highs and rising lows.
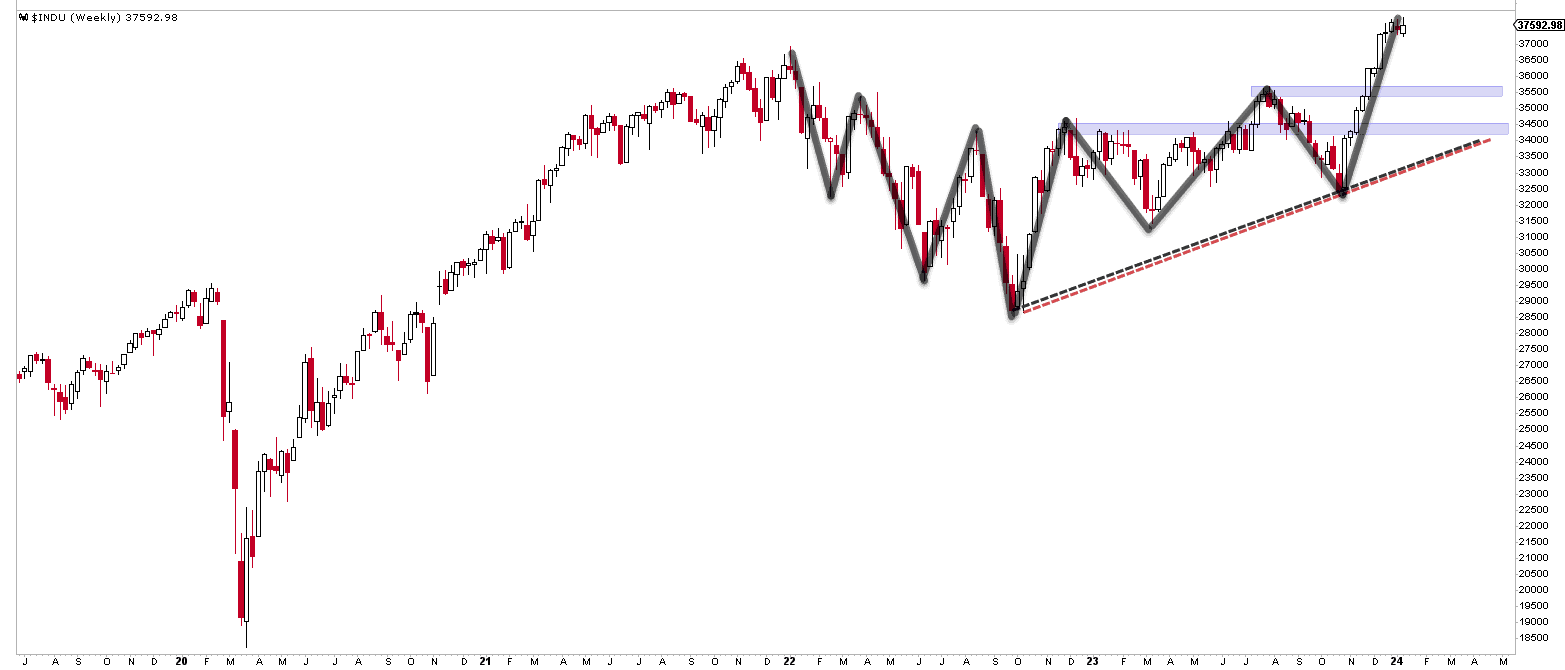
Dow Jones weekly chart: upward trend
This means that, according to the classic Dow theory, the index is in a primary uptrend. This applies until there are clear signals that the trend has reversed, which would require a trend break or a trend reversal (sequence of falling highs and falling lows).
As long as this does not happen, price declines are merely corrections of the primary trend. On smaller time frames, these corrections can become visible as secondary downtrends, as happened between August and October 2023, for example. However, we are currently only seeing a sideways movement at a high level. This means that there is not (yet) a price correction, but only a temporal correction or consolidation. In chart terms, this can be seen as a signal of strength. For the probability of a continuation of the correction to increase, the Dow Jones would at least have to break through the 37,000 point mark, including the daily EMA 20, to the downside.
If you are familiar with the Dow Theory mentioned above, you will also know that Charles Dow cited the analysis of volume as an important secondary indicator in addition to looking at price movements in the Dow Jones Industrial Index. Dow also emphasized that the "two indices", by which he meant the industrial index and the transportation index, must confirm each other.
Volume confirms the trend
As can be seen on the daily chart, the recent upward movement in the Dow Jones has been accompanied by rising volume. This is shown on the one hand by high volume bars on up days and by weak volume on down days; on the other hand, we can use an indicator such as the On Balance Volume (OBV), which puts the upward volume in relation to the downward volume. A rising OBV as well as an uptrend and breakout to new highs in OBV signal that the primary uptrend in the Dow Jones is confirmed by volume. This does not mean that the index will continue to rise unchecked. However, in the event of a correction, it does mean that the resumption of the overriding uptrend is likely.
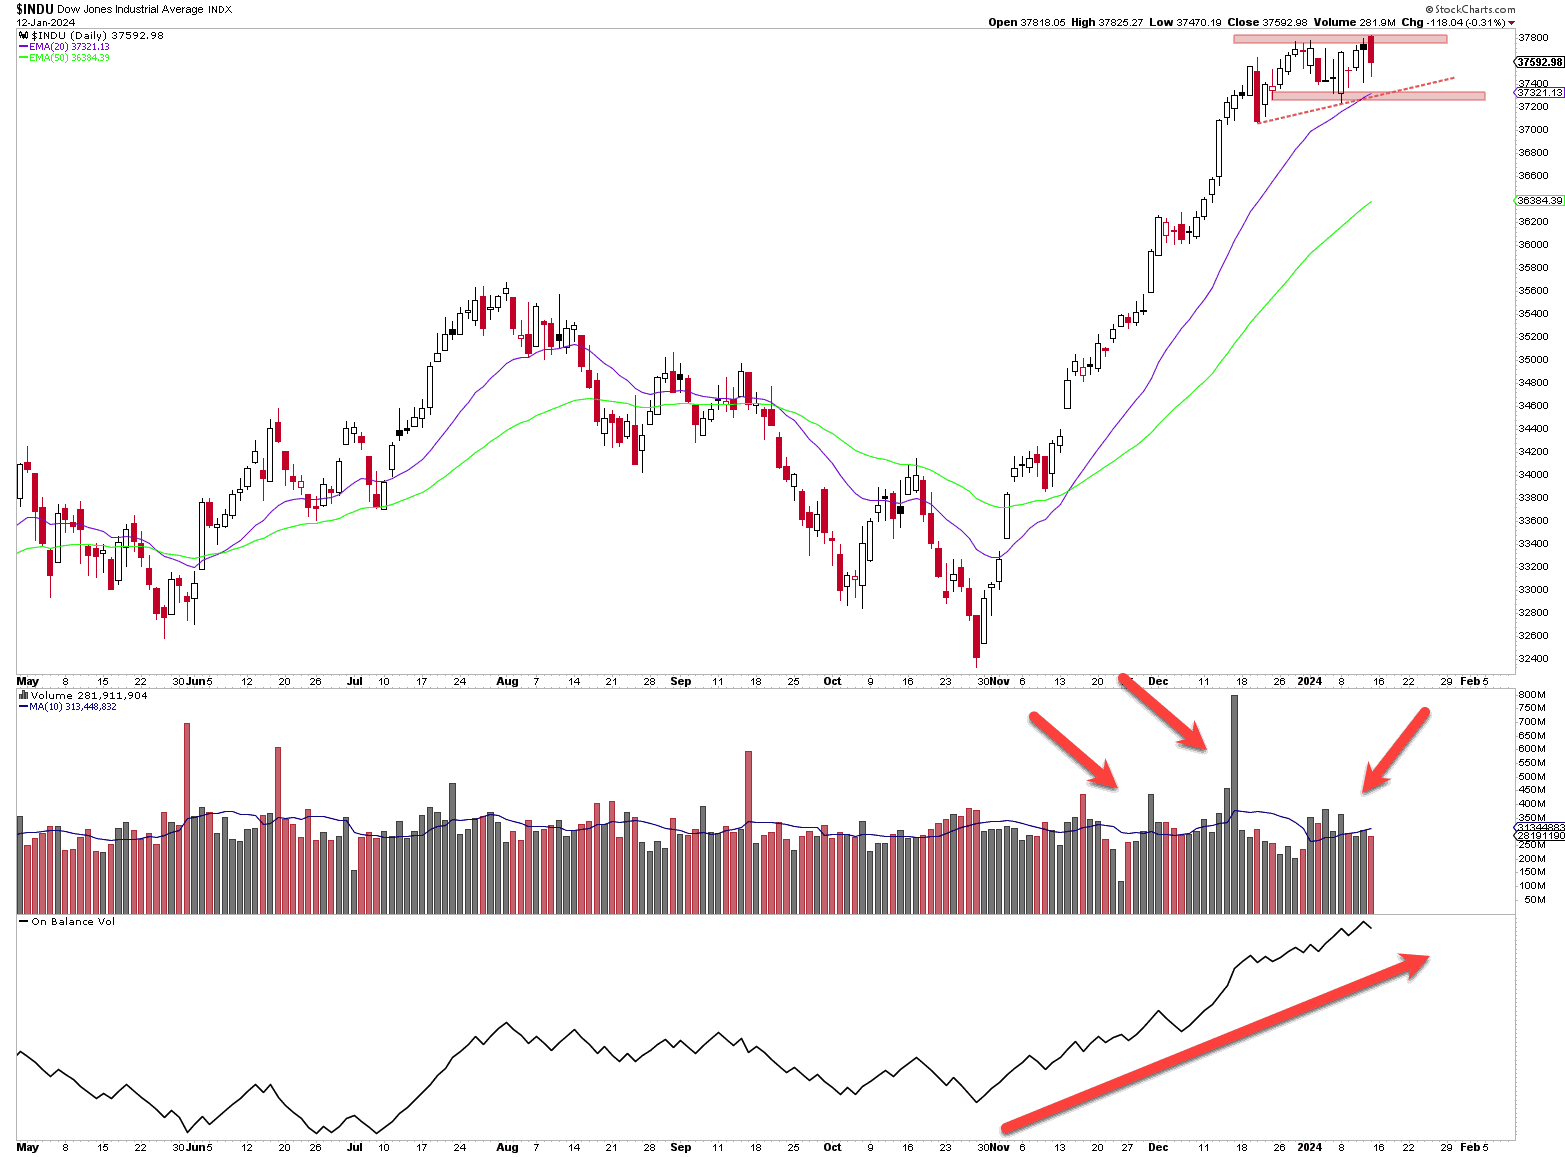
Dow Jones daily chart with volume and OBV
Transportation index with relative weakness
On the other hand, we see a small warning signal when we look at the Dow Jones Transportation Index. This index was also able to participate in the rally in November and December and rose to roughly the same extent as its big brother, the industrial index. However, the transportation index neither reached a new all-time high nor was it able to overcome the local high from the summer of 2023. In the last three weeks, we have also seen renewed relative weakness in the transportation index. This can be seen in the relationship line below the chart. Here, the Dow Jones Transportation Index is divided by the Dow Jones Industrials Index.
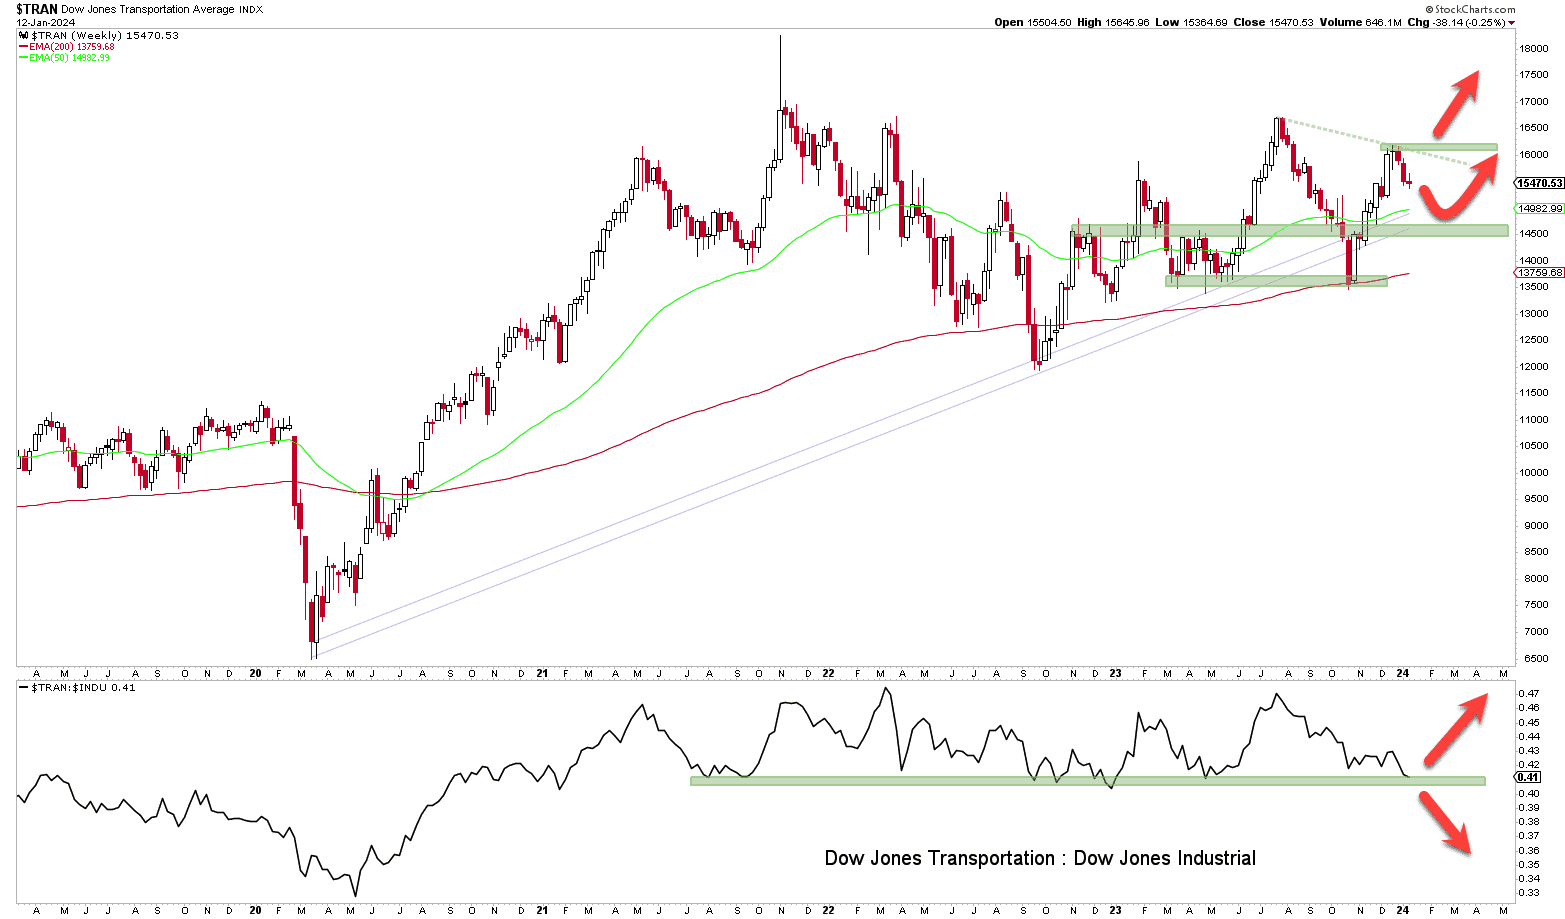
Dow Jones Transportation Index Weekly Chart
As you can see in the weekly chart, the relationship line is at a critical level. If the relative weakness of the industrial index continues and the relationship line breaks out to the downside, we can interpret this as a warning signal, which would also increase the probability of a correction in the Dow Jones industrial index. On the other hand, if the transportation index shows relative strength in the coming weeks, this would be a positive or trend-confirming signal.
Author: Tobias Schmid
Date: 15.01.2024