Your Broker for worldwide trading

S&P 500 Prognose & Analyse: Rally unter rückläufigem Volumen

Dear traders, dear stock market friends.

Nach einem schwachen April startete der S&P 500 mit Kursgewinnen in den Mai. In der vergangenen Handelswoche konnte der Index 1,85 Prozent zulegen und die positive Stimmung hielt somit an, nachdem in der Vorwoche die Fed und der Arbeitsmarktbericht Auslöser für eine Fortsetzung des Aufwärtstrends waren.

Bullischer Ausbruch aus der Korrektur-Formation

Mit dem Ausbruch über die 5120 Punkte hat der S&P 500 die abwärts verlaufende Trendlinie der Korrektur-Formation sowie den horizontalen Widerstandsbereich hinter sich gelassen. Ebenso wurden alle gleitenden Durchschnitte bullisch durchbrochen und das Momentum nahm wieder Fahrt auf. Die Aufwärtsbewegung endete am Freitag am oberen Bollinger-Band, einige Punkte unter dem Allzeithoch vom März.
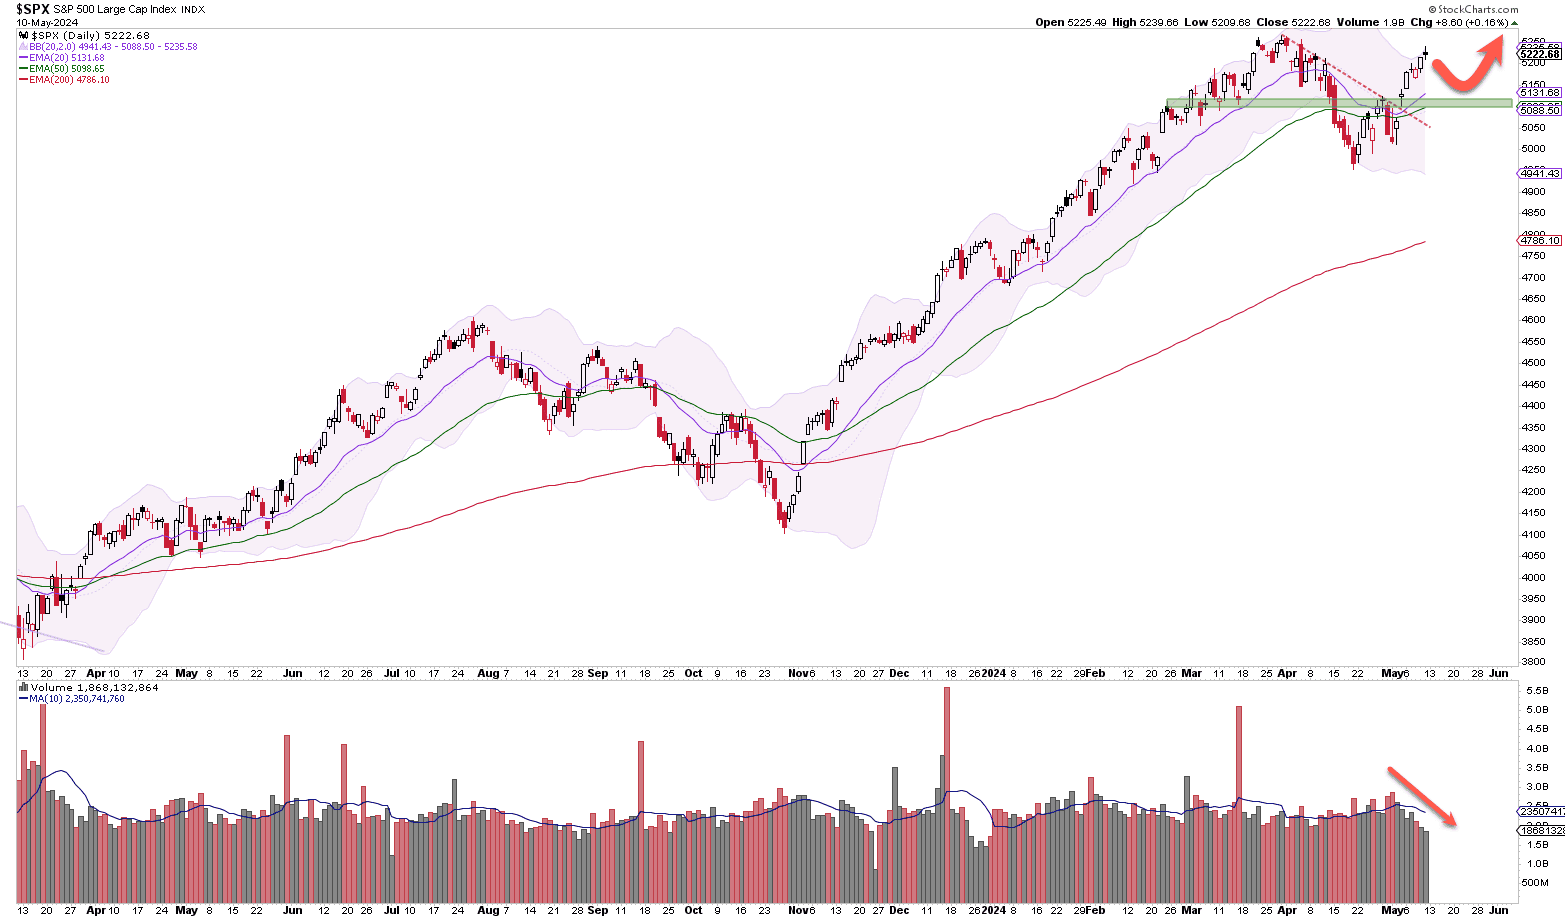
S&P 500 Index daily chart

Schwaches Volumen

Wie Sie in dem Chart oben sehen können, erfolgte die Aufwärtsbewegung der letzten Woche unter rückläufigem Volumen. Ein Anstieg unter hohem Volumen wäre ein weiteres positives Signal gewesen. Das schwache Volumen deutet darauf hin, dass der Rally möglicherweise kurzfristig die Luft ausgehen könnte. Das Volumen ist zwar ein wichtiger sekundärer Indikator, sollte aber nicht als alleiniges Handelssignal genutzt werden. Wichtig ist die Tatsache, dass der Aufwärtstrend völlig intakt ist. Sollte ein Rücksetzer erfolgen, kann dies als erneute Chance für bullische Trades gesehen werden (Buy The Dip). Die grün markierte Kurszone bei 5100 - 5120 Punkte wäre charttechnisch ein interessantes Unterstützungsniveau.

AD-Line generiert neues Hoch

Die Marktbreite signalisiert bzw. unterstützt derzeit ebenfalls das bullische Szenario. Der wichtigste Marktbreite-Indikator, die Advance-Decline-Line, konnte bereits auf ein neues Allzeithoch ansteigen. Historisch betrachtet ist die AD-Line ein sehr zuverlässiger Indikator, der häufig auch vorauslaufende Signale generiert. Die Wahrscheinlichkeit, dass auf ein neues Hoch in der AD-Line der Index nachzieht, ist sehr hoch.
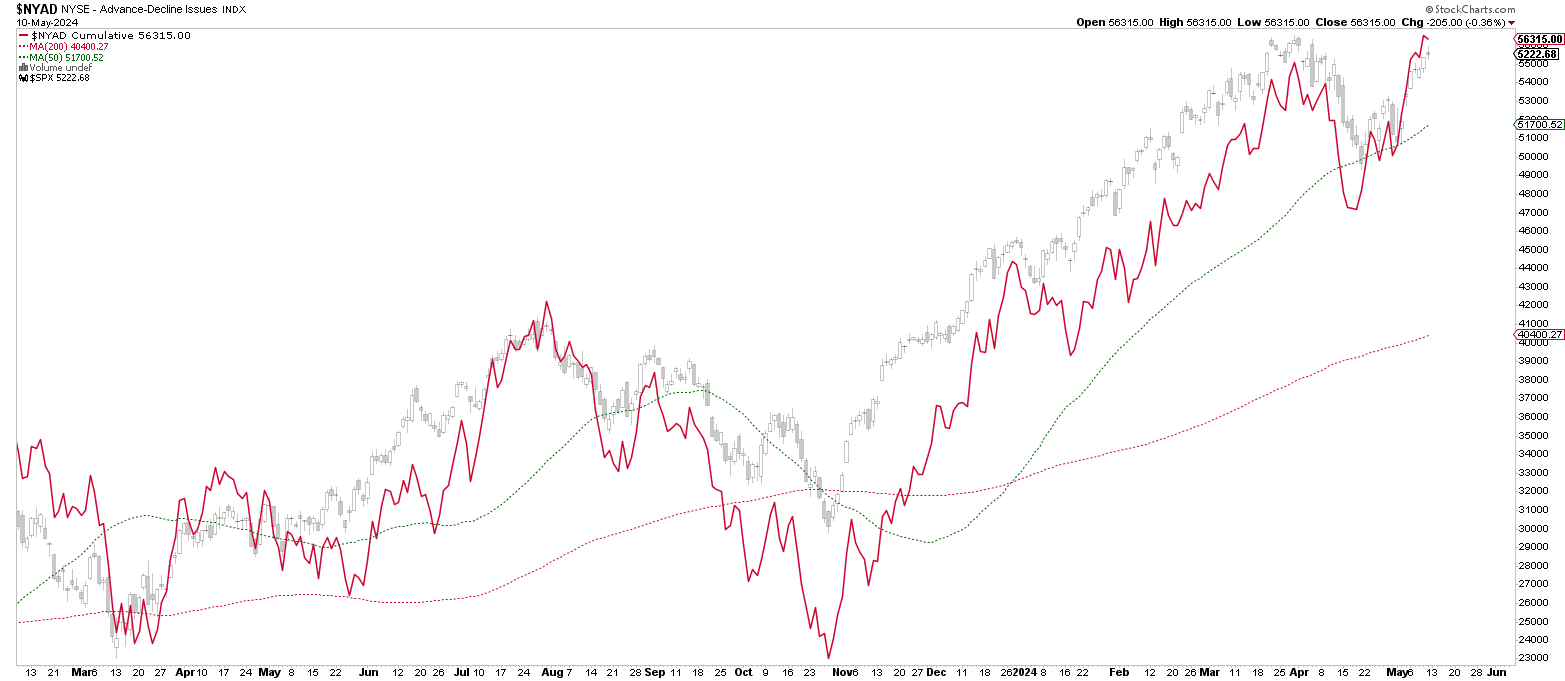
Advance-Decline-Line Tageschart

Viele Aktien mit neuen 52-Wochen-Hochs

Auch die Anzahl an Aktien mit neuen 52-Wochen-Hochs ist wieder angestiegen und ein weiteres Signal für die Stärke des breiten Marktes. Der nachfolgende Chart zeigt den S&P 1500 mit dem High-Low-Percent Indikator für den Index unter dem Chart. Der S&P 1500 besteht aus den Aktien des S&P 500 sowie den Aktien des S&P 400 (Mid Caps) und den Aktien des S&P 600 (Small Caps). Im Vergleich zum S&P 500 ist der S&P 1500 somit ein Index, der eine größere Marktbreite besitzt. Der High-Low-Percent Indikator ermittelt, wie viele Aktien des S&P 1500 an einem Handelstag neue 52-Wochen-Hochs generiert haben und wie viele Aktien auf ein neues 52-Wochen-Tiefs fielen. Die Anzahl Tiefs wird von der Anzahl Hochs subtrahiert und anschließend durch die Gesamtzahl an Aktien (in diesem Fall 1500) dividiert. Die in dem Indikator eingezeichneten horizontalen Linien bei +5 Prozent und bei -5 Prozent stellen Schwellenwerte bzw. Signal-Linien dar. Ein Ausbruch über 5 Prozent signalisiert demnach, dass vergleichsweise viele Aktien neue Hochs generieren, was sich als positives Signal für die Entwicklung des Index (sprich: einer Fortsetzung des Aufwärtstrends) bewährt hat.
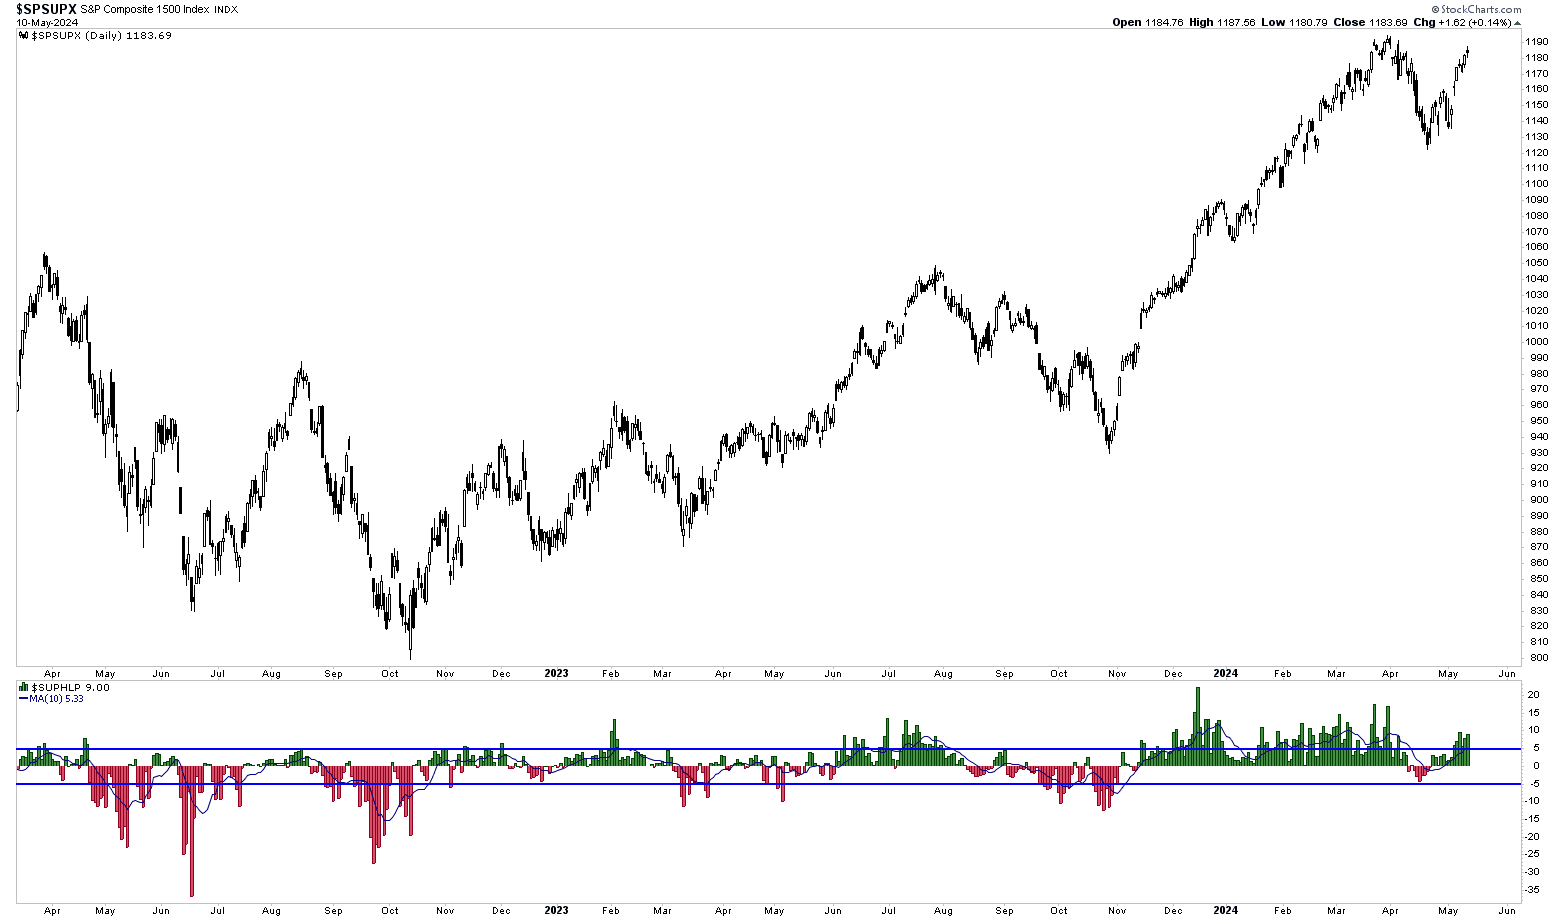
S&P 1500 Index Tageschart mit High-Low-Percent Indikator

Offensive Marktsektoren mit relativer Schwäche

Ein etwas anderes Bild ergibt sich bei der Betrachtung der einzelnen Marktsektoren des S&P 500. In einem gesunden Bullenmarkt, sollten die offensiven Marktsektoren die Rally anführen und sich stärker entwickeln als die defensiven Sektoren. In der letzten Woche waren jedoch die defensiven Sektoren vergleichsweise stark und die offensiven Sektoren zeigten relative Schwäche. Der nachfolgende Chart zeigt die Performance der elf Marktsektoren im Verhältnis zum S&P 500 in den letzten fünf Tagen. Eine positive Zahl bedeutet eine Outperformance gegenüber dem Index, eine negative Zahl signalisiert eine Underperformance bzw. relative Schwäche (keine absolute Schwäche).
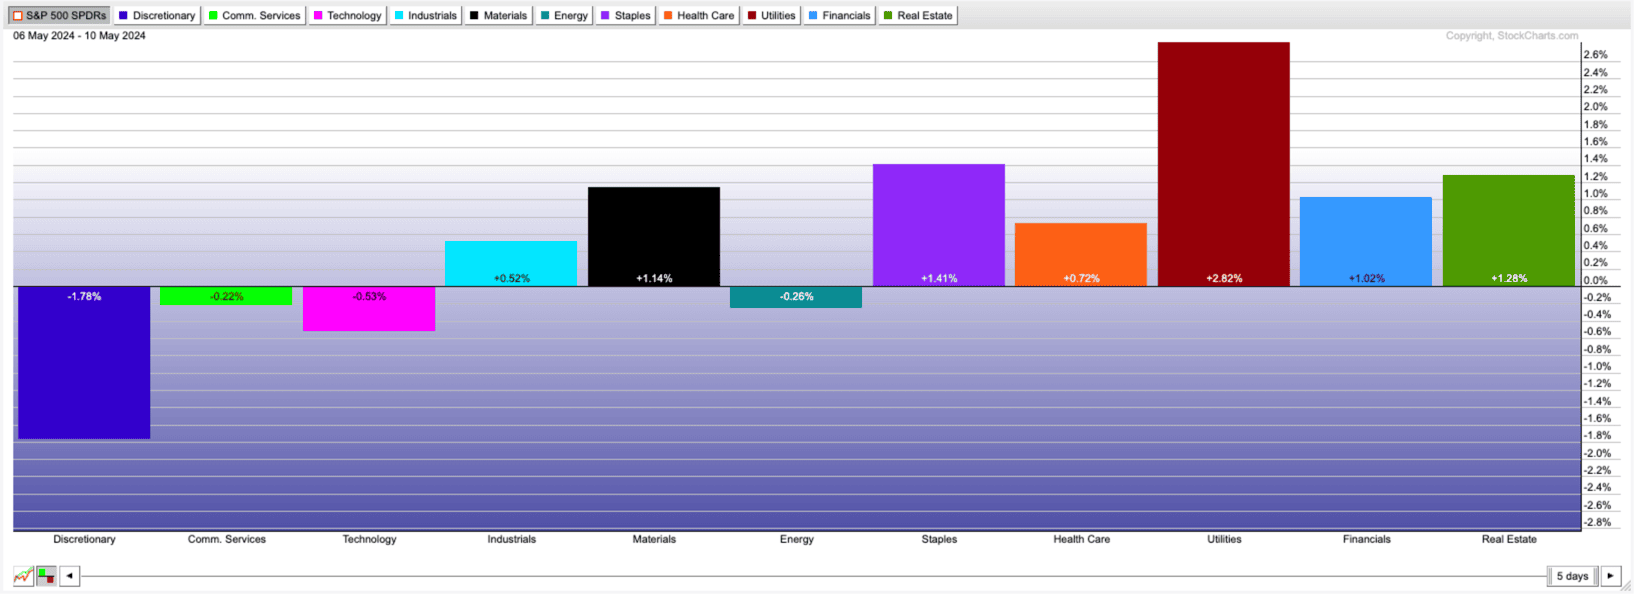
Relative Performance der elf Marktsektoren des S&P 500 im Vergleich zum Index

Wie zu erkennen ist, entwickelten sich die offensiven Sektoren Consumer Discretionary, Communication Services und Technology schwächer als der S&P 500. Die defensiven Sektoren Consumer Staples, Health Care und Utilities zeigen hingegen relative Stärke.

Die Signale sind derzeit also etwas gemischt. Der S&P 500 hat die Korrektur beendet und befindet sich in einer neuen Bewegungsphase des Aufwärtstrends. Das schwache Volumen deutet darauf hin, dass es nicht verkehrt ist, auf eine Korrektur zu warten und nicht auf die weit fortgeschrittene Bewegung aufzuspringen. Die Marktbreite-Indikatoren liefern indes bullische Signale, die für eine Fortsetzung des Trends sprechen. Allerdings sollte die Sektoren-Rotation in den nächsten Tagen und Wochen genau beobachtet werden. Aktuell zeigen die offensiven Sektoren relative Schwäche, befinden sich aber nach wie vor in intakten Aufwärtstrends. Bei einer Fortsetzung des Bullenmarktes sollten jedoch auch die offensiven Sektoren wieder Stärke zeigen, damit die Chancen auf eine Trendfortsetzung gut stehen.

Author: Tobias Schmid
Datum: 13.05.2024

A man with slicked-back hair and a trimmed beard, wearing a navy blue suit jacket and a white shirt, looks into the camera with a slight smile. Industrial background.
Tobias Schmid

Tobias Schmid has been a trader and analyst since 2008 and specializes in trading futures options and equity options. His strategies and analysis methods are based on a combination of technical analysis, intermarket analysis and sentiment analysis. Tobias Schmid is also the founder of Fomo Financea financial website for active traders, investors and options traders.

Mandatory information and disclaimer

This is a marketing communication within the meaning of Section 63 (6) of the German Securities Trading Act and does not contain investment strategy recommendations, investment recommendations or financial analyses in accordance with Section 85 of the German Securities Trading Act and Article 20 of the Market Abuse Regulation. It therefore does not fulfill the legal requirements to guarantee the objectivity of investment strategy recommendations/investment recommendations/financial analyses. CapTrader GmbH or its employees are therefore not legally prohibited from trading or providing services in the securities products mentioned therein prior to publication of the information.

Past performance, simulations or forecasts are not a reliable indicator of future performance. Mandatory information and limitation of liability for CapTrader and any third-party content providers can be found at https://www.captrader.com/marketingmitteilung/angaben
Please note that investing in financial instruments involves high risks and take note of our disclaimer and the mandatory legal information at the locations indicated.

  1. Mandatory information

Responsible: CapTrader GmbH, Elberfelder Straße 2, 40213 Düsseldorf; Commercial Register Number: HRB 86537 Düsseldorf Local Court; VAT ID DE323771603; Managing Directors Andreas Weiß, Christian Weiß, Michael Heyder; Tel: +49 211-740786-00, Fax: +49 211-740786-90.

Zuständige Aufsichtsbehörde: Bundesanstalt für Finanzdienstleistungsaufsicht, Graurheindorfer Straße 108, D – 53117 Bonn und Marie-Curie-Str. 24-28 D – 60439 Frankfurt am Main, Tel: 0228 4108 – 0 Fax: 0228 4108 1550 E-Mail: poststelle@bafin.de; Institutsnummer 10156708

Conflicts of interest CapTrader in marketing communications: CapTrader GmbH confirms that it does not hold any positions in the mentioned financial instruments beyond the positions mentioned in the marketing communication itself, if applicable. There are also no other conflicts of interest within the meaning of CapTrader GmbH's Financial Analysis and Marketing Communication Policy.

Conflicts of interest and mandatory disclosures by the third-party content provider for marketing communications with financial instrument recommendations: See under https://www.captrader.com/marketingmitteilung/angaben  to creators of third-party content

The copyright to the marketing communication is reserved. Reprinting and distribution is only permitted with our consent.

  1. Disclaimer

By accepting the content, the recipient accepts the binding nature of the limitation of liability.

a) Disclaimer for third-party content

CapTrader GmbH offers authors - such as editors, guest commentators, agencies and companies - the opportunity to publish comments, analyses, news and company announcements. Their opinions do not necessarily reflect the opinions and views of CapTrader GmbH and its employees. CapTrader GmbH assumes neither liability nor guarantee for this content. This applies in particular to incomplete or incorrectly reproduced reports, incorrect price information and editorial errors. Liability claims relating to material or immaterial damage caused by the use or non-use of the published information or by the use of incorrect or incomplete information are fundamentally excluded.

b) Exclusion of liability for CapTrader's own content

CapTrader has taken its own information in this marketing communication from sources believed to be reliable, but has not verified all such information itself. Accordingly, CapTrader makes no warranties or representations as to the accuracy, completeness or correctness of the information or opinions contained herein. Subsequent changes cannot be taken into account. The marketing communication does not constitute an offer or solicitation to buy shares of the issuer and is in no way a substitute for advice appropriate to the investor and the property. We cannot verify whether the information in the marketing communication is in line with your personal investment strategies and objectives. We recommend that you consult an investment advisor for advice that is appropriate to the investor and the property. The marketing communication cannot and should not replace a securities prospectus and/or expert investment advice required for an investment. It can therefore never be the sole basis for an investment decision. By accepting the marketing communication, the recipient accepts the binding nature of the above limitation of liability.

CapTrader provides the information despite careful procurement and provision only without guarantee for the correctness / completeness, timeliness or accuracy and availability of the stock exchange and economic information, prices, rates, indices, general market data, valuations, assessments and other accessible content held and displayed for retrieval. This also applies to third-party content. Historical observations and forecasts are not a reliable indicator of future developments. The facts presented in particular in connection with product information are for illustrative purposes only and do not permit any statements to be made about future profits or losses. Any conditions stated are to be understood as non-binding indications and are dependent on market developments on the day of conclusion.

CapTrader accepts no liability for any direct or indirect damage caused by and/or related to the distribution and/or use of this marketing communication.

The information, opinions and statements correspond to the status at the time of preparation of the marketing communication. They may be outdated due to future developments without the publication being changed.

CapTrader is not obliged to update, amend or supplement the information in this marketing communication if a circumstance mentioned in this publication or a statement, estimate or forecast contained therein changes or becomes inaccurate. The presentation of the performance of financial instruments over previous periods does not provide a reliable indication of their future performance. No guarantee can therefore be given for the future price, value or income of any financial instrument mentioned in this publication.

Despite careful control of the content, we assume no liability for the content of external links. The operators of the linked pages are solely responsible for their content.

Distribution: This publication may only be distributed in accordance with the laws of the respective countries, and persons in possession of this publication should inform themselves about the applicable local regulations. The information contained herein is not intended for natural or legal persons who, due to their place of residence or business, are subject to a foreign legal system that imposes restrictions on the distribution of such information. The contents are therefore exclusively in German. In particular, this publication contains neither an offer nor an invitation to purchase securities to citizens of the USA, Great Britain and Australia.

Taxes: The tax treatment of financial instruments depends on the personal circumstances of the respective investor and may be subject to future changes, which may also have a retroactive effect.

Historical observations and forecasts are not a reliable indicator of future developments. The facts presented in particular in connection with product information are for illustrative purposes only and do not permit any statements to be made about future profits or losses. Any conditions stated are to be understood as non-binding indications and are dependent on market developments on the day of conclusion.

CapTrader accepts no liability for direct or indirect damage caused by and/or in connection with the distribution and/or use.

The information, opinions and statements correspond to the status at the time of preparation of the marketing communication. They may be outdated due to future developments without the publication being changed.

CapTrader is not obliged to update, amend or supplement the information if a circumstance mentioned in this publication or a statement, estimate or forecast contained therein changes or becomes inaccurate. The presentation of the performance of financial instruments over previous periods does not provide a reliable indication of their future performance. No guarantee can therefore be given for the future price, value or income of any financial instrument mentioned in this publication.

Despite careful control of the content, we assume no liability for the content of external links. The operators of the linked pages are solely responsible for their content.

Distribution: This publication may only be distributed in accordance with the laws of the respective countries, and persons in possession of this publication should inform themselves about the applicable local regulations. The information contained herein is not intended for natural or legal persons who, due to their place of residence or business, are subject to a foreign legal system that imposes restrictions on the distribution of such information. The contents are therefore exclusively in German. In particular, this publication contains neither an offer nor an invitation to purchase securities to citizens of the USA, Great Britain and Australia.

Taxes: The tax treatment of financial instruments depends on the personal circumstances of the respective investor and may be subject to future changes, which may also have a retroactive effect.

Email:

info@captrader.com

Send e-mail

Phone:

Hotline (Germany)
0800-8723370

Hotline (International)
00800-08723370

Further contact options