Dear traders, dear stock market friends,
With a weekly performance of -0.3 %, the S&P 500 ended a three-week winning streak in the past trading week, which took the index to new all-time highs. The second-fastest bear market of all time (between the record high on February 19 and the intraday low on April 7, the S&P 500 lost 21 % in just 34 trading days; the only faster period was during the Covid crash in 2020) was followed by an equally record-breaking recovery rally: just 56 trading days passed between the low on April 7 and the new all-time high on June 27. According to Dow Jones Market Data, this was the fastest return to a new all-time high after a drawdown of at least 15 %.
The extent of the rally since the beginning of April has also been historic: +31 % in less than three months. The percentage recovery is one of the five strongest or fastest rallies since 1950. The driving factors behind the upward movement were, among others:
- explosive demand for AI hardware and software - led by the record run of Nvidia, whose stock market value recently exceeded the USD 4 trillion mark;
- a temporary respite in the trade conflict after President Trump announced a 90-day tariff deferral at the beginning of April and the stock markets subsequently staged their strongest one-day rally in decades;
- surprisingly robust US labor market data, which dampened fears of recession;
- as well as the prospect of the first Fed interest rate cuts later in the year, provided that the inflationary pressure caused by the tariffs remains moderate.
Technology and cyclical sectors lead the rally
Since the start of the rally on April 7, stocks from the cyclical market sectors of the S&P 500 have been among the leaders. The following performance chart shows the absolute performance of the eleven market sectors of the S&P 500 on a daily closing price basis from April 7 to July 11.
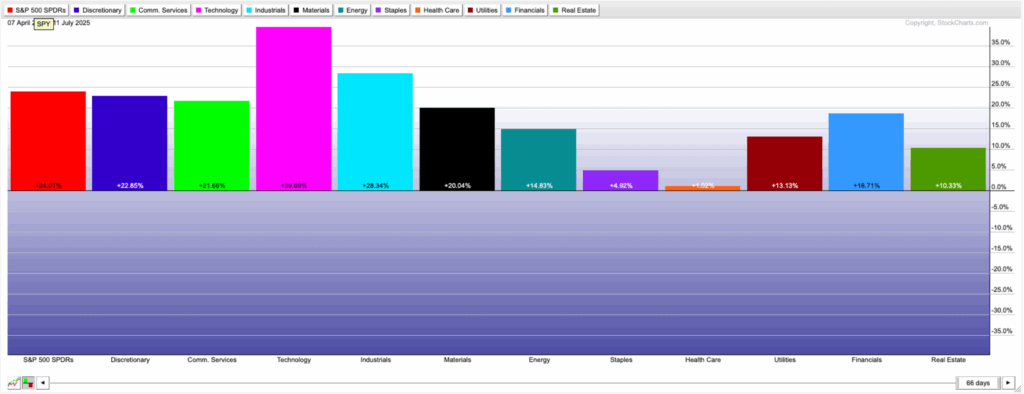
While the S&P 500 (SPY) rose 24.01 %, the offensive Consumer Discretionary and Communication Services sectors roughly kept pace with the index with gains of around 23 % (Consumer Discretionary) and 22 % (Communication Services) respectively. The Technology sector was by far the strongest sector with a performance of + 39.69 %, followed by the equally pro-cyclical Industrials sector with an increase of 28.34 %.
Although the defensive sectors Consumer Discretionary, Health Care and Utilities are also up in absolute terms, they lagged behind the performance of the S&P 500, in some cases significantly. This can be seen even more clearly when looking at the relative performance chart (see below), which shows the difference in performance between the individual market sectors and the S&P 500.
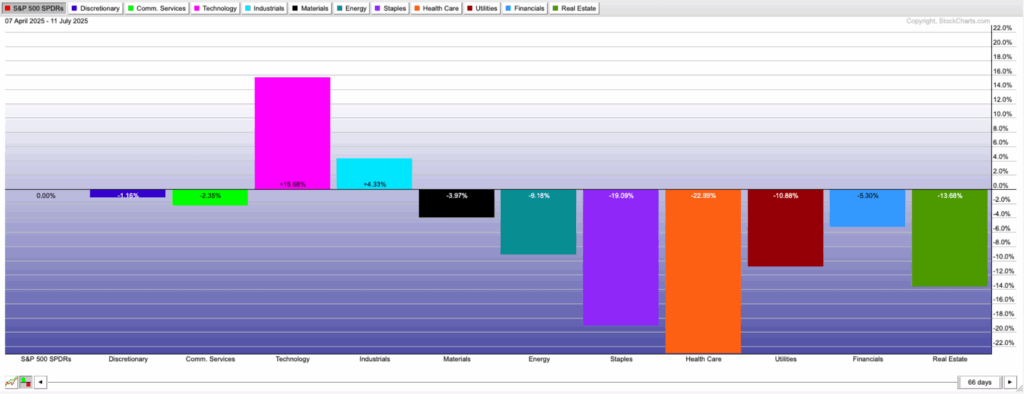
The sector rotation just described (capital outflows from defensive sectors and inflows into offensive sectors) is a very typical sign of increasing risk appetite among investors and usually only occurs in bull markets. As long as the relative strength of the offensive market sectors continues, the chances of a continuation of the primary uptrend are very good.
Market breadth brightens
In addition to the analysis of sector rotation, all key market breadth indicators are also providing bullish signals. The advance-decline line rose to new highs a few weeks ago. The number of stocks with new 52-week highs compared to the number of stocks with new 52-week lows is also clearly in bullish territory.
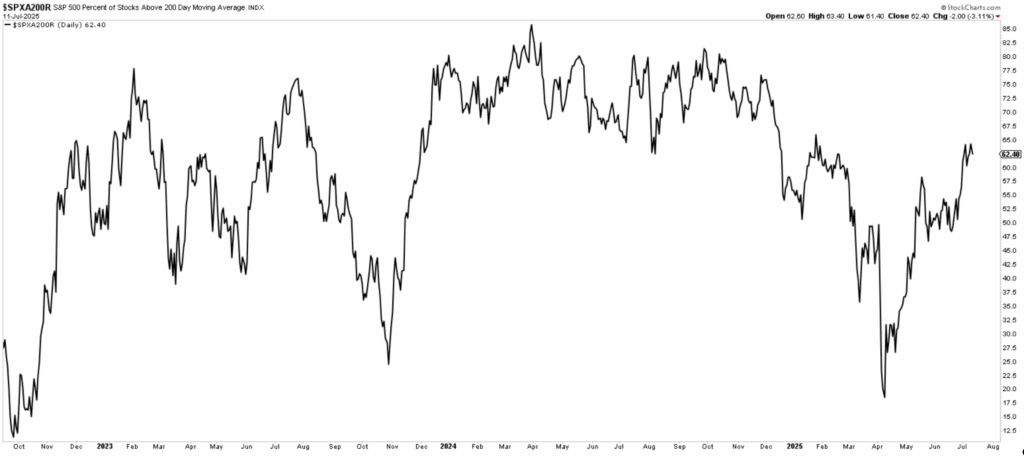
The fact that the uptrend is supported by the broad mass of all stocks in the S&P 500 can also be seen by looking at the following chart, where you can see that more than 62 % of all stocks in the S&P 500 are now trading above the SMA 200.
Market overbought in the short term
Both the price action and the analysis of sector rotation and market breadth clearly point to a continuation of the bull market. However, this does not mean that there cannot be short-term corrections, especially after such a strong rally as we have seen in the last three months.
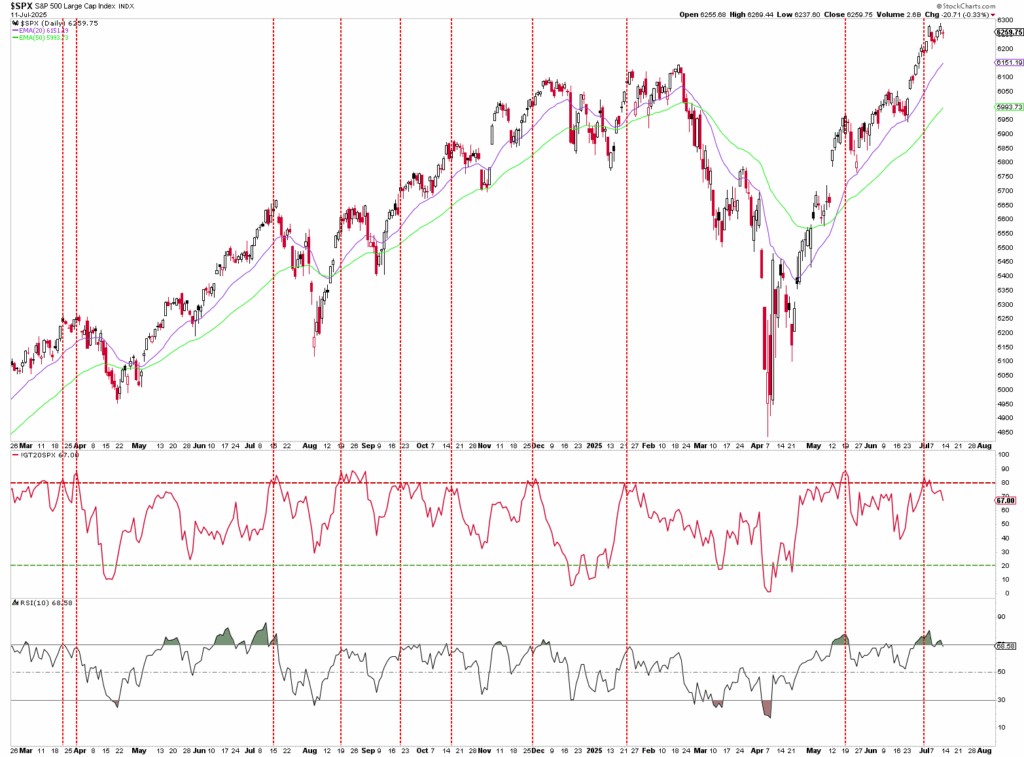
In the last two weeks, the percentage of stocks in the S&P 500 trading above the SMA 20 reached the 80% mark. As you can see on the chart below, this has often been a signal in the last year and a half, occurring before a short-term correction. The RSI (10) is also at an overbought level. The fact that the S&P 500 is consolidating only moderately in this situation so far and no sustained correction is occurring at the price level can be interpreted as a further signal of strength.
Seasonal headwinds possible in August and September
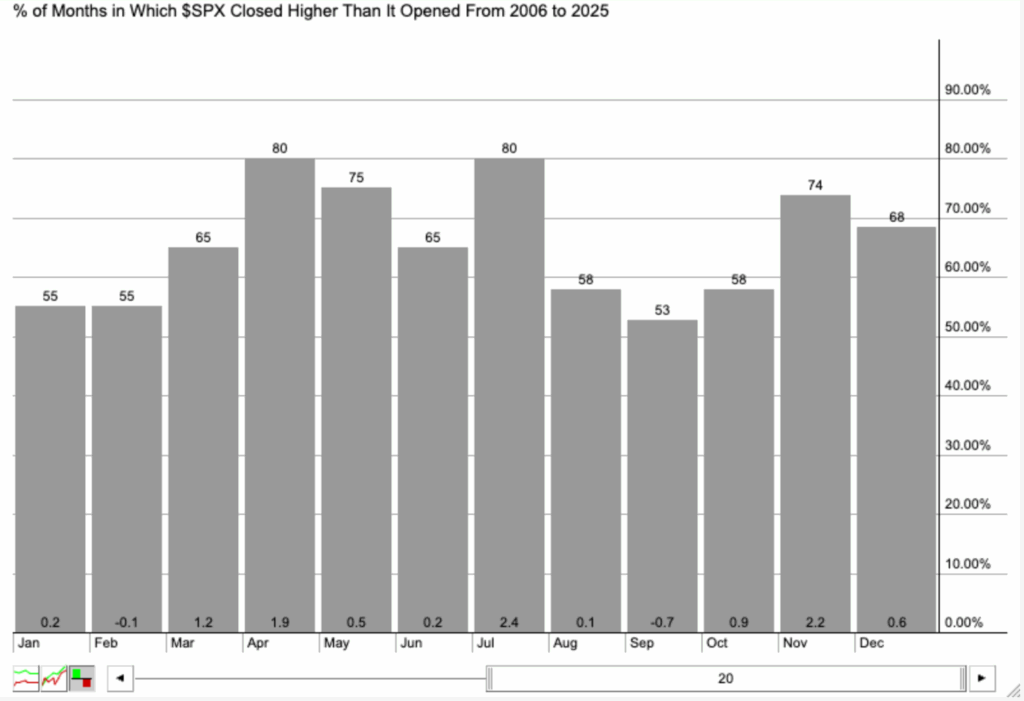
The current upward movement in the S&P 500 and the achievement of new all-time highs go hand in hand with a seasonal upward trend. July has been the strongest month for the index in the last 20 years. In 80 % of all cases, July ended positively, with an average performance of 2.4 %.
However, August and September will be two of the weakest months of the year.
Fundamental outlook
The reporting season starts in mid-July with the results of the major banks (including JPMorgan, Bank of America and Goldman Sachs). The focus is likely to be on margins in particular, as well as guidance and statements on the cost impact of tariffs. At the same time, the ultimatum for Trump's threatened 30% import tariffs on goods from the EU and Mexico runs until August 1. In addition, the FOMC meeting on July 30/31 and the publication of the June CPI data on July 17 are coming into focus. The latter are likely to decide whether the first interest rate cut in September, which several Fed representatives have held out the prospect of, will become a reality.
Author: Tobias Schmid
Date: 14.07.2025