Your Broker for worldwide trading

Historically high valuation of the S&P 500 justified?

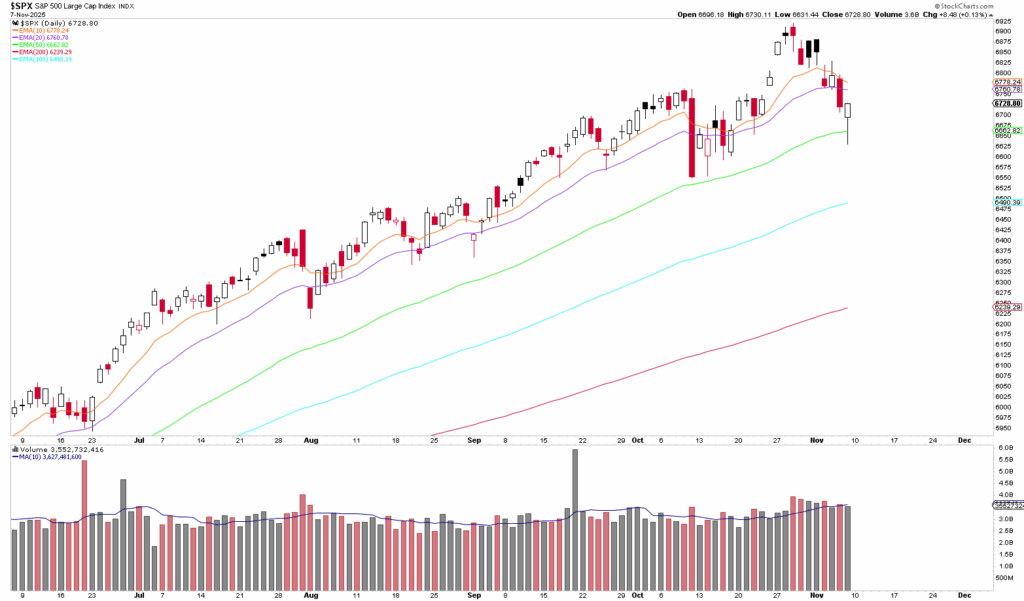
A candlestick chart of the S&P 500 Index with moving averages and volume bars showing price movement, trading volume and historical valuation from late June to early November.

Dear traders, dear stock market friends.

The US equity markets came under significant downward pressure in some cases in the past trading week, leading to a fall in the S&P 500 of 1.6 %. The correction was triggered by concerns about the very high valuations of AI shares and increasingly tense market breadth.

Concerns about the market overheating

The price rally in recent months has led to a historically high valuation of the S&P 500. At 220 %, the so-called Buffett indicator, which measures the ratio of total US stock market capitalization to GDP, signals that the market will be as expensive in 2025 as it was at the height of the dotcom bubble. 

Other key figures also confirm the high rating:

  • The cyclically adjusted Shiller P/E ratio of the S&P 500 is close to 40.
  • And the forward P/E ratio for the next twelve months is just under 23.
  • The forward P/E ratio of the Nasdaq-100 even rose to around 27-28 points.

At the same time, the majority of the index gains are attributable to a small number of stocks. The technology sector now accounts for 35 % of the S&P 500's weighting, and the Magnificent 7 (Apple, Microsoft, Alphabet, Amazon, Meta, Nvidia and Tesla) also combine for around 35 % of the index's total market capitalization. At around 8 %, Nvidia alone weighs as much as the smallest third of the index combined. 

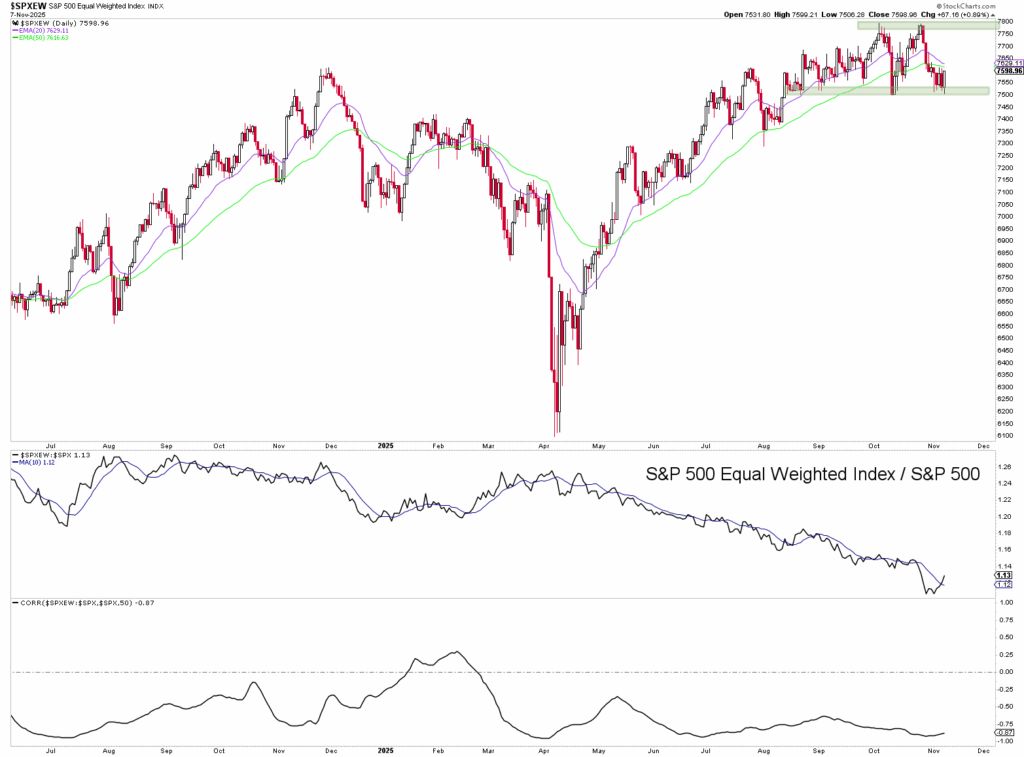
The ratio between the S&P 500 Equal Weighted Index and the “normal” S&P 500 Index weighted by market capitalization has therefore fallen to its lowest level since 2003.

The combination of record-high multiples and the strong index weighting of the leading stocks therefore makes the index susceptible to corrections should the narrative of the AI boom change.

Historically high earnings growth in the current reporting season

Historically, however, a high valuation is not an indicator of poor forward performance for the S&P 500, especially when strong growth is behind the high valuation.

The current Q3 reporting season is exceeding even optimistic expectations: For 91 % of S&P 500 companies already reporting, „blended“ earnings growth is +13.1 % year-over-year. This is the fourth consecutive quarter of double-digit growth and thus the longest such streak since 2021. At the same time, sales rose by +8.3 %, the highest figure since Q3 2022. The net operating margin also rose to a new record high of 13.3 %.

However, it is noticeable that the momentum is once again strongly concentrated on the Magnificent 7, whose EPS growth is significantly above the market average.

With a forward P/E ratio of 22.7, the S&P 500 is clearly trading above the five- and ten-year averages. This would only be justifiable if the expected earnings growth of around +12 % for 2025 and +14-16 % for 2026 actually holds. If earnings growth collapses or the megacaps deliver disappointments, there is a risk of a noticeable multiple contraction. The sustainability of earnings growth is therefore one of the most important factors for the medium-term development of the equity market.

Market breadth cools in the short term

As mentioned above, market breadth plays an important role when it comes to the "health" of a bull market. As soon as there is a clear divergence between the development of the index and the development of market breadth, this would be a clear warning signal. Although the recent weakness in market breadth was a short-term warning signal, the signals from the analysis of market breadth are still bullish in the medium to long term.

The Advance Decline Line (one of the most important market breadth indicators) is still in a clear uptrend and rose to a new all-time high at the end of October, thus confirming the long signal in the S&P 500. The decline in the last two weeks therefore merely represents a correction within the long-term uptrend. The next important signal in the A/D line will be a breakout above or below one of the zones marked with the red lines.
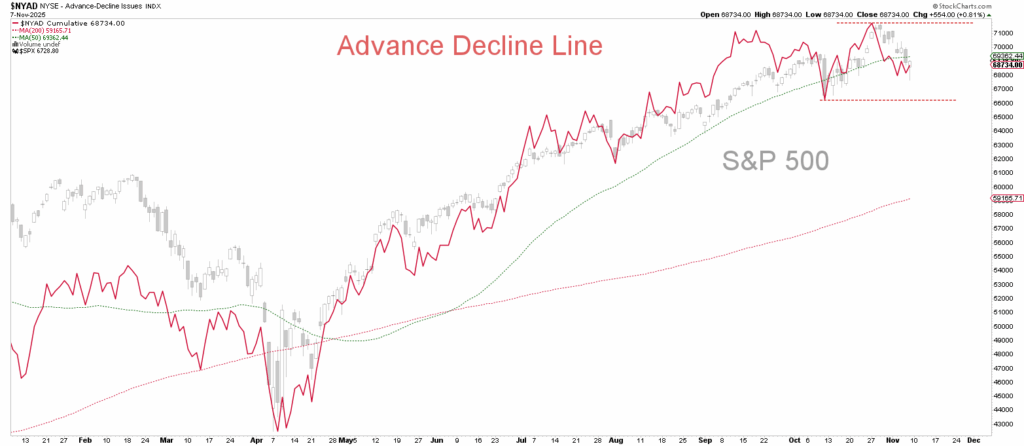
Line chart of the Advance-Decline Line and the S&P 500 from February through November, with the Advance-Decline Line trending down and the S&P 500 trending up.
Advance Decline Line Tageschart

S&P 500 Equal Weighted Index with relative weakness

Another interesting index from the area of market breadth analysis is the S&P 500 Equal Weighted Index, also mentioned above. In contrast to the S&P 500, which is weighted by market capitalization, each company has exactly the same index weighting, namely 0.2 % (100 % / 500). The following chart shows that the Equal Weighted Index is showing relative weakness in the current year; however, this is not necessarily a negative signal for the broad market as long as the index is in an upward trend. However, if the index falls below the support level of 7,500 points, there is a risk of further losses, at least in the short term.
A candlestick chart of the S&P 500 Equal Weighted Index with the label "Automatically saved draft" and two line indicators below it shows the relative performance development from mid-2019 to the end of 2020.
S&P 500 Equal Weighted Index daily chart

Rebound on Friday evening

After the S&P 500 came under significant pressure over the course of last week, a strong countermovement followed on Friday evening. After interim losses of just under 1.5 %, the index even closed slightly higher on Friday, generating a clear reversal signal above the daily EMA 50 (green). This signals a return of the bulls and increases the probability of a recovery in the new trading week.
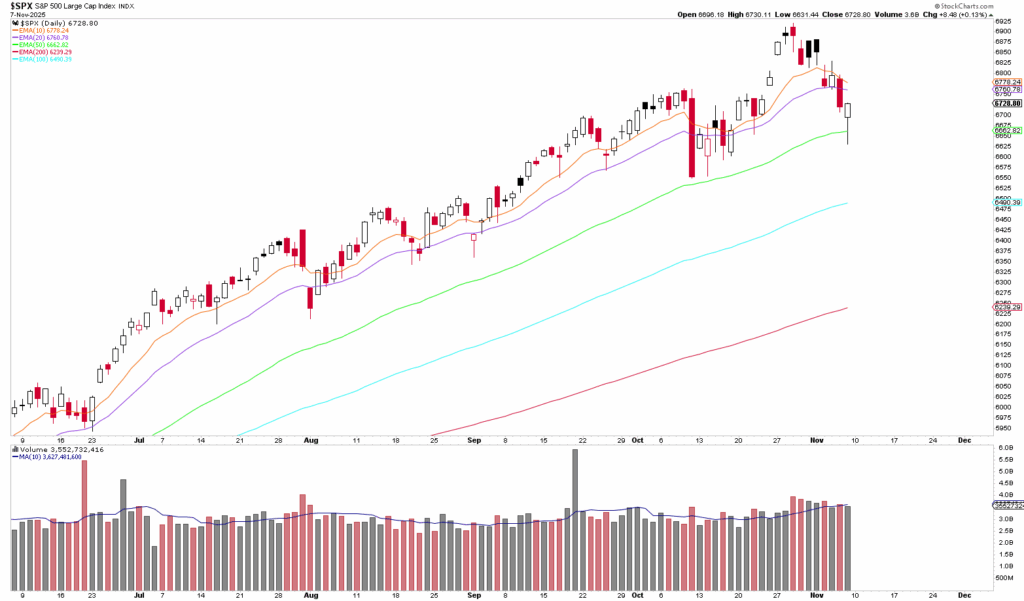
A candlestick chart shows the S&P 500 Index with moving averages and trading volume bars from July through November. The last candlestick shows a downward movement, which is saved as an automatically saved draft so that you can easily find it again.
S&P 500 daily chart

The VIX also formed a clear reversal signal on Friday. After rising to 22.72 points over the course of the day, the “fear barometer” closed the weekend at 19.08 points and below the psychologically important 20-point mark.
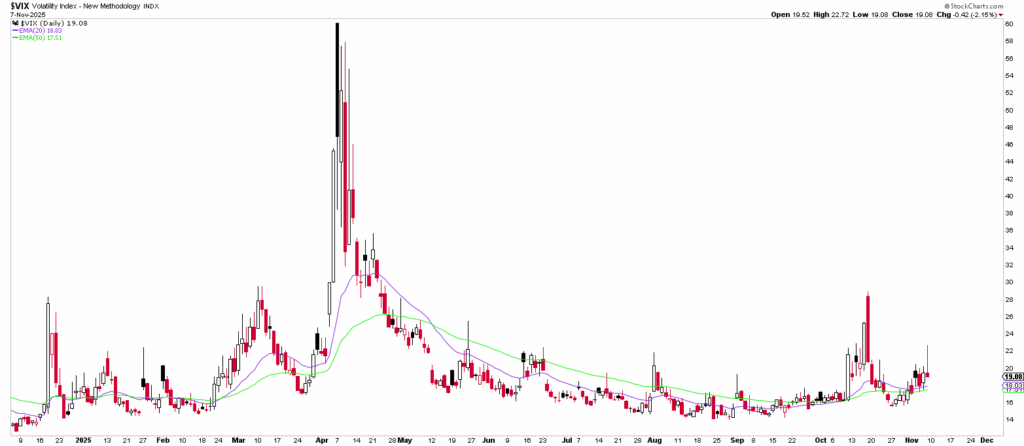
A candlestick chart of the VIX index for 2020, showing the volatility peaks in March and April, with overlaid moving averages - an automatically saved draft for market analysis.
VIX daily chart

Author: Tobias Schmid
Date: 10.11.2025

A man with slicked-back hair and a trimmed beard, wearing a navy blue suit jacket and a white shirt, looks into the camera with a slight smile. Industrial background.
Tobias Schmid

Tobias Schmid has been a trader and analyst since 2008 and specializes in trading futures options and equity options. His strategies and analysis methods are based on a combination of technical analysis, intermarket analysis and sentiment analysis. Tobias Schmid is also the founder of Fomo Financea financial website for active traders, investors and options traders.

Mandatory information and disclaimer

This is a marketing communication within the meaning of Section 63 (6) of the German Securities Trading Act and does not contain investment strategy recommendations, investment recommendations or financial analyses in accordance with Section 85 of the German Securities Trading Act and Article 20 of the Market Abuse Regulation. It therefore does not fulfill the legal requirements to guarantee the objectivity of investment strategy recommendations/investment recommendations/financial analyses. CapTrader GmbH or its employees are therefore not legally prohibited from trading or providing services in the securities products mentioned therein prior to publication of the information.

Past performance, simulations or forecasts are not a reliable indicator of future performance. Mandatory information and limitation of liability for CapTrader and any third-party content providers can be found at https://www.captrader.com/marketingmitteilung/angaben
Please note that investing in financial instruments involves high risks and take note of our disclaimer and the mandatory legal information at the locations indicated.

  1. Mandatory information

Responsible: CapTrader GmbH, Elberfelder Straße 2, 40213 Düsseldorf; Commercial Register Number: HRB 86537 Düsseldorf Local Court; VAT ID DE323771603; Managing Directors Andreas Weiß, Christian Weiß, Michael Heyder; Tel: +49 211-740786-00, Fax: +49 211-740786-90.

Zuständige Aufsichtsbehörde: Bundesanstalt für Finanzdienstleistungsaufsicht, Graurheindorfer Straße 108, D – 53117 Bonn und Marie-Curie-Str. 24-28 D – 60439 Frankfurt am Main, Tel: 0228 4108 – 0 Fax: 0228 4108 1550 E-Mail: poststelle@bafin.de; Institutsnummer 10156708

Conflicts of interest CapTrader in marketing communications: CapTrader GmbH confirms that it does not hold any positions in the mentioned financial instruments beyond the positions mentioned in the marketing communication itself, if applicable. There are also no other conflicts of interest within the meaning of CapTrader GmbH's Financial Analysis and Marketing Communication Policy.

Conflicts of interest and mandatory disclosures by the third-party content provider for marketing communications with financial instrument recommendations: See under https://www.captrader.com/marketingmitteilung/angaben  to creators of third-party content

The copyright to the marketing communication is reserved. Reprinting and distribution is only permitted with our consent.

  1. Disclaimer

By accepting the content, the recipient accepts the binding nature of the limitation of liability.

a) Disclaimer for third-party content

CapTrader GmbH offers authors - such as editors, guest commentators, agencies and companies - the opportunity to publish comments, analyses, news and company announcements. Their opinions do not necessarily reflect the opinions and views of CapTrader GmbH and its employees. CapTrader GmbH assumes neither liability nor guarantee for this content. This applies in particular to incomplete or incorrectly reproduced reports, incorrect price information and editorial errors. Liability claims relating to material or immaterial damage caused by the use or non-use of the published information or by the use of incorrect or incomplete information are fundamentally excluded.

b) Exclusion of liability for CapTrader's own content

CapTrader has taken its own information in this marketing communication from sources believed to be reliable, but has not verified all such information itself. Accordingly, CapTrader makes no warranties or representations as to the accuracy, completeness or correctness of the information or opinions contained herein. Subsequent changes cannot be taken into account. The marketing communication does not constitute an offer or solicitation to buy shares of the issuer and is in no way a substitute for advice appropriate to the investor and the property. We cannot verify whether the information in the marketing communication is in line with your personal investment strategies and objectives. We recommend that you consult an investment advisor for advice that is appropriate to the investor and the property. The marketing communication cannot and should not replace a securities prospectus and/or expert investment advice required for an investment. It can therefore never be the sole basis for an investment decision. By accepting the marketing communication, the recipient accepts the binding nature of the above limitation of liability.

CapTrader provides the information despite careful procurement and provision only without guarantee for the correctness / completeness, timeliness or accuracy and availability of the stock exchange and economic information, prices, rates, indices, general market data, valuations, assessments and other accessible content held and displayed for retrieval. This also applies to third-party content. Historical observations and forecasts are not a reliable indicator of future developments. The facts presented in particular in connection with product information are for illustrative purposes only and do not permit any statements to be made about future profits or losses. Any conditions stated are to be understood as non-binding indications and are dependent on market developments on the day of conclusion.

CapTrader accepts no liability for any direct or indirect damage caused by and/or related to the distribution and/or use of this marketing communication.

The information, opinions and statements correspond to the status at the time of preparation of the marketing communication. They may be outdated due to future developments without the publication being changed.

CapTrader is not obliged to update, amend or supplement the information in this marketing communication if a circumstance mentioned in this publication or a statement, estimate or forecast contained therein changes or becomes inaccurate. The presentation of the performance of financial instruments over previous periods does not provide a reliable indication of their future performance. No guarantee can therefore be given for the future price, value or income of any financial instrument mentioned in this publication.

Despite careful control of the content, we assume no liability for the content of external links. The operators of the linked pages are solely responsible for their content.

Distribution: This publication may only be distributed in accordance with the laws of the respective countries, and persons in possession of this publication should inform themselves about the applicable local regulations. The information contained herein is not intended for natural or legal persons who, due to their place of residence or business, are subject to a foreign legal system that imposes restrictions on the distribution of such information. The contents are therefore exclusively in German. In particular, this publication contains neither an offer nor an invitation to purchase securities to citizens of the USA, Great Britain and Australia.

Taxes: The tax treatment of financial instruments depends on the personal circumstances of the respective investor and may be subject to future changes, which may also have a retroactive effect.

Historical observations and forecasts are not a reliable indicator of future developments. The facts presented in particular in connection with product information are for illustrative purposes only and do not permit any statements to be made about future profits or losses. Any conditions stated are to be understood as non-binding indications and are dependent on market developments on the day of conclusion.

CapTrader accepts no liability for direct or indirect damage caused by and/or in connection with the distribution and/or use.

The information, opinions and statements correspond to the status at the time of preparation of the marketing communication. They may be outdated due to future developments without the publication being changed.

CapTrader is not obliged to update, amend or supplement the information if a circumstance mentioned in this publication or a statement, estimate or forecast contained therein changes or becomes inaccurate. The presentation of the performance of financial instruments over previous periods does not provide a reliable indication of their future performance. No guarantee can therefore be given for the future price, value or income of any financial instrument mentioned in this publication.

Despite careful control of the content, we assume no liability for the content of external links. The operators of the linked pages are solely responsible for their content.

Distribution: This publication may only be distributed in accordance with the laws of the respective countries, and persons in possession of this publication should inform themselves about the applicable local regulations. The information contained herein is not intended for natural or legal persons who, due to their place of residence or business, are subject to a foreign legal system that imposes restrictions on the distribution of such information. The contents are therefore exclusively in German. In particular, this publication contains neither an offer nor an invitation to purchase securities to citizens of the USA, Great Britain and Australia.

Taxes: The tax treatment of financial instruments depends on the personal circumstances of the respective investor and may be subject to future changes, which may also have a retroactive effect.

Email:

info@captrader.com

Send e-mail

Phone:

Hotline (Germany)
0800-8723370

Hotline (International)
00800-08723370

Further contact options