Your Broker for worldwide trading

Dow Jones tests 200-day line

A stock chart of the Dow Jones Industrial Average from the end of 2022 to the beginning of 2024 shows price declines and increased trading volume, with the 200-day line and the important support zone clearly highlighted.

Dear traders, dear stock market friends.

The Dow Jones Industrial Average continued its correction in the past trading week and closed weaker for the third week in a row. It was not only the war in the Middle East that caused nervousness to rise further; macroeconomic factors also provided an increasing headwind.

The most important macro factors behind the Dow's weakness

In addition to the ongoing uncertainty caused by the war in Iran, the Dow Jones had to contend with further negative news at the macro level last week. US growth was revised downwards, while core inflation remained at too high a level, dampening hopes of rapid interest rate cuts. At the same time, rising Treasury yields and a firmer US dollar exacerbated the pressure on equities.

GDP revision to 0.7 %: Growth loses momentum

One of the main negative factors at the end of the week was the significant downward revision of US GDP for the fourth quarter of 2025. Growth was lowered to an annualized 0.7 % in the second estimate, after 1.4 % had previously been reported. Compared to the previous quarter with growth of 4.4 %, this is a clear indication that economic momentum had already slowed noticeably before the recent oil price shock. 

This is particularly relevant for the Dow Jones because the index is more heavily influenced by traditional economic and value sectors than other major US indices. When growth cools, industrial, financial and cyclical consumer stocks come under pressure more quickly. This is exactly what we saw last week: The market began to react not only to geopolitical headlines, but also to price in a weaker underlying economic trend at the same time. 

In addition, the GDP data cannot be viewed in isolation. The downward revision signals that the US economy is more vulnerable going into this new phase of higher energy prices than many market participants had expected just a few weeks ago. If there is no rapid de-escalation in the coming weeks, there is a serious risk that the geopolitical crisis could quickly become a macroeconomic problem for the stock market.

Core PCE remains high: Why the inflation problem has not been solved

Parallel to the weaker growth momentum, the inflation side did not provide any relief either. The PCE price index, which is particularly important for the Fed, rose by 0.3 % in January compared to the previous month, while the core rate excluding energy and food rose by 0.4 %. For the year as a whole, the overall PCE was 2.8 %, but the core PCE was 3.1 %. This means that core inflation in particular remained clearly too high to justify a rapid easing of monetary policy.

The problem at the moment is less the absolute increase than the timing. This is because the inflation figures hardly reflect the recent rise in oil and energy prices. In other words, the market was presented with a combination of already weak growth and still too high core inflation at the end of the week, even before the latest developments in energy prices were fully reflected in the data. It is precisely from this that the concern can be derived that inflationary pressure is more likely to increase again in the coming months than subside. 

This was negative for the Dow because such an environment limits the Fed's room for maneuver. In a classic risk-on scenario, weaker growth data could trigger fantasies of interest rate cuts. However, this mechanism is not currently working because the market is also worried that higher energy prices could fuel the inflation process again.

Rising Treasury yields and less interest rate cut fantasy weigh on equities

This correlation was also evident on the bond market. Over the course of the week, US yields rose significantly as market expectations of possible interest rate cuts were dampened. On Wednesday, the yield on the 10-year US government bond jumped by 9 basis points to 4.226 %, and by the end of the week it stood at around 4.28 %. At the same time, the US dollar rose significantly as a safe haven over the course of the week. 

Rising yields are problematic for the equity market for two reasons: firstly, they increase the discounting pressure on valuations. Secondly, they exacerbate financial conditions at a time when the economy is losing momentum anyway. In the case of the Dow, a higher interest rate level may help individual financial stocks in the short term, but a stagflationary environment weighs on credit quality, the propensity to invest and earnings momentum overall. As a result, major bank stocks in particular came under noticeable pressure at times during the week.

Oil price, VIX and headline risk

The rising oil price was again one of the most important factors on the market last week. On Monday, WTI shot up to around USD 119 intraday, while the VIX rose to 35.3 points at the same time. Although both initially fell back significantly, this was not enough to take the nervousness out of the market in the long term. On the contrary: the extreme volatility at the start of the week already showed how sensitively the entire market environment reacted to new reports from the Middle East. 

This impression was confirmed as the day progressed. Oil prices rose sharply again on Wednesday, and on Thursday attacks on tankers and fears of a continued closure of the Strait of Hormuz triggered the next wave of selling.

A sharp rise in oil prices acts like an additional tax on the global economy: transportation, production and consumption become more expensive, while at the same time inflation concerns increase. For equities, this means falling margins, more uncertain demand prospects and less monetary policy leeway. As a result, the rise in oil prices has not only become an issue for the energy sector, but a broadly based negative factor for the market as a whole. 

In order to be able to outline a bullish scenario for the coming weeks, an easing on the geopolitical side, including a significant decline in oil prices, is therefore an essential prerequisite.

Technical outlook for the Dow Jones Index

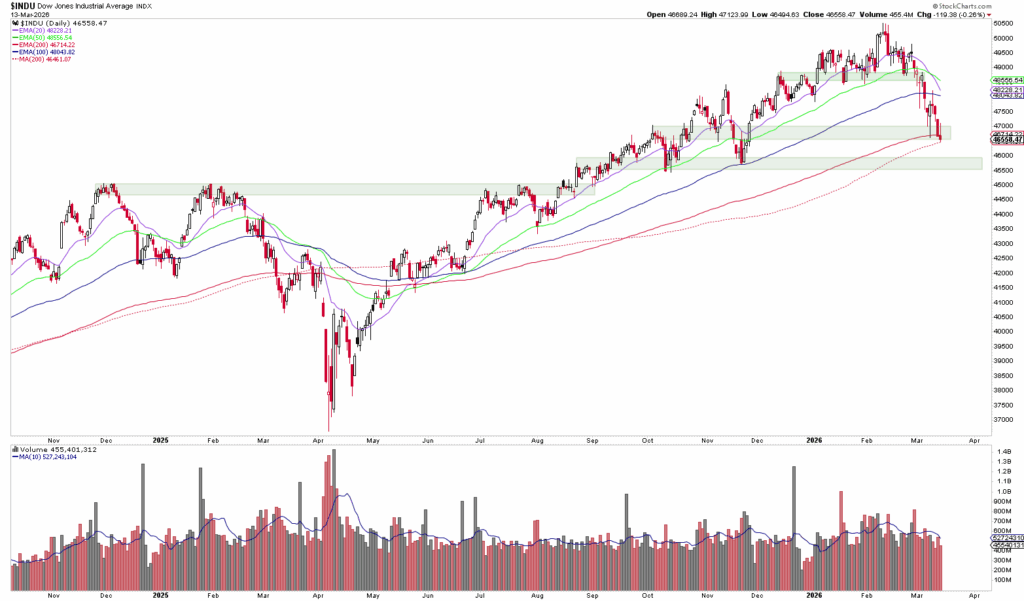
After last week's downward movement, the Dow Jones is now trading around eight percent below its all-time high, which was reached at the beginning of February. At the start of the new week, the current price range between 46,500 and 46,700 points is the main focus. This is exactly where the daily EMA 200 and the daily SMA 200 are located (see red lines in the chart).
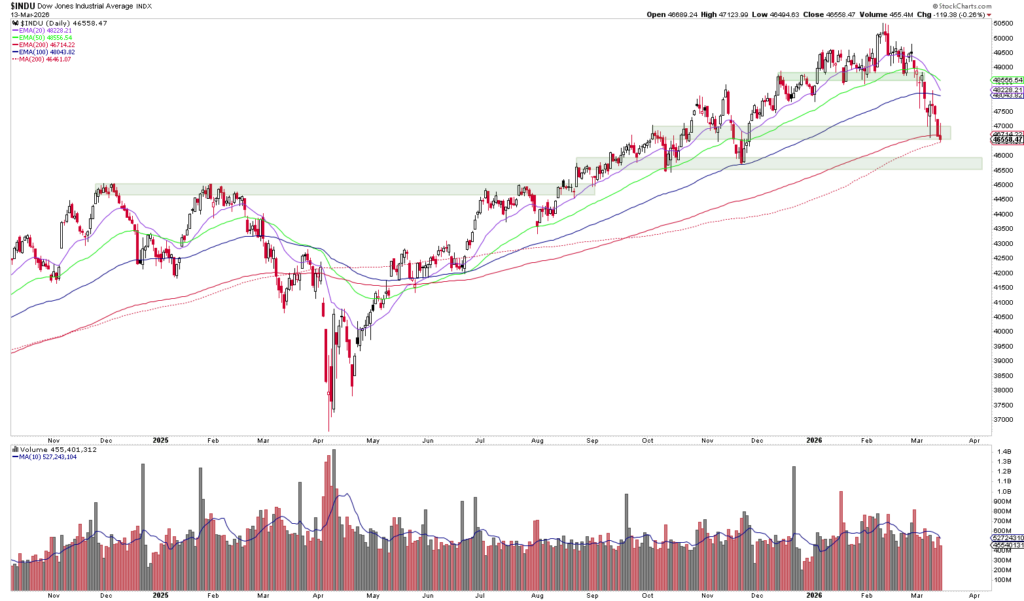
The line chart shows the Dow Jones Industrial Average from the end of 2022 to the beginning of 2024, with trading volume bars and multiple moving averages superimposed, all part of an automatically saved market analysis blueprint.
Dow Jones Index daily chart

If the 200-day line can be defended, there is still a chance of a recovery. But even if it breaks downwards, there are still some support zones waiting, as can be seen on the weekly chart. Instead of blindly plunging into a falling knife, restraint does not seem to be a wrong strategy in the current situation. If there are clear reversal signals at one of the support zones and a trend reversal at smaller trend sizes, there should still be enough time in the coming weeks to reposition.
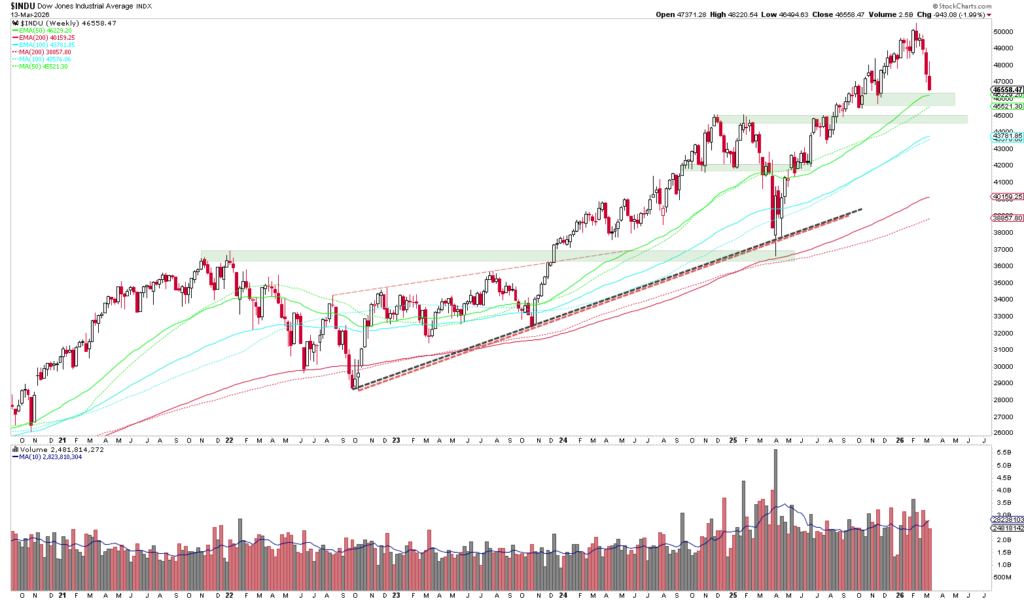
Line chart of the Dow Jones Industrial Average from 2015 to 2024, with price movements, support/resistance zones, moving averages and volume bars below. Automatically saved draft integrated for quick analysis.
Dow Jones weekly chart

Author: Tobias Schmid
Date: 16.03.2026

A man with slicked-back hair and a trimmed beard, wearing a navy blue suit jacket and a white shirt, looks into the camera with a slight smile. Industrial background.
Tobias Schmid

Tobias Schmid has been a trader and analyst since 2008 and specializes in trading futures options and equity options. His strategies and analysis methods are based on a combination of technical analysis, intermarket analysis and sentiment analysis. Tobias Schmid is also the founder of Fomo Financea financial website for active traders, investors and options traders.

Mandatory information and disclaimer

This is a marketing communication within the meaning of Section 63 (6) of the German Securities Trading Act and does not contain investment strategy recommendations, investment recommendations or financial analyses in accordance with Section 85 of the German Securities Trading Act and Article 20 of the Market Abuse Regulation. It therefore does not fulfill the legal requirements to guarantee the objectivity of investment strategy recommendations/investment recommendations/financial analyses. CapTrader GmbH or its employees are therefore not legally prohibited from trading or providing services in the securities products mentioned therein prior to publication of the information.

Past performance, simulations or forecasts are not a reliable indicator of future performance. Mandatory information and limitation of liability for CapTrader and any third-party content providers can be found at https://www.captrader.com/marketingmitteilung/angaben
Please note that investing in financial instruments involves high risks and take note of our disclaimer and the mandatory legal information at the locations indicated.

  1. Mandatory information

Responsible: CapTrader GmbH, Elberfelder Straße 2, 40213 Düsseldorf; Commercial Register Number: HRB 86537 Düsseldorf Local Court; VAT ID DE323771603; Managing Directors Andreas Weiß, Christian Weiß, Michael Heyder; Tel: +49 211-740786-00, Fax: +49 211-740786-90.

Zuständige Aufsichtsbehörde: Bundesanstalt für Finanzdienstleistungsaufsicht, Graurheindorfer Straße 108, D – 53117 Bonn und Marie-Curie-Str. 24-28 D – 60439 Frankfurt am Main, Tel: 0228 4108 – 0 Fax: 0228 4108 1550 E-Mail: poststelle@bafin.de; Institutsnummer 10156708

Conflicts of interest CapTrader in marketing communications: CapTrader GmbH confirms that it does not hold any positions in the mentioned financial instruments beyond the positions mentioned in the marketing communication itself, if applicable. There are also no other conflicts of interest within the meaning of CapTrader GmbH's Financial Analysis and Marketing Communication Policy.

Conflicts of interest and mandatory disclosures by the third-party content provider for marketing communications with financial instrument recommendations: See under https://www.captrader.com/marketingmitteilung/angaben  to creators of third-party content

The copyright to the marketing communication is reserved. Reprinting and distribution is only permitted with our consent.

  1. Disclaimer

By accepting the content, the recipient accepts the binding nature of the limitation of liability.

a) Disclaimer for third-party content

CapTrader GmbH offers authors - such as editors, guest commentators, agencies and companies - the opportunity to publish comments, analyses, news and company announcements. Their opinions do not necessarily reflect the opinions and views of CapTrader GmbH and its employees. CapTrader GmbH assumes neither liability nor guarantee for this content. This applies in particular to incomplete or incorrectly reproduced reports, incorrect price information and editorial errors. Liability claims relating to material or immaterial damage caused by the use or non-use of the published information or by the use of incorrect or incomplete information are fundamentally excluded.

b) Exclusion of liability for CapTrader's own content

CapTrader has taken its own information in this marketing communication from sources believed to be reliable, but has not verified all such information itself. Accordingly, CapTrader makes no warranties or representations as to the accuracy, completeness or correctness of the information or opinions contained herein. Subsequent changes cannot be taken into account. The marketing communication does not constitute an offer or solicitation to buy shares of the issuer and is in no way a substitute for advice appropriate to the investor and the property. We cannot verify whether the information in the marketing communication is in line with your personal investment strategies and objectives. We recommend that you consult an investment advisor for advice that is appropriate to the investor and the property. The marketing communication cannot and should not replace a securities prospectus and/or expert investment advice required for an investment. It can therefore never be the sole basis for an investment decision. By accepting the marketing communication, the recipient accepts the binding nature of the above limitation of liability.

CapTrader provides the information despite careful procurement and provision only without guarantee for the correctness / completeness, timeliness or accuracy and availability of the stock exchange and economic information, prices, rates, indices, general market data, valuations, assessments and other accessible content held and displayed for retrieval. This also applies to third-party content. Historical observations and forecasts are not a reliable indicator of future developments. The facts presented in particular in connection with product information are for illustrative purposes only and do not permit any statements to be made about future profits or losses. Any conditions stated are to be understood as non-binding indications and are dependent on market developments on the day of conclusion.

CapTrader accepts no liability for any direct or indirect damage caused by and/or related to the distribution and/or use of this marketing communication.

The information, opinions and statements correspond to the status at the time of preparation of the marketing communication. They may be outdated due to future developments without the publication being changed.

CapTrader is not obliged to update, amend or supplement the information in this marketing communication if a circumstance mentioned in this publication or a statement, estimate or forecast contained therein changes or becomes inaccurate. The presentation of the performance of financial instruments over previous periods does not provide a reliable indication of their future performance. No guarantee can therefore be given for the future price, value or income of any financial instrument mentioned in this publication.

Despite careful control of the content, we assume no liability for the content of external links. The operators of the linked pages are solely responsible for their content.

Distribution: This publication may only be distributed in accordance with the laws of the respective countries, and persons in possession of this publication should inform themselves about the applicable local regulations. The information contained herein is not intended for natural or legal persons who, due to their place of residence or business, are subject to a foreign legal system that imposes restrictions on the distribution of such information. The contents are therefore exclusively in German. In particular, this publication contains neither an offer nor an invitation to purchase securities to citizens of the USA, Great Britain and Australia.

Taxes: The tax treatment of financial instruments depends on the personal circumstances of the respective investor and may be subject to future changes, which may also have a retroactive effect.

Historical observations and forecasts are not a reliable indicator of future developments. The facts presented in particular in connection with product information are for illustrative purposes only and do not permit any statements to be made about future profits or losses. Any conditions stated are to be understood as non-binding indications and are dependent on market developments on the day of conclusion.

CapTrader accepts no liability for direct or indirect damage caused by and/or in connection with the distribution and/or use.

The information, opinions and statements correspond to the status at the time of preparation of the marketing communication. They may be outdated due to future developments without the publication being changed.

CapTrader is not obliged to update, amend or supplement the information if a circumstance mentioned in this publication or a statement, estimate or forecast contained therein changes or becomes inaccurate. The presentation of the performance of financial instruments over previous periods does not provide a reliable indication of their future performance. No guarantee can therefore be given for the future price, value or income of any financial instrument mentioned in this publication.

Despite careful control of the content, we assume no liability for the content of external links. The operators of the linked pages are solely responsible for their content.

Distribution: This publication may only be distributed in accordance with the laws of the respective countries, and persons in possession of this publication should inform themselves about the applicable local regulations. The information contained herein is not intended for natural or legal persons who, due to their place of residence or business, are subject to a foreign legal system that imposes restrictions on the distribution of such information. The contents are therefore exclusively in German. In particular, this publication contains neither an offer nor an invitation to purchase securities to citizens of the USA, Great Britain and Australia.

Taxes: The tax treatment of financial instruments depends on the personal circumstances of the respective investor and may be subject to future changes, which may also have a retroactive effect.

Email:

info@captrader.com

Send e-mail

Phone:

Hotline (Germany)
0800-8723370

Hotline (International)
00800-08723370

Further contact options