The Cboe VVIX Index (short: VVIX) is another volatility index besides the VIX, which is observed by numerous traders. As the name suggests, it is the volatility of the VIX index. Stockbrokers also speak of the "volatility of volatility" or the "VIX of the VIX"
What exactly this means, how the VVIX is calculated and what significance the index has for the analysis of the stock markets, you will find out below.
What is the VVIX?
The Cboe VVIX index measures the Short-term fluctuation range (implied volatility) of the VIX index expected by the market (or a hypothetical VIX future with a maturity of 30 days). Analysts like to use the VVIX to draw early conclusions about a change in volatility and thus also about the development of the stock markets.
Calculation of the VVIX
The same method is used to calculate the VVIX as is used to calculate the VIX. (Hence the name "VIX of the VIX"). The difference is that it is not options on the S&P 500 that are used for the calculation, but Options on the VIX (Out Of The Money and At The Money options).
Just like the VIX, the VVIX is published every 15 seconds by the Cboe.
Analysis of the VVIX
In order to understand and interpret the VVIX, it is first necessary to have a basic understanding of the VIX and its typical behavior.
The VIX rises when there are price declines on the stock markets and there is an increased need for hedging among investors. Since the VIX usually assumes low values and shows a small fluctuation range during a bull market or during an upward movement of the S&P 500 and rises sharply in the event of strong and rapid downward movements, the following Conclusions on the VVIX draw:
- The VVIX falls when the S&P 500 rises.
- The VVIX rises when the S&P 500 falls.
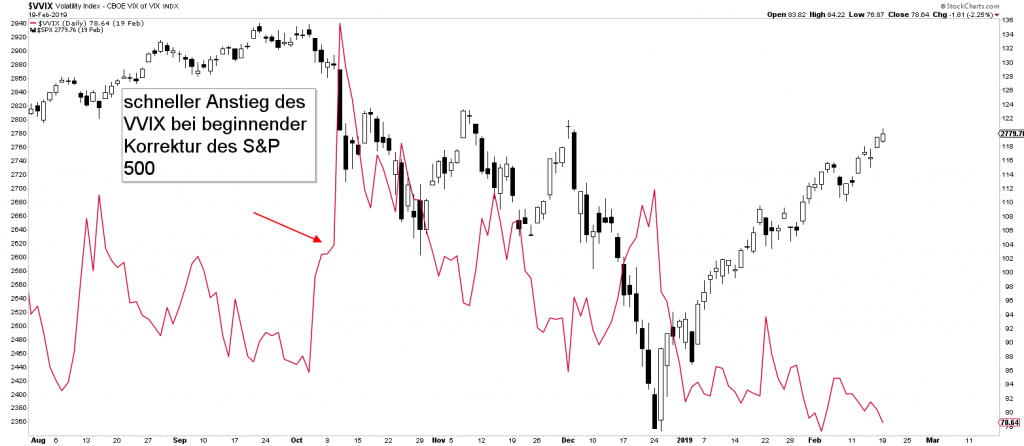
Behavior of the VVIX at turning points
The added value of analyzing volatility indices such as the VIX and VVIX becomes clear when their price movements are not viewed in isolation, but rather analyzed in connection with the movements of the S&P 500 and pays particular attention to divergences.
Rising volatility (increase in the VIX) or increased volatility of volatility (increase in the VVIX) with simultaneously upward or sideways moving stock markets, can be interpreted as an early warning signal of a turning point in the S&P 500.
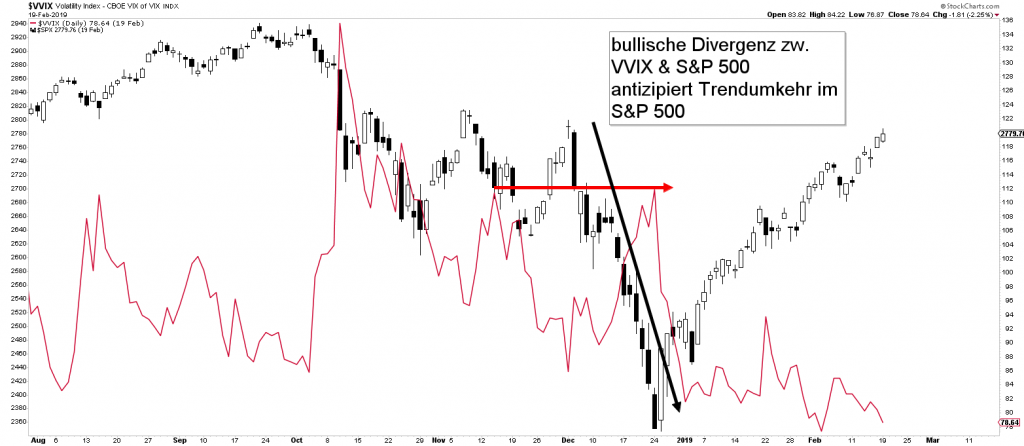
If there are stronger downward movements in the S&P 500 and the VVIX has risen sharply, a closer analysis can be valuable by looking for a bullish divergence which can be interpreted as a bullish signal for the stock markets.