
Dear traders, dear stock market friends,
After five months of price gains, August was the first month with a moderate correction in the S&P 500. Measured from the local low on March 13 to the local high on July 31 (on a closing price basis), the previous price rally led to a rise in the index of 733 points or 16%. A subsequent correction or consolidation phase is therefore not only nothing unusual, but also "healthy" in terms of a possible continuation of the upward trend.
Trend analysis
The chart-based upward trend of the S&P 500 remains intact, as can be seen from the fact that the sequence of higher highs and higher lows is unbroken.
The moving averages also signal an upward trend. The index is trading above the upward EMA 200 (red). The EMA 20 (purple) and the EMA 50 (green) are also above the 200 EMA.
Even if the correction continues, the overall picture will not change for the time being. The situation will become critical if the EMA 200 (thick red line) and SMA 200 (thin red line) are breached on the downside.
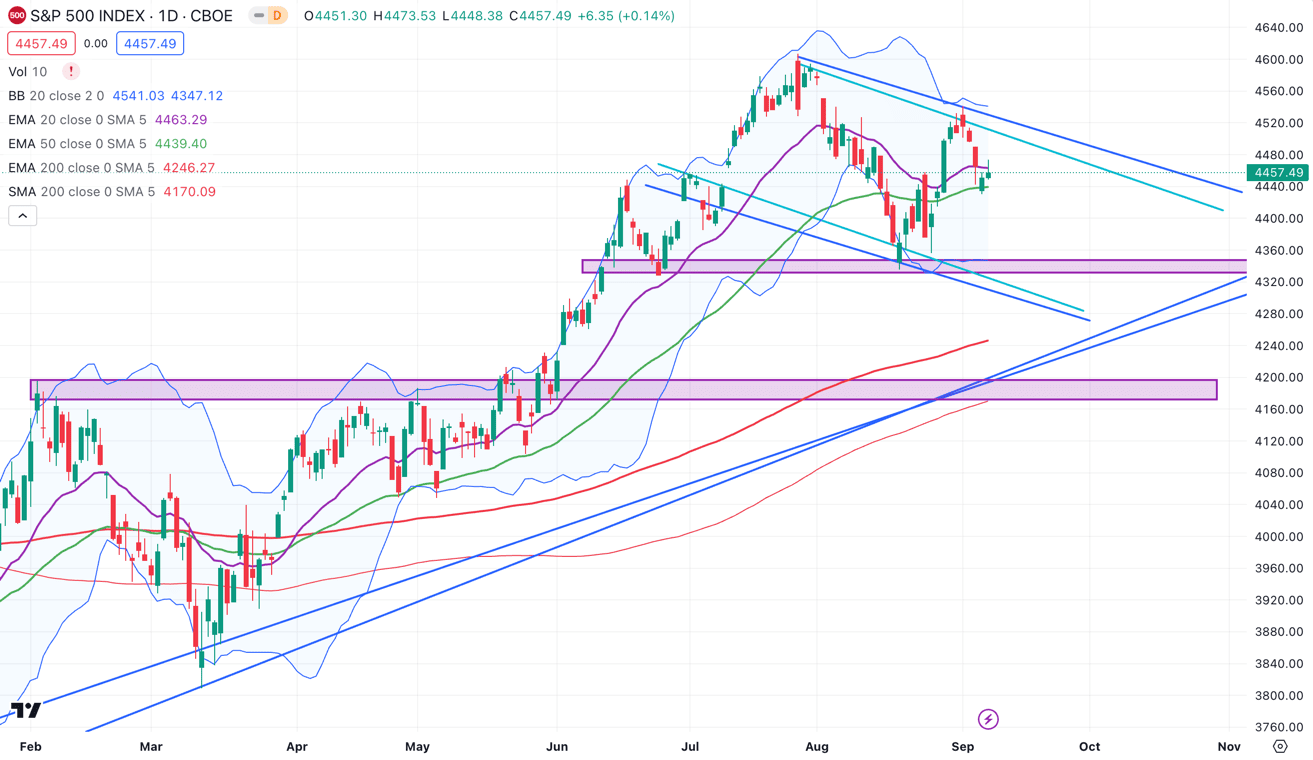 S&P 500 daily chart
The weakest month of the year
Against the backdrop of seasonality, it is hardly surprising that we see weaker share indices in August and September. In terms of the number of months with a rise or fall in share prices, September is the weakest month of the year. In the last 50 years, the S&P 500 has risen in September only 42 % of the time. October through December, on the other hand, are some of the seasonally strongest months. (October = 60 % positive, November = 70 % positive, December = 72 % positive)
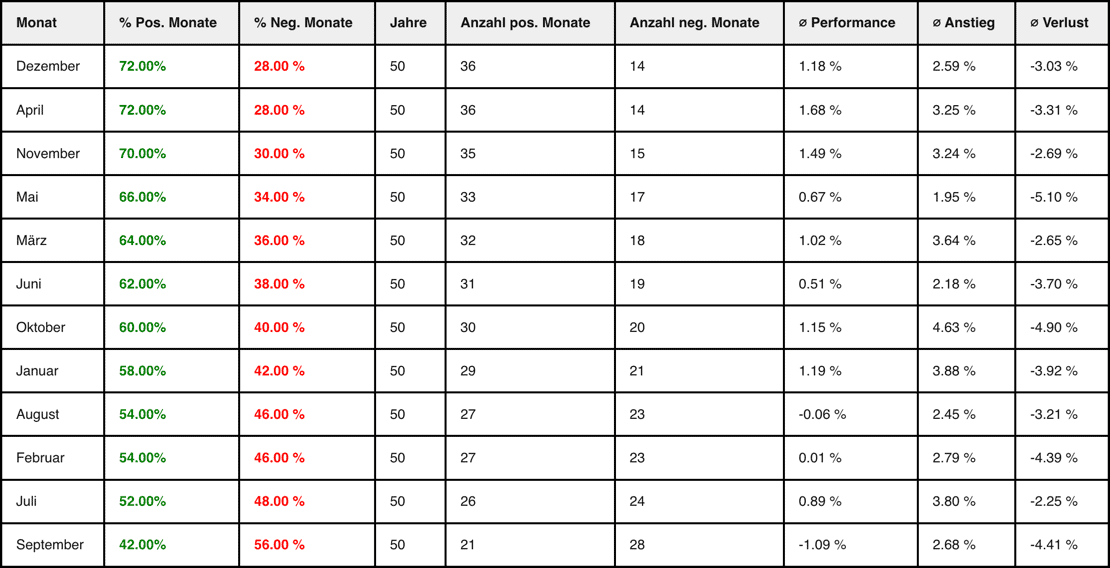
Source: https://www.fomo-finance.com/statistik-sp500/
A look at the seasonal trend illustrates the weakness in the summer months, followed by the end-of-year rally that began in October.

Source: own calculation & visualization
If the correction continues until the end of September, this would present an interesting entry opportunity.
Intermarket analysis and market breadth
In order to get as complete a picture as possible, we should not just look at a single index, but also observe the most important US indices in particular and look for possible divergences.
Advance Decline Line
In addition to the share indices, there are some broad market indicators that provide information on whether the price performance of an individual index is also supported by the mass of all shares (the so-called broad market) or whether the index is possibly only moved by a few heavyweights with a high index weighting.
One of the best-known market breadth indicators is the Advance Decline Line. In simple terms, this measures whether more shares are currently rising or falling. Signals from the AD Line often have a very high hit rate. The AD Line currently confirms the prevailing upward trend. A very reliable signal is often generated when the AD Line breaks out to a new high or below a local low while the index has not yet done so. If the AD line breaks out upwards or downwards in the next few days or weeks, there is a high probability that the index will also follow.
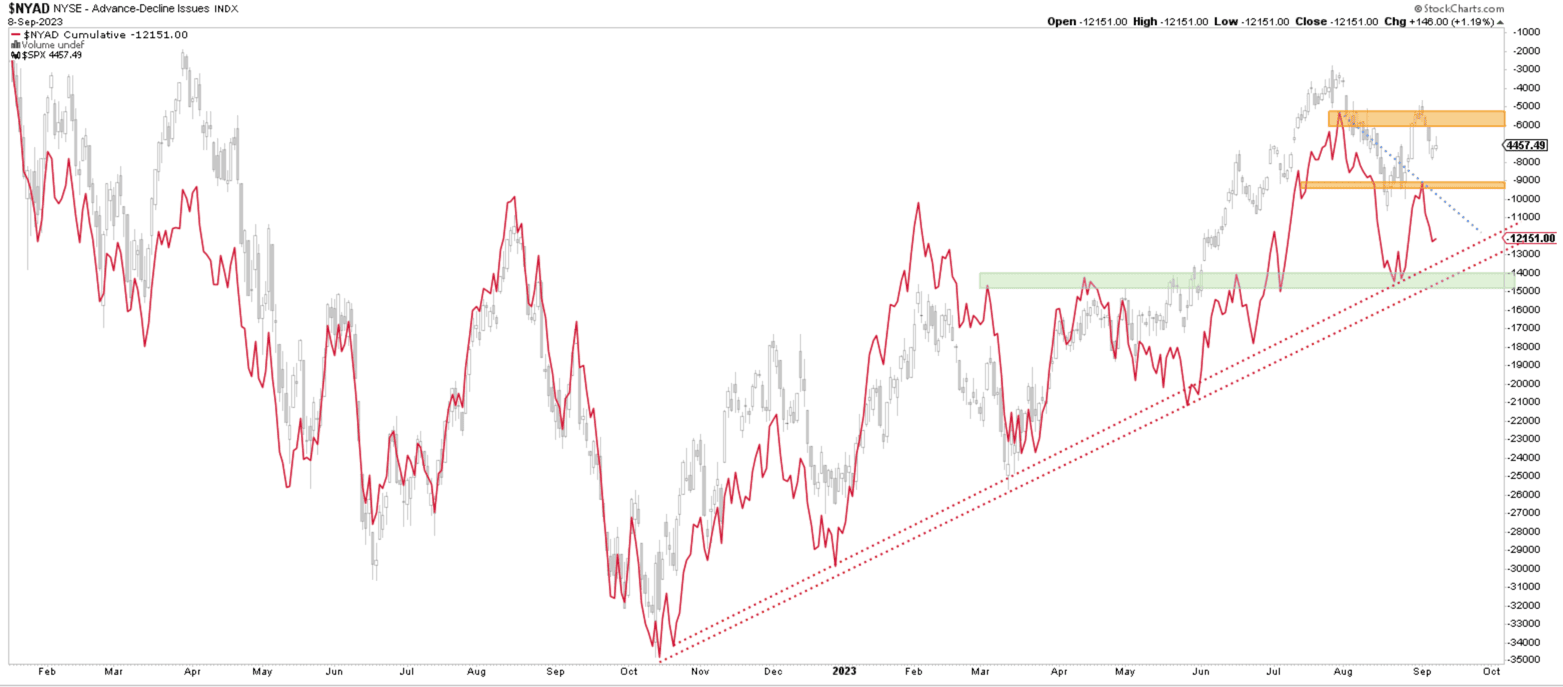
Advance Decline Line (red), S&P 500 (gray)
New Highs vs New Lows
A bull market is characterized by the fact that more shares generate new highs than new lows. It therefore makes sense to analyze the New Highs vs New Lows of the New York Stock Exchange.
We can see that many shares have generated new 52-week highs in recent months, which is or was a confirming signal for the upward trend. Currently, however, the picture has already clouded over and more stocks have recently made new lows than new highs. In view of the seasonal weakness and the fact that the overriding trends are still intact, further developments should be monitored but not overweighted at the moment.
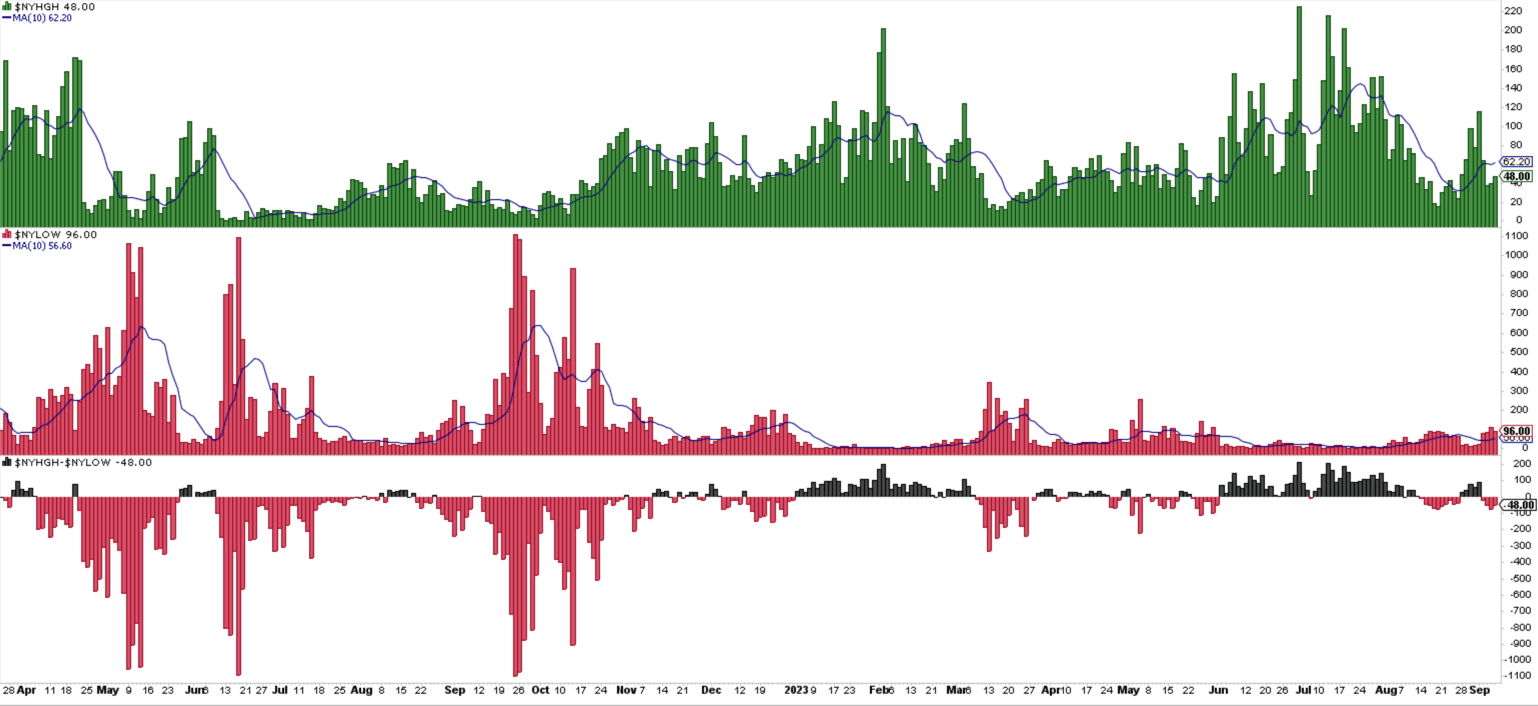
52-week highs (green), 52-week lows (red), net new highs (red/black)
Sector analysis
The S&P 500 consists of eleven market sectors, which can be divided into offensive and defensive categories. When the primary trend reverses, we almost always see a sector rotation from offensive to defensive (top formation) or from defensive to offensive (bottom formation) even before the index completes the trend reversal.
An observation period of three months or 60 trading days has proven to be reliable in the past. We now measure the relative strength of the individual market sectors by dividing the respective sector by the index (S&P 500). This allows us to answer the question of which sectors are currently outperforming the S&P 500 and which sectors are showing relative weakness.
The following chart shows the relative performance of the eleven market sectors to the S&P 500. It can be seen that the offensive sectors (XLY = Consumer Discretionary, XLC = Communication Services, XLK = Technology, XLF = Financials, XLI = Industrials) show a similar overall performance to the S&P 500. The defensive sectors (XLU = Utilities, XLP = Consumer Staples, XLV = Healthcare) show relative weakness. (The remaining sectors have been excluded from this chart.) The analysis of the sector rotation therefore currently favors the bull case. Although the offensive sectors are not clearly outperforming, they are developing positively together with the S&P 500, while the defensive sectors are showing relative weakness. For the upward trend in the S&P 500 to continue, however, it is necessary for the offensive sectors to also break out bullishly again.
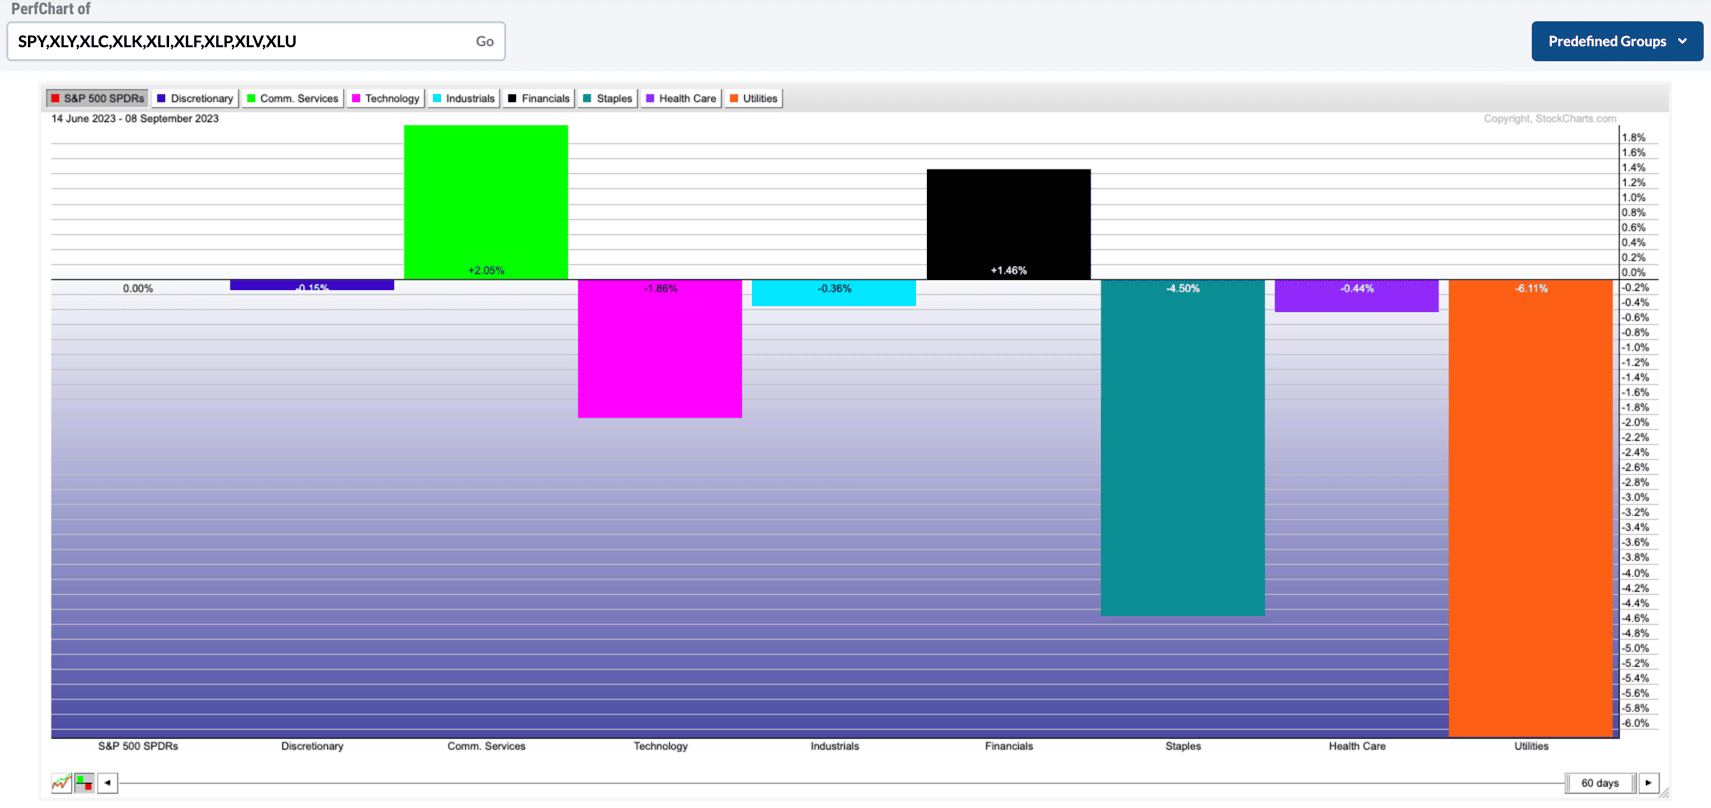
Source: https://stockcharts.com/freecharts/perf.php?[SECT]
Conclusion
The S&P 500 is in the correction phase of an intact uptrend. Long opportunities arise when the index shows a price reaction at a support area. In addition to directional long trades, options strategies such as put credit spreads, cash-secured puts, (skewed) iron condors and others can be used here. The bullish scenario is currently supported by the analysis of the market sectors of the S&P 500. September is a seasonally very weak month and we are also seeing some warning signals from the intermarket and market breadth analysis. However, a short scenario will only open up if the most important US indices break through their support areas on a bearish note. In the S&P 500, the EMA and SMA 200 can be seen as the bulls' last line of defense.
Author: Tobias Schmid
Date: 11.09.23