Dear trader, dear stock market friends.
In the past trading week, we saw price movements in both directions in the S&P 500. On balance, the index closed the week slightly down, but there was still no major correction. Recently, the market has focused primarily on inflation and economic data as well as the publication of quarterly results during the reporting season. With Nvidia, Home Depot and Walmart, there are still some interesting earnings dates coming up this week; overall, however, the earnings season is drawing to a close. The US stock markets will be closed today, Monday, due to a public holiday.
Hot inflation data
After the S&P 500 started the trading week with little movement on Monday last week, a correction to the daily EMA 20 followed on Tuesday. This was triggered by the published inflation data, which turned out to be hotter than the market had expected. At 3.1 % (annualized or YOY), the consumer prices reported for January were lower than the December figure of 3.4 %; however, the market's expectation was 2.9 %, which is why both the stock market and bond prices reacted with price losses. If inflation does not continue to fall or rise surprisingly sharply, this will limit the Fed's scope for interest rate cuts in the current year, which is why market participants are currently keeping a close eye on inflation data and the stock market is reacting sensitively to it.
In the second half of the week, however, the S&P 500 was already able to recoup its losses and rose to around 5050 points. Producer prices, which are another important inflation indicator and were published on Friday, also exceeded the market's expectations on both a monthly and annual basis and once again put a small damper on the stock market. Overall, however, many market participants still seem to be waiting for a major correction, which is possibly also the reason why this has not yet come and the market continues to rise in small steps.
Interest rate cut postponed
Just a few weeks ago, the market consensus was that the Fed would cut interest rates for the first time in March. However, due to strong economic data and the somewhat hotter inflation data, March is very likely off the table. Most market participants are now assuming that the first interest rate cut will take place in June. It should be noted that the stock market is currently showing enormous strength and can continue its upward trend despite the high level of interest rates and the (as yet) lack of interest rate cuts.
Support at 4800 and 4600 points
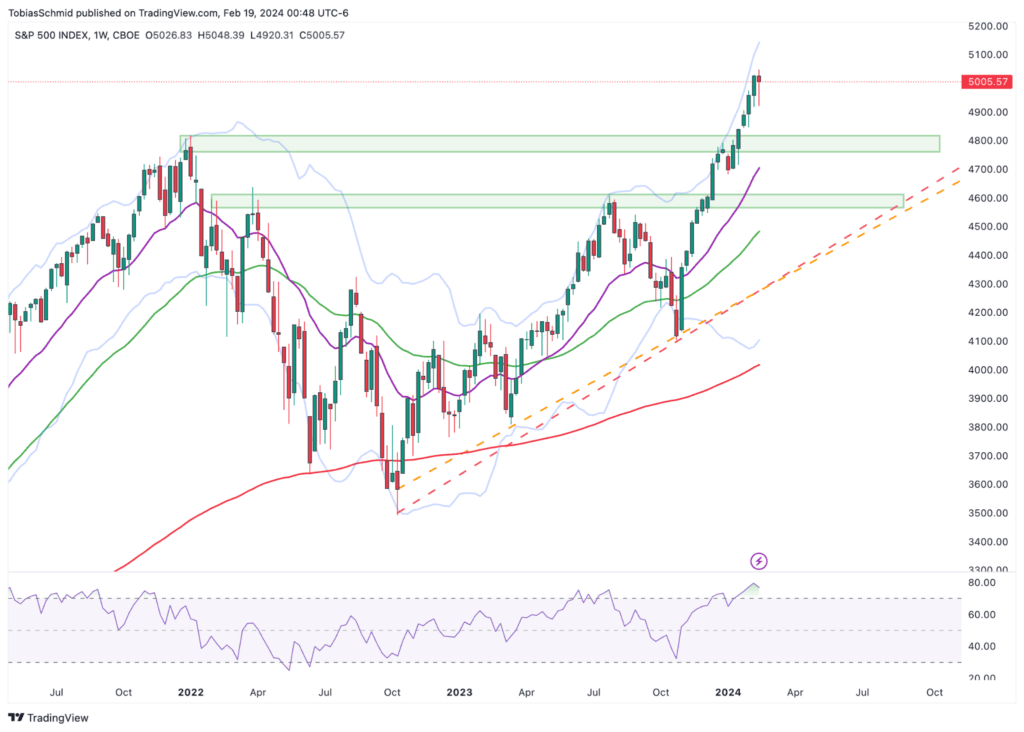
On the chart, the S&P 500 remains in the overbought zone and there has been no real correction so far. Should this occur in the coming weeks, there will be renewed opportunities to enter the market at the technical support zones.
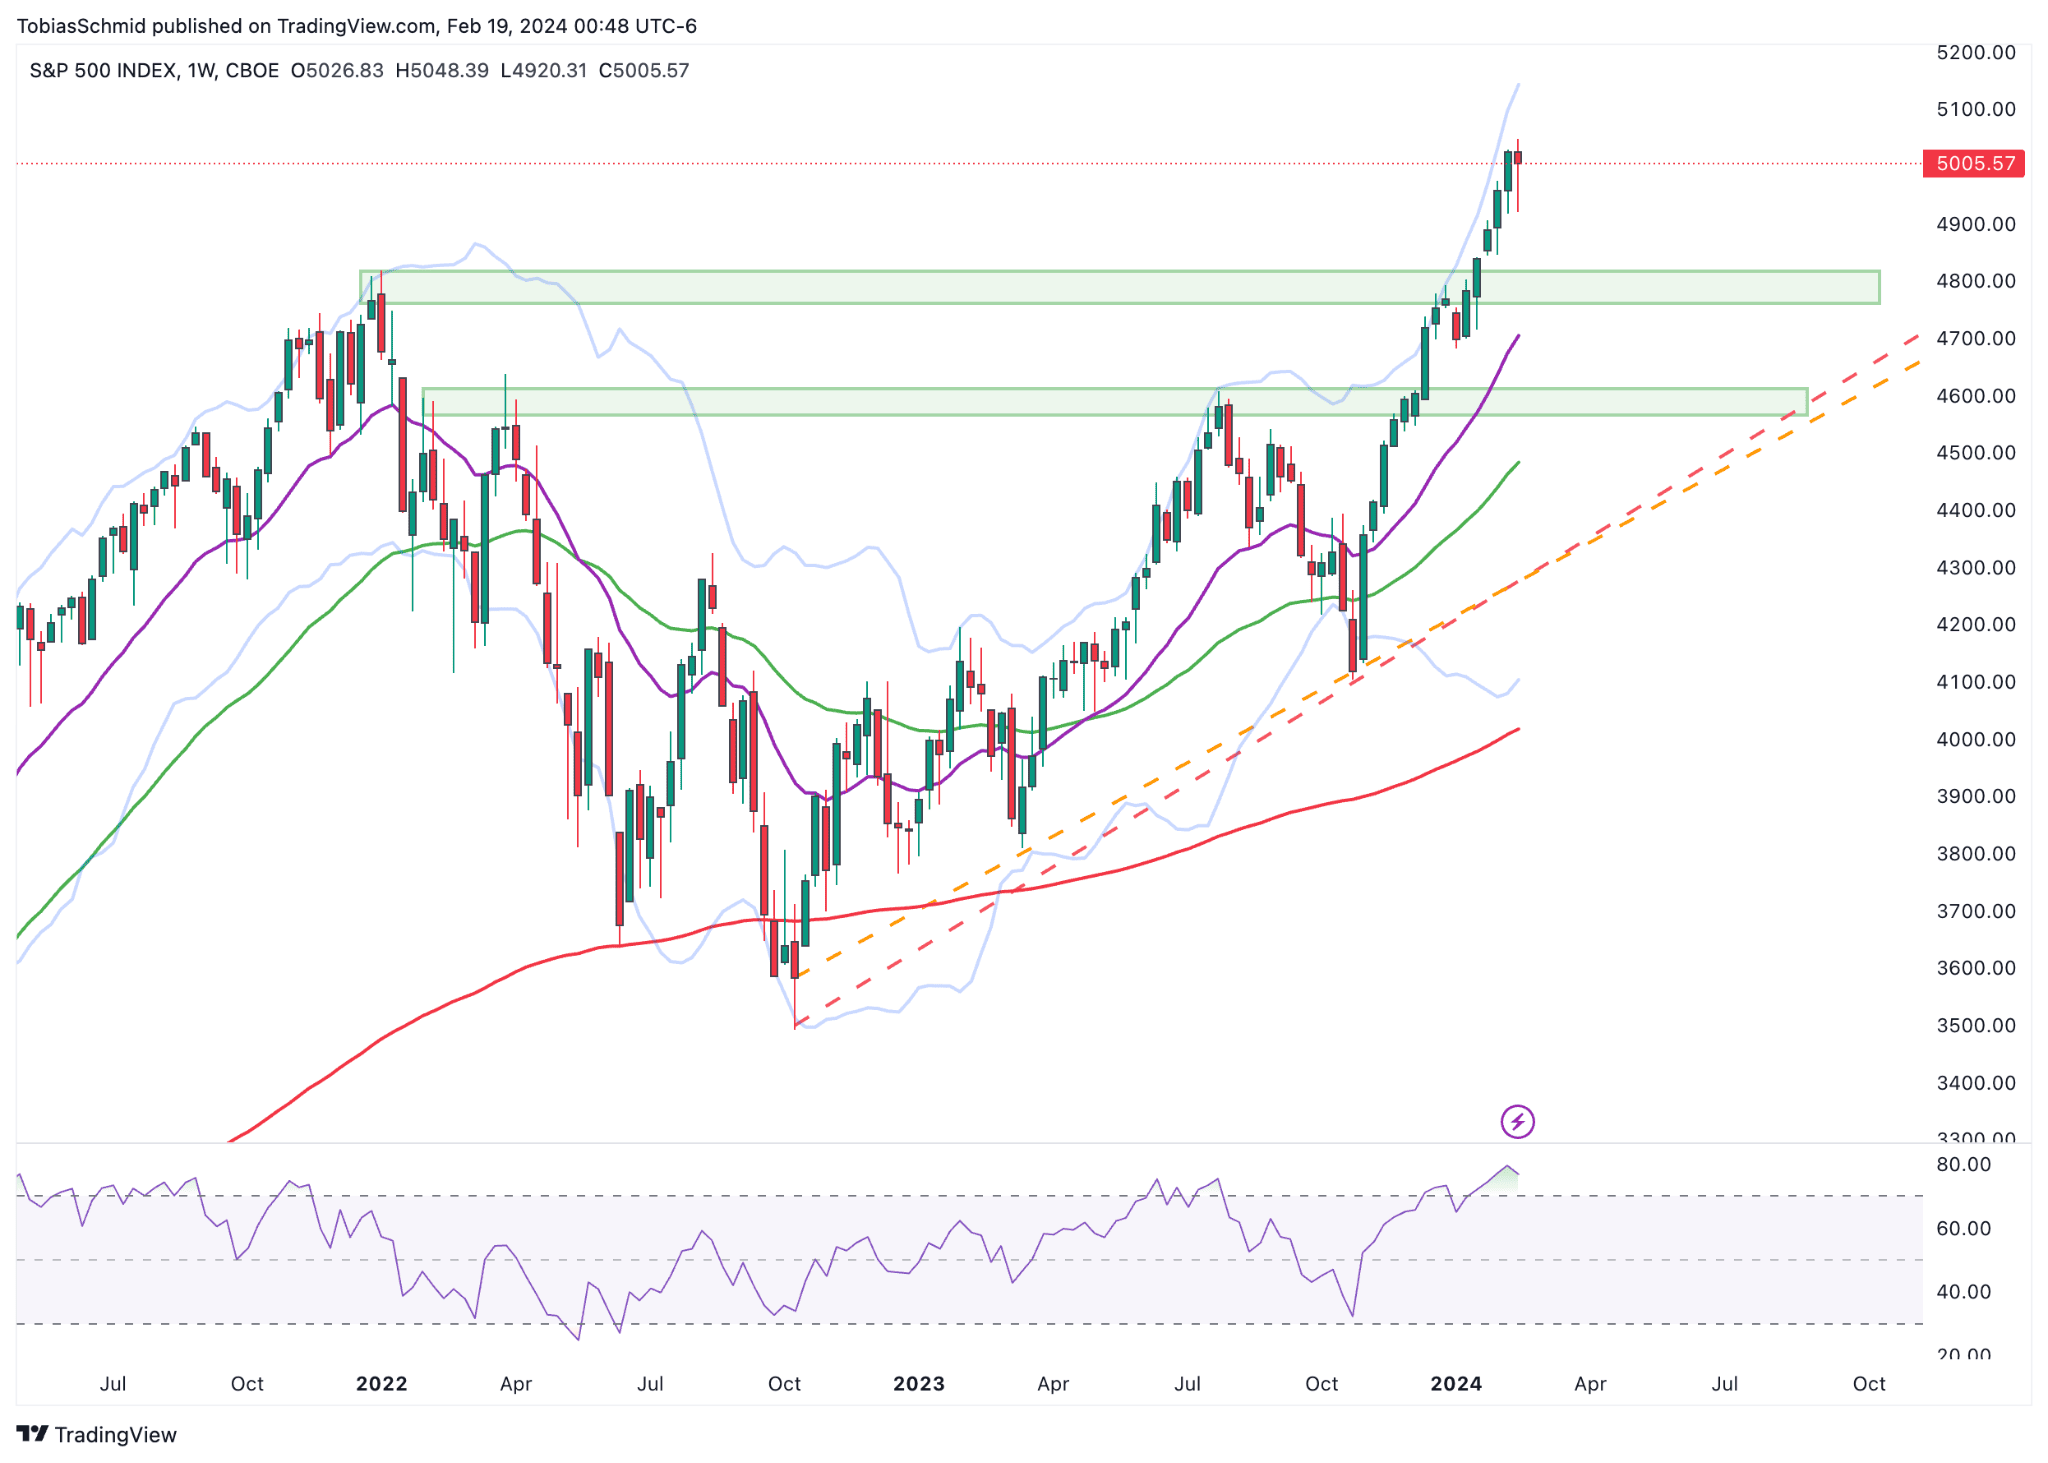
S&P 500 Index weekly chart with support zones at 4800 and 4600 points
The first technical support level is around 4800 points. This is where the old all-time highs from January 2022 are located and - as can be seen on the daily chart - the former resistance area with which the S&P 500 struggled in December and January.
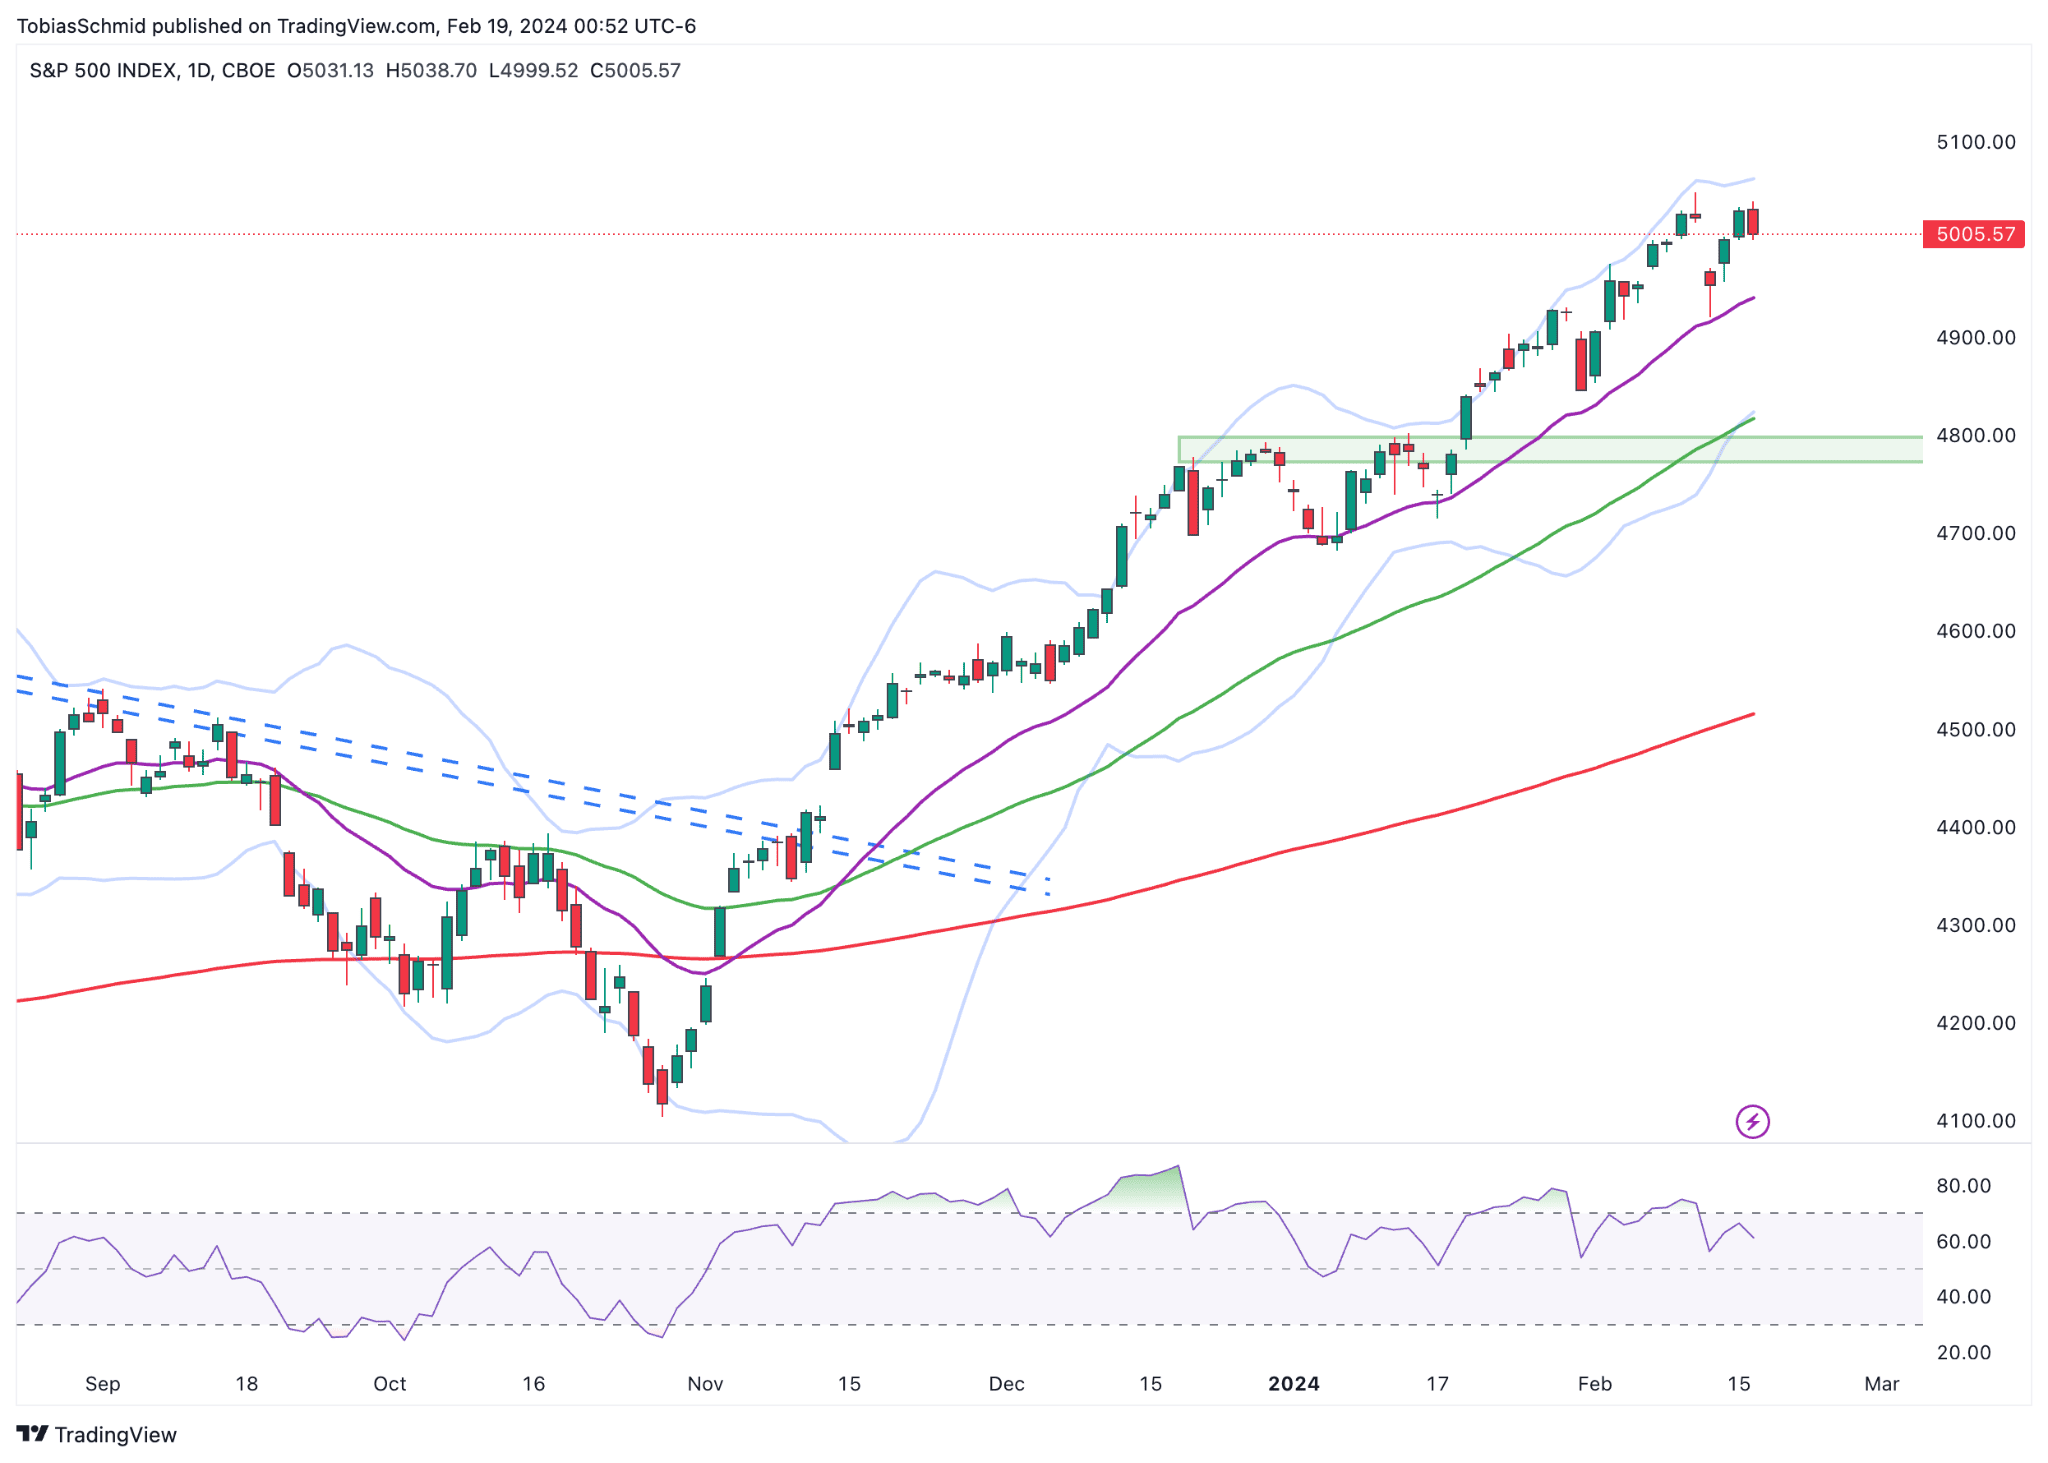
S&P 500 Index daily chart
If this support zone does not hold, a new long entry is possible at around 4600 points, where the next horizontal support area is located, due to the local highs from July 2023.
Leading offensive market sectors
When analyzing the individual market sectors of the S&P 500, the offensive sectors (Consumer Discretionary, Communication Services, Technology) were slightly weaker in the past trading week and Utilities, one of the most important defensive sectors, slightly stronger than the index.
This may be a sign that investors are currently becoming a little more cautious and is often a harbinger of a correction. In the medium to long term, however, the cyclical/offensive market sectors continue to clearly outperform and the defensive sectors are relatively weak. This is a confirming signal for the overriding upward trend. Should the market go into correction mode, sector analysis is also a very good tool at the short-term time level to identify possible turning points to the upside as soon as the offensive sectors show relative strength again.
Market breadth confirms upward trend
The Advance Decline Line of the New York Stock Exchange, which is considered one of the most important market breadth indicators, has also confirmed the breakout of the S&P 500 to new highs in recent weeks, which is a signal that the current rally is not only being led by a few heavyweights with a high market capitalization, but that the broad mass of stocks are participating in the upward trend.
A similar picture emerges when looking at the S&P 500 Equal Weight Index. Although this index has not yet reached a new all-time high, it has also broken through the resistance area and reached a new local high in the trend.
Author: Tobias Schmid
Date: 19.02.2024