Term structure curves are only indirectly related to (options) trading. Nevertheless, the topic is relevant for every options trader, which is why Alexander Eichhorn demonstrates the benefits of term structure curves in this blog post.
Range market vs. stock market
There are some fundamental differences between the commodities market and the stock market. While a share represents a small stake in a company, commodities are usually traded via forward products (futures), as there are no shares here. Share indices usually show an upward trend in the long term, as weaker companies are replaced by stronger ones. In contrast, most commodity markets are range markets that often move sideways for decades.

Futures are forward contracts for a specific commodity and have a fixed expiry date. In order to remain continuously invested in a commodity market, investors (as well as ETC providers) must purchase a new future as soon as the existing one expires, which is known as "rolling". This can result in both roll gains and roll losses.
Investors should check the product description of the trading instrument carefully. Take the popular gold ETC GLD, for example: the holdings here consist of 100 % of physical gold, not gold futures. In contrast, the well-known oil ETC USO holds only oil futures, but no physical oil.
- USO: Holds oil futures
- GLD: Holds physical gold
To summarize, it is relatively inexpensive for ETC providers to physically store precious metals such as gold and silver. For commodities such as crude oil, on the other hand, long-term storage is almost impossible or involves considerable costs, which is why ETC providers resort to the futures market. Alternatively, commodities can also be traded indirectly with "commodity" shares, such as Goldminenaktien.
Attention! Although the GLD-ETC is physically based, there is no Tax exemption after a holding period of one year, such as with Xetra-Gold!


Contango curve
Roll losses occur when futures contracts are extended, known as "rolling", when a contract that is about to expire is replaced by a new contract with a later maturity date. The expiring contract is closed and a new, longer-term contract is opened at the same time. If the underlying value of the future is in a situation in which short-term contracts are more favorable than long-term contracts (a so-called "contango situation"), rolling leads to a loss, which is referred to as a "roll loss".
As a rule, the prices of the underlying assets rise over the term of the contract, which is due to ancillary costs such as storage costs - also known as the "cost of carry". This price structure is referred to as "contango". If the underlying asset of a futures contract is in a contango situation, a loss is inevitably incurred when rolling, as the sale of the expiring contract brings in less than has to be paid for the purchase of the longer-term contract.
Video tip: Successfully use term structure curves for futures! https://youtu.be/EOGoQHlma48
Special situation: Backwardation
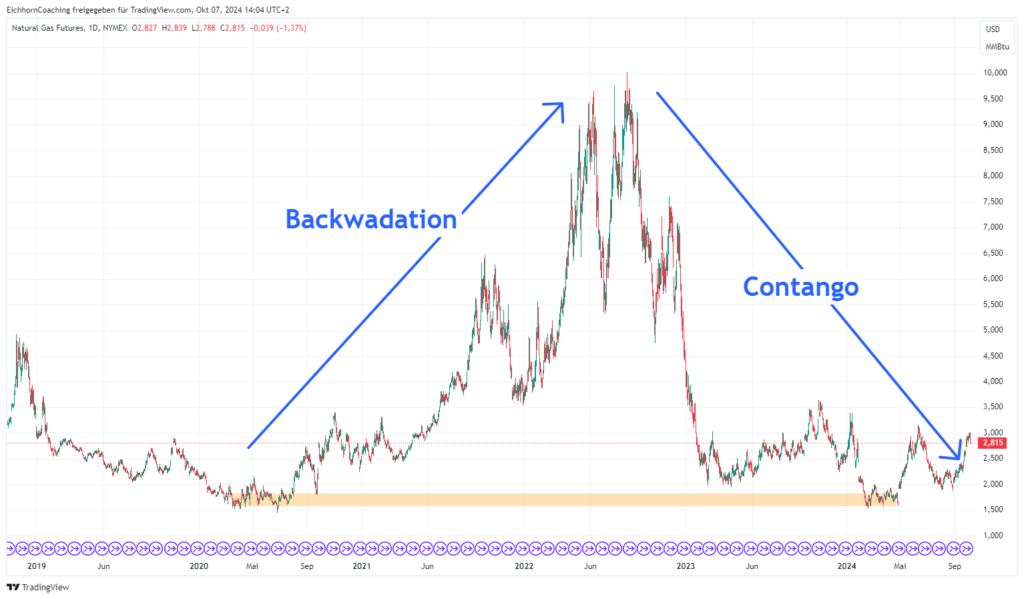
In special cases, the term structure curve can tilt. In such a situation, short-term contracts are more expensive than long-term contracts, which is often due to high demand or limited supply of a commodity. If a commodity is urgently needed, prices for short-term deliveries rise and sellers receive a so-called "availability premium". This price situation is known as "backwardation".
Backwardation is a special situation:
- Future contracts are cheaper than current contracts, which can occur in the event of factors such as supply shortages, poor harvests or political tensions. - Commodity traders who need the raw material immediately are dependent on fast delivery.

If an underlying asset is in a backwardation situation, rolling a futures contract does not lead to a roll loss, but to a roll profit. This is because the expiring contract is sold for more than the longer-dated contract costs. However, as backwardation situations are usually only temporary, rolling profits cannot be expected on a permanent basis.


Never short a backwardation!
Here is an important rule of thumb: never short a backwardation formation! A backwardation only occurs when there is a significant supply shortage, and prices often shoot up in such situations.
In a backwardation, futures-based ETCs benefit from rolling profits. However, as commodities are usually traded in a contango situation, roll losses predominate in the long term for these products.
When a term structure curve turns (no matter in which direction), this often signals a strong trend reversal in the market. Such market phases are particularly prone to black swan events, which is why traders should never bet against this curve. There have been several examples of this in the past:
- Natural gas price explosion on 14.11.2018: NG futures prices jumped by 20 % within a few minutes. Days earlier, the term structure curve was already in a backwardation.
- VIX explosion during the Corona crisis: The VIX index and the associated VIX futures rose dramatically during the coronavirus crisis. By the end of February 2020, the VIX futures structure was already showing backwardation.
- Oil price plunges into negative territory on 20.04.2020: The oil price fell to -$42, an event that is familiar to many. Shortly before this, the backwardation curve dissolved.
- Oil price increase during the Ukraine crisis: Months before the sharp price increase, the oil futures curve was already showing a backwardation.
- Volatility explosion from 05.08.2024The VIX volatility index rose from 23 to over 65 in the space of a day, with the VIX futures curve in backwardation days earlier.
Excursus: VIX term structure curve
If share prices correct by more than 20 %, this is generally referred to as a stock market crash. It is of course helpful to recognize such a collapse at an early stage, as we can then avoid or minimize losses by hedging or reducing long positions.
The VIX can be used, especially in combination with other indicators, as a tool for predicting possible stock market crashes. Among other things, we look at the term structure curve. As already explained, the VIX term structure curve usually in a "contango" situation, which means that the subsequent contracts are more expensive than those with a shorter remaining term. In contrast, there is the rather rare "backwardation" situation, in which the front contract is the most expensive. When VIX futures are trading in a backwardation situation, it is often already too late and the correction has already begun. Therefore, the change from contango to backwardation is crucial!

A daily look at the VIX futures can help to recognize corrections in the S&P 500 at an early stage. Of course, a change does not necessarily have to result in a crash; prices can also recover and volatility can return to its normal range. However, should a change from contango to backwardation occur, it may be advisable to close long positions or establish suitable hedging strategies.
Podcast tip: Hedging with VIX options - effective protection against flash crashes - listen here
Conclusion - using term structure curves profitably
At first glance, the topic of term structure curves may not seem directly related to options trading, but it is of great importance for traders who operate in the futures market or with exchange-traded commodities (ETCs). The fundamental differences between equity and commodity markets, especially with regard to futures, have a significant influence on trading strategies and decisions.
The analysis of forward structure curves, in particular the differentiation between contango and backwardation, can provide valuable insights and help traders to make informed decisions. Rolling losses and gains when rolling futures contracts must be taken into account, as well as the potential impact of backwardation on prices and market volatility.
An important rule of thumb is that you should never go short against a backwardation, as this is often accompanied by sharp price rises and black swan events. Instead, it is advisable to wait for the backwardation to end before implementing appropriate trading strategies.
Analyzing term structure curves illustrates how crucial it is to continuously monitor the market and be aware of current conditions. This can help traders minimize risks and identify opportunities to trade profitably.