Your Broker for worldwide trading

DGI SAMPLE PORTFOLIO: THE JOHNSON & JOHNSON SHARE

  • Johnson & Johnson (JNJ) achieves its sales thanks to an established network of locations and business partners worldwide.
  • Following the spin-off of the consumer goods division, JNJ is concentrating on the high-margin medical technology and pharmaceuticals segments
  • JNJ has the highest credit rating of AAA from Standard & Poor's (the only company in the world besides Microsoft). The healthy balance sheet with very low debt and a moderate goodwill position forms a solid foundation for maintaining its market position
  • The existing business reliably delivers high Cash flowswhich enable investment in new growth opportunities through acquisitions and shareholder-friendly capital allocation in the form of dividend payments and share buyback programs
  • Click here for the DGI model portfolio and here to the overview of this series The dividend custody account
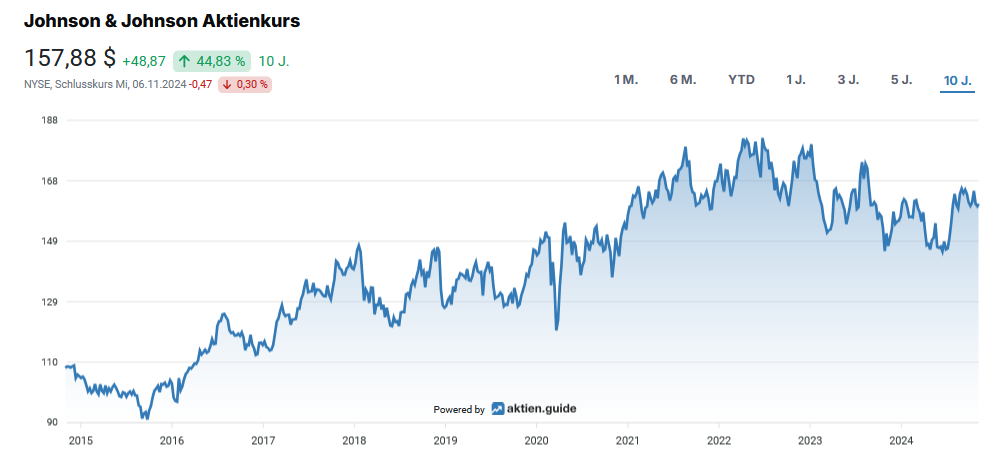
Line chart showing the development of the Johnson & Johnson share price from 2015 to 2024, highlighting fluctuations and a peak in 2022. The price on November 6, 2024 is 157.88 with a daily change of +4.83.
Johnson & Johnson share chart (source: aktien.guide)

Company profile and business model: Who is Johnson & Johnson and what does it do?

Headquartered in New Brunswick (New Jersey) With over 150,000 employees, the globally active pharmaceutical group Johnson & Johnson is one of the largest players in the healthcare sector today. The company's roots go back to the 1880s when, under the leadership of Robert Wood Johnson Together with his brothers James Wood and Edward Mead, the first factory for the manufacture of primarily sterile dressing products was opened.

Image of a historic building with a text overlay about the founding of Johnson & Johnson by Robert Wood Johnson and his brothers, highlighting the growth and expansion of the company through 1894.
The founding of Johnson & Johnson (source: Official website)

Unfortunately, it was the less pleasant events that enhanced Johnson & Johnson's reputation and recognition beyond the borders of the US state of New Jersey. The medical and surgical products were used in the Spanish-American Warwhich sealed the end of the Spanish colonial empire in America, and in the event of natural disasters such as after the San Francisco earthquake of 1906.

In 1944, almost six decades after the company was founded, the IPO on the New York Stock Exchange. Johnson & Johnson had by then developed into one of the largest producers of medical and hygiene products as well as an established supplier to the US military during the Second World War.

You are currently viewing placeholder content from Youtube. To access the actual content, click the button below. Please note that doing so will share data with third-party providers.

More Information
Video: Johnson & Johnson under the dividend magnifying glass of dividend stock investor Clemens Faustenhammer

Since the post-war period (and to this day), the entrepreneurial development of Johnson & Johnson has been characterized by international expansion beyond the US domestic market. A milestone and at the same time the nucleus for innovation was the acquisition of the Belgian pharmaceutical company Janssen Pharmaceutica The medical technology supplier McNeil Laboratories was acquired just a few years earlier. In the 2000s, the consumer healthcare business of Pfizer to this. In 2017, JNJ acquired the Swiss pharmaceutical company Actelion for approximately USD 30 billion. This acquisition is still Johnson & Johnson's largest corporate takeover.

Johnson & Johnson's operating divisions could be divided into three separate segments by 2023. For the first time, management communicated a planned separation from the Consumer Products segment at the end of 2021.
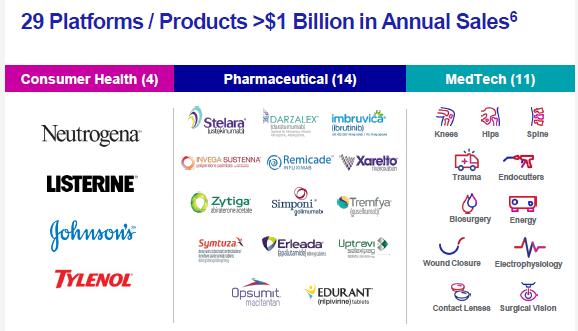
Infographic with 29 products with a turnover of over 1 billion US dollars, categorized into the areas of consumer health (4), pharmaceuticals (14) and medical technology (11), with product names and symbols.
Johnson & Johnson's business segments until 2023 (source: Investor Fact Sheet 2022)

Today the business model of Johnson & Johnson essentially consists of two reportable segments: Innovative Medicine and MedTechwhich combine groups of various products.

The higher-margin and higher-growth business segment is the Pharmaceuticals division. In this segment, the company develops, produces and sells a comprehensive range of medicines, which in turn cover a variety of illnesses, from rare diseases to common ailments.

The second business segment is Medical Devices, in which Johnson & Johnson offers a broad portfolio of products used in surgical procedures, orthopaedic treatments and many other medical areas.

Two pie charts show sales in the nine months of financial year 2024: by geographical region (USD 37.1 billion in the USA, USD 15.3 billion in Europe, USD 10.3 billion in Asia-Pacific/Africa, USD 3.6 billion in the Western Hemisphere) and by segment (USD 42.6 billion Innovative Medicine, USD 23.7 billion MedTech).
Distribution of sales by business segment and region of Johnson & Johnson (Source: 10-Q Report Q3 2024, p. 42)

Johnson & Johnson and its subsidiaries are active in practically every country in the world, although the main markets, products and distribution methods vary in international business. At just under 60 percent, the majority of sales are generated in the United States. Europe follows in second place with a share of over 20 percent. The presence in many regional markets diversifies the income streams away from the US lump.

Johnson & Johnson began the spin-off of its Consumer Health division in November 2021. In September 2022, Johnson & Johnson chose Kenvue as the new name for its spin-off business, which went public in May 2023. In July 2023, Johnson & Johnson launched an exchange offer for the spin-off of Kenvue, which was oversubscribed was. Upon completion of this voluntary tender offer, Johnson & Johnson will hold approximately 9.5 percent of Kenvue's outstanding common stock.
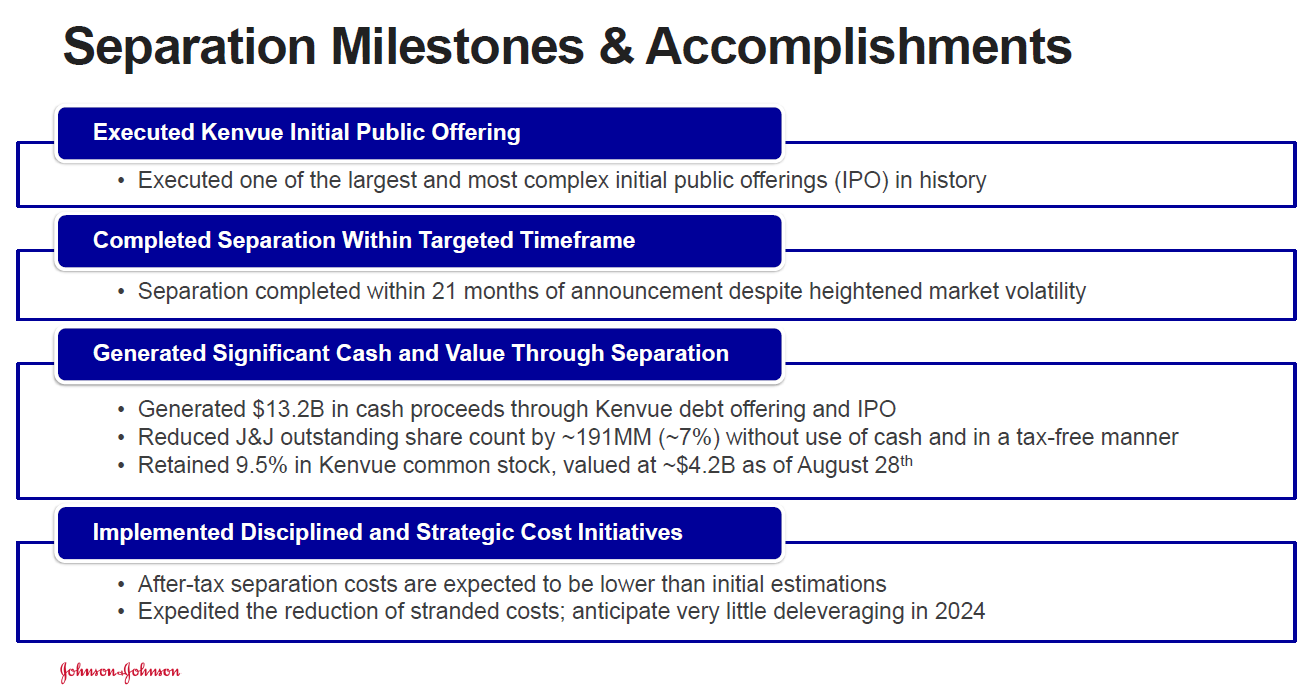
The infographic, titled "Separation Milestones and Accomplishments," outlines the execution of the IPO, timely separation, cash generation and cost initiatives related to Kenvue, noting Johnson & Johnson.
Milestones in the split-off of the Consumer Health division of Johnson & Johnson (Source: Updated 2023 Guidance, p. 6)

The Corporate strategy of Johnson & Johnson is closely interwoven with the strategic allocation of capital. The priorities for the business focus in terms of investments can be derived from this. Priority is given to investing in organic growth. Examples of measures include promoting the product pipeline, increasing research and development expenditure and expanding sales activities. The resulting free cash flow is available for the acquisition of new companies on the one hand and for dividend distributions and share buybacks on the other.
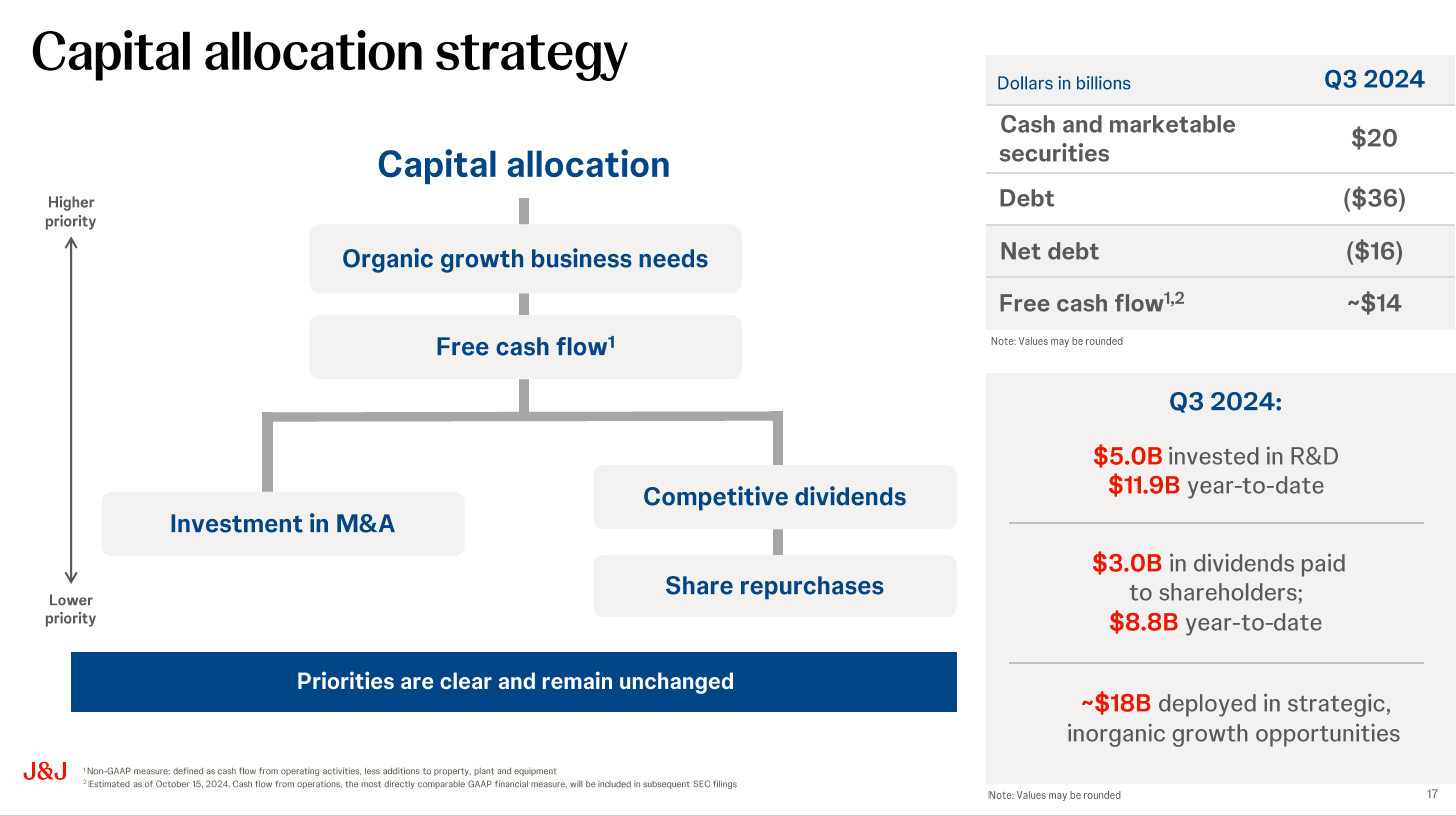
Diagram entitled "Capital allocation strategy" with priorities: organic growth, mergers and acquisitions, dividends, share buybacks. Q3 2024 shows details on investments in R&D, dividends, cash flow and debt.
The corporate strategy for capital allocation at Johnson & Johnson (source: Q3 2024 Earnings Presentation, p. 17)

The Acquisitions play a central role in the inorganic growth of Johnson & Johnson. The focus is on complementary expansion along the company's own value chain in order to open up market segments that the healthcare group is either not yet active in or to strengthen its current market position through a company takeover. A current example of such a strategic acquisition is the Acquisition of Shockwave Medicala manufacturer of medical devices for the treatment of cardiovascular diseases. The transaction volume amounted to USD 13.1 billion and was completed in May 2024.

At the ownership structure Johnson & Johnson is characterized by the extremely high proportion of Institutional investors on. This amounts to over 75 percent and is usually fed by the "usual suspects" of asset managers.

Since January 2022 Joaquin Duato Johnson & Johnson as Chief Executive Officer (CEO) and President of the Board of Directors. Born in Valencia, the Spanish-American dual citizen began his career at Janssen Pharmaceutica more than 30 years ago. Now 62, he is the eighth CEO of Johnson & Johnson since the company went public in 1944.
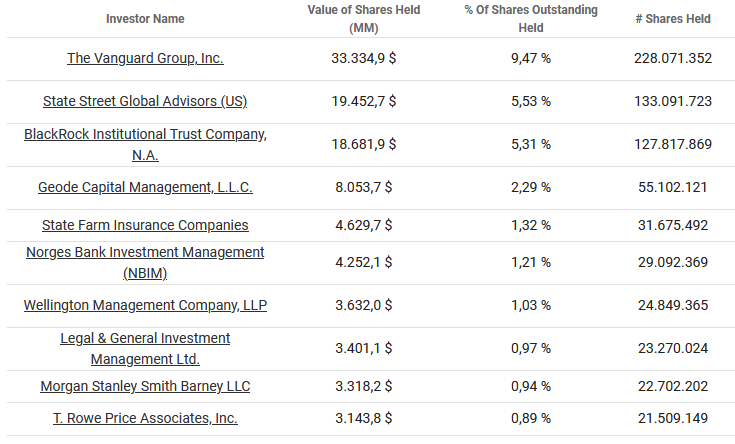
Table with information on the investors, the value and percentage of shares held and the number of shares in various companies.
Ownership structure of Johnson & Johnson (Source: tikr.com)

Industry profile and competitive situation

The characteristics of the business model of Johnson & Johnson does not make comparison with listed competitors quite so easy, as the combination of medical technology and pharmaceuticals represents a unique selling point.

As an expedient guide, I decided to use the two competitors Merck & Co. and Pfizer for the comparison of key figures. Whether this list includes other industry giants such as Roche, Sanofi, Abbvieetc., each investor can decide for themselves. I limited my selection exclusively to the US market.

A financial comparison table of JOHNSON & JOHNSON, Merck and Pfizer presents key figures such as sales growth, dividends and net profit margin in German. JOHNSON & JOHNSON is marked "yes" for the last criterion.
Competitive comparison of Johnson & Johnson with Merck and Pfizer (source: own presentation)

The financial situation of Johnson & Johnson

After gaining an overview of the industry in general and taking a closer look at the company, its management and its competitors, we take a look at Johnson & Johnson's balance sheet and the key financial figures derived from it. The focus here is on the following aspects Growth, profitability and the Financing.

To analyze the financial situation, the first step is to look at the development of sales, profit and free cash flow. I have already discussed the internal distribution of turnover per segment in the section on the business model above. On average, the top line has grown over the last five years by 1.4 percent p.a. on. The low growth can be explained by the spin-off of Kenvue.
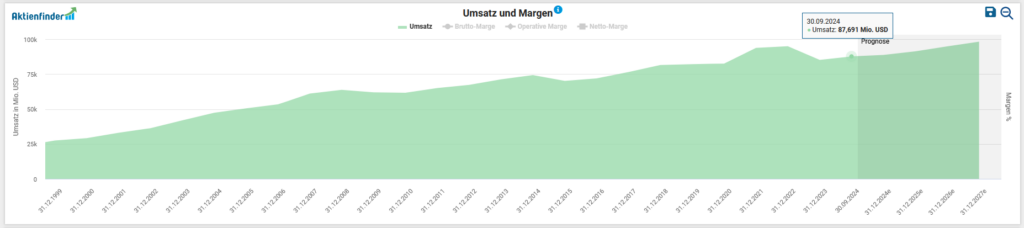
A graph showing increasing sales and profit margin over time, with data points marked on the line ending at a high on October 31, 2024 and labeled with USD values.
Development of Johnson & Johnson's sales (source: Aktienfinder)

The (adjusted) Earnings per share we have seen a dynamic upward trend for ten years. If we take the past financial year 2023 as a basis, the restructuring of the Adjusted earnings per share at 2.3 percent (USD 9.92 vs. USD 10.15). In the past financial year, Johnson & Johnson generated a Net profit from USD 13.3 billionif the special effects are deducted from the annual result.
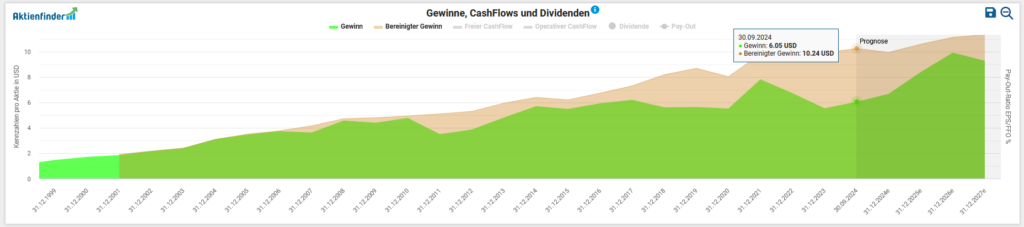
The line chart titled "Earnings, cash flows and dividends" shows earnings and cash flows from 1997 to 2021 in USD. The data shows an upward trend for this period.
Development of Johnson & Johnson's earnings per share (source: Aktienfinder)

The amount available to the company Free Cash-Flow can be used to repay debt, expand via company acquisitions, pay out (increasing) dividends or buy back shares. In absolute figures, the financial picture from operating and free cash flow as well as capital investments (CapEx) for the period 2016 to 2023 is as follows:
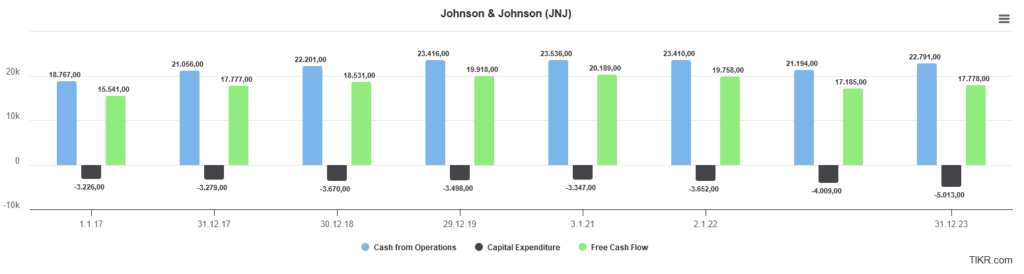
Bar chart of Johnson & Johnson's financial data from 2017 to 2023, showing cash flow from operating activities, capital expenditure and free cash flow in blue, black and green bars.
Development of Johnson & Johnson's free cash flow (source: tikr.com)

A look at the Debt situation tells us that, based on the last financial year, Johnson & Johnson has interest-bearing financial liabilities of USD 30.4 billion, which in turn is offset by cash and cash equivalents and securities totaling USD 22.9 billion. If we now divide the remaining net debt of USD 7.5 billion by the most recently generated EBITDA of USD 30.8 billion, the result is 0.2. This result is miles below the threshold value of 3, which is considered critical. I will therefore spare myself an in-depth examination of the maturity structure of the long-term liabilities and their interest conditions.
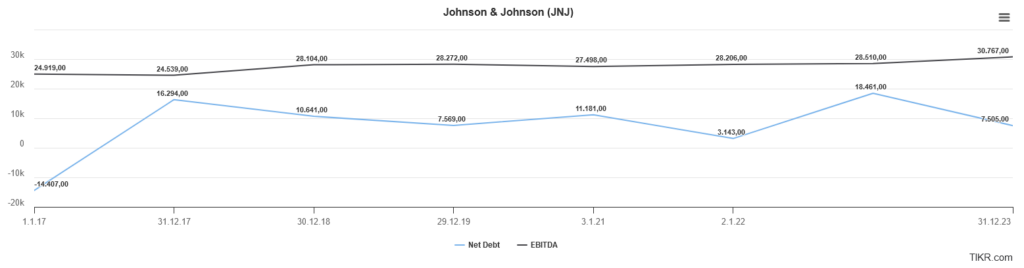
Line chart showing the net debt and EBITDA of Johnson & Johnson from 1.1.17 to 31.12.21. Net debt varies between -3,447.00 million and 5,452.00 million; EBITDA ranges from 25,281.00 million to 30,670.00 million.
Development of Johnson & Johnson's net debt and EBITDA (source: tikr.com)

Finally, we look at the Profitability of Johnson & Johnson based on the development of gross, operating and net margins. The stability of the gross and net margin should be emphasized positively.
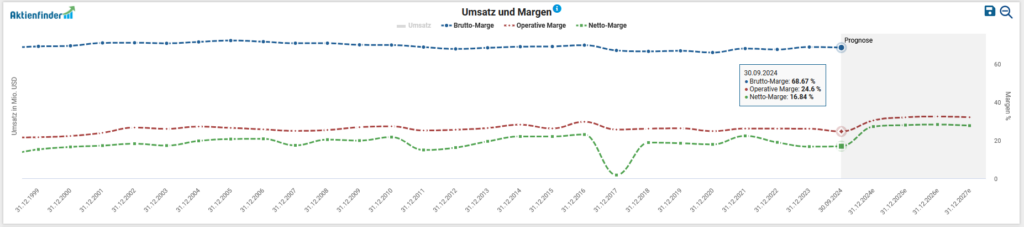
Line chart showing sales and margins over time, with future forecast highlighted. Turnover is in blue, gross margin in red and net margin in green. The data ranges from May 2011 to April 2014.
Development of Johnson & Johnson's margins (source: Share finder)

Opportunities & risks

JNJ's management is pursuing a stringent corporate strategy that is fully geared towards growth in both business segments. The multi-layered pipeline of new projects and the numerous strategic partnerships form the basis for growing cash flows in the future. I think it is important to mention that Johnson & Johnson has an established global research & development, sales and production network. The decentralized structure is expressed in 62 different locations that are embedded in the company's global supply chain, which was restructured in 2018.

The products themselves are protected from competition due to legal restrictions. The capital-intensive research process up to market maturity and final approval by the health authorities is also characterized by a moat that new competitors must first overcome to enter the pharmaceutical industry.

Thanks to long-term growth in sales and cash flow, coupled with billions in investment and research costs, the company has kept its net debt close to zero for years. The highest rating awarded by S&P Credit rating AAA rating confirms the excellent creditworthiness of Johnson & Johnson.

One negative aspect of investing in the pharmaceutical industry is the potential for price controls by the regulator. These are not uncommon in the healthcare industry and were also a prominent and controversial topic during the election campaign in the United States. In general, regulatory changes in the laborious approval process represent a permanent risk for product development in the pharmaceutical industry.

In particular, the claims for damages due to the asbestos-contaminated, cancer-causing Baby powders are currently in the spotlight. The plan to set up a subsidiary specifically for this purpose in 2021 called LTL Management, which was to be sent into insolvency following the transfer of the lawsuits to this legal entity, was declared bankrupt for the second time by the Court rejected. Provisions worth billions had to be formed for these pending proceedings.

JNJ's research and development expenses amount to just under USD 15 billion per annum on a three-year average. The risk of clinical trials being halted during the product development process can result in impairment losses on intangible assets. An example of this is the prematurely terminated project bermekimab in 2022, which cost JNJ a total of USD 0.6 billion.

Current valuation of the Johnson & Johnson share

For the valuation of companies, I use the so-called Enterprise Value (EV) is used. In the case of a takeover, the EV indicates the amount required to purchase the assets required for operations and excludes the non-operating assets. I relate this key figure to operating profitability (before interest, taxes and investments (CAPEX)), expressed as EBITDA. The prevailing opinion is that a value of less than 10 indicates a „healthy valuation“ - as is always the case with generic Rules of thumb the company-specific context must be considered in the analysis by the careful investor himself. In the case of Johnson & Johnson, we have to consider a similar Valuation result of 13.2 not far in the past. In recent months, the pharmaceutical stock was even available at a slightly lower price:
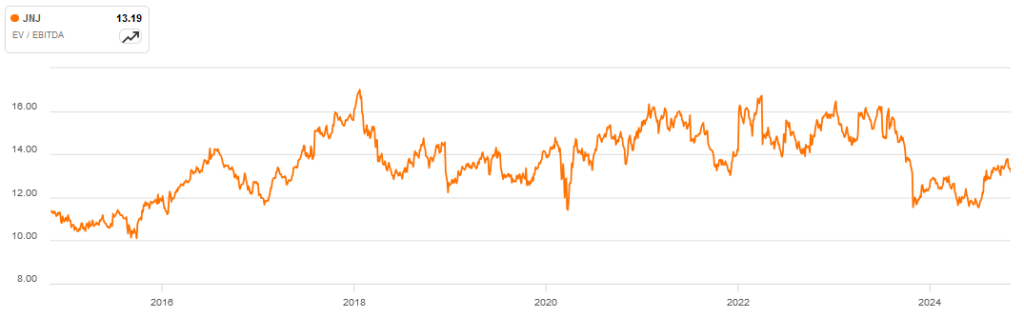
Line chart showing the EV/EBITDA ratio trends from 2016 to 2024, with the fluctuating values peaking around 2021 and decreasing towards 2024.
Enterprise Value to EBITDA of Johnson & Johnson (Source: Seeking Alpha)

The Maximum decrease in the last six years amounted to approx. 21 percent in March 2020 at the time when the coronavirus pandemic broke out worldwide:
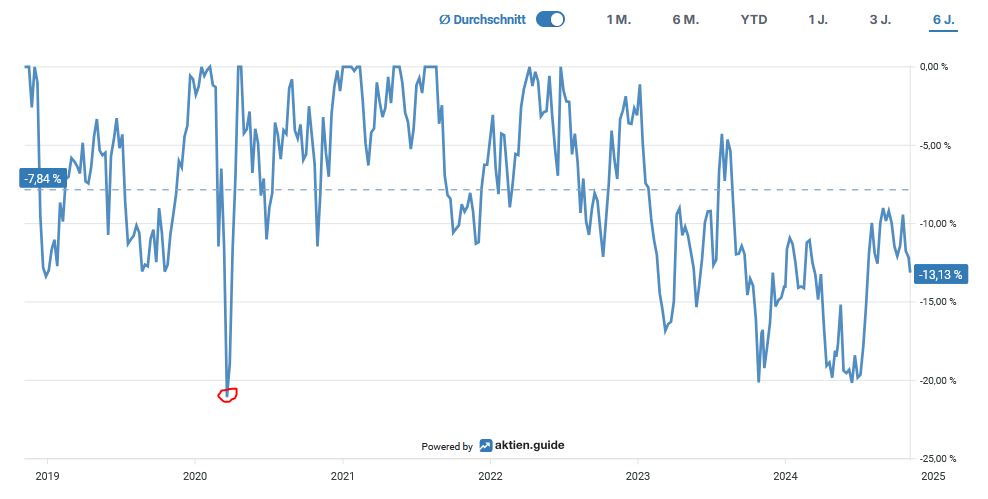
Line chart showing percentage changes from 2019 to 2025 with notable fluctuations, including a sharp decline in early 2020 marked by a red circle. Data points reflect average percentages over time.
Underwater chart of Johnson & Johnson (source: aktien.guide)

Over the past six years, an investment in Johnson & Johnson has yielded Total Return, including dividends received, a Overall performance from 31.3 percent for the investor:
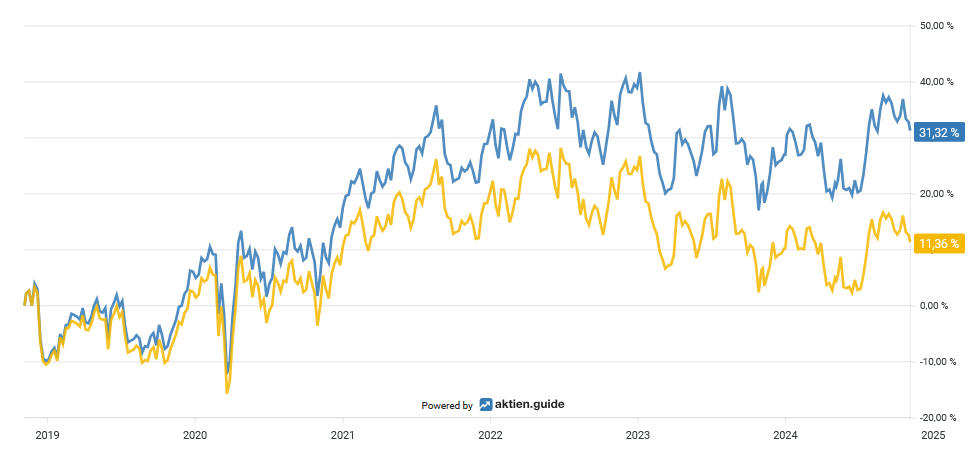
Line chart with two data series from 2019 to 2025, with the blue line peaking at 31.32 % and the yellow line at 11.36 % in 2025.
Total return of Johnson & Johnson (source: aktien.guide)

Capital allocation of Johnson & Johnson

Since meanwhile 62 years Johnson & Johnson has been paying a higher dividend to its shareholders every year. With this impressive series of dividend increases, JNJ is not only one of the world's leading dividend payers. Dividend aristocratsbut even a Dividend king
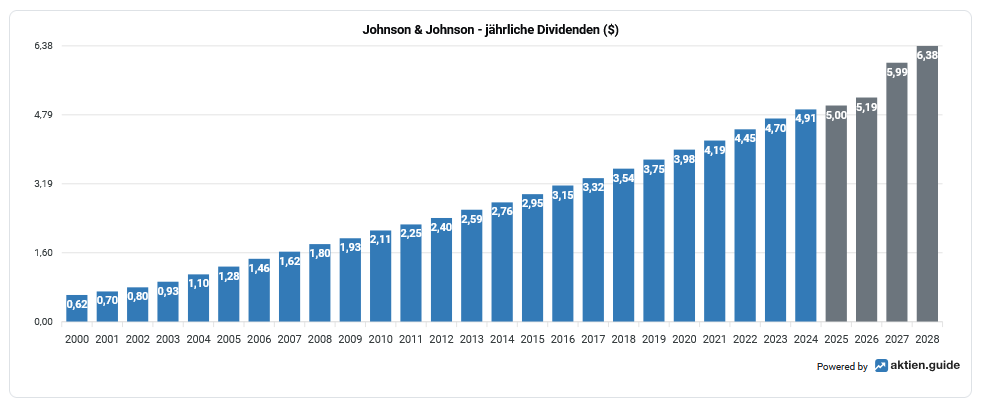
Bar chart showing Johnson & Johnson's annual dividends in dollars from 2000 to 2023, with steady growth each year, reaching 5.38 $ in 2023.
Dividend history of Johnson & Johnson (source: aktien.guide)

At the current share price of USD 148.34, this results in a Dividend yield from 3.21 percent. The Five-year dividend growth rate amounts to 5.8 percent p.a. or 6.1 percent p.a. in the Ten-year period. The company last increased its dividend by 4.2% in April of this year. To round things off, here is an overview of the last five dividend increases:

  • 2023: +5,3 %
  • 2022: +6,6 %
  • 2021: +5 %
  • 2020: +6,3 %
  • 2019: +5,6 %

The quartalsweise ausgeschüttete Dividende currently amounts to USD 1.24 per share and is paid out at the end of each quarter (March, June, September, December).

If we take the average value of the Free Cash Flow of the last three years as the basis for determining the Payout ratio we end up with a moderate result of 63.1 percent for the payout ratio of Johnson & Johnson.

Over the past six years, the number of Number of shares outstanding added together by 10.3 percent. The split-off from Kenvue is important in this context. Share swap program to be taken into account. The number of shares outstanding was reduced by 191 million. The execution of this measure can be clearly seen in the chart below:
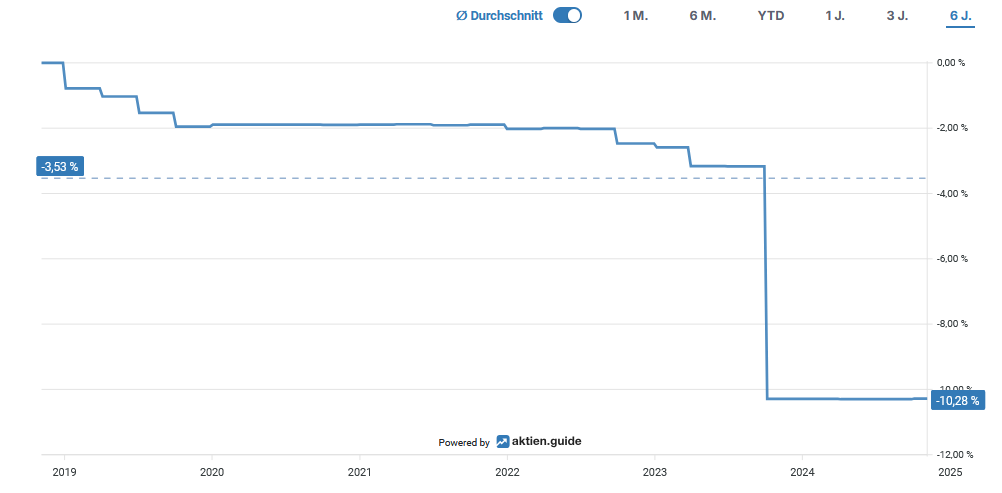
Line graph showing a steady decline in value from 2019 to 2023, with a sharper decline in 2024, corresponding to a change from -3.53 % to -10.28 %.
Share buybacks by Johnson & Johnson (source: aktien.guide)

Most recently, the management bought back treasury shares worth over USD 0.5 billion in the third quarter of 2024:
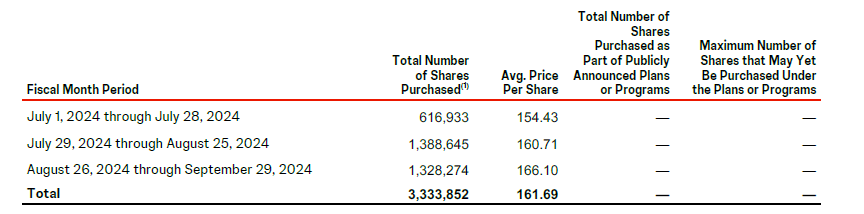
Table with monthly share purchases from July 1 to September 29, 2024. Total number of shares: 3,333,852. Average price per share: 161.69. The total number includes both announced plans and the open market.
Johnson & Johnson share buyback program (source: 10-Q Report Q3 2024, p. 59)

Conclusion: Considerations for my decision to invest in Johnson & Johnson

Compared to the basic line-up of a soccer team, Johnson & Johnson forms the heart of a strong and reliable defense for the portfolio. Stability, reliability and predictability are the virtues paired with long-term growth and an impeccable balance sheet. In addition, the US group is focusing on a growing market that is being driven by increasing demand for healthcare products and technological advances in medical technology. The fact that the company has been increasing its dividend without interruption for over six decades can be taken as a valid indicator of a successful business model.

Anyone looking to reach lofty (share price) heights with an investment in the pharmaceutical company will probably have to look elsewhere. This does not necessarily have to be the case with one of the largest healthcare companies in the world. In a solidly positioned portfolio that is broadly invested along the various value chains, Johnson & Johnson is a worthy representative of the healthcare sector. To paraphrase a soccer truism: Offense wins games, defense wins championships. And as we all know, this consists of more than one or two successfully completed rounds.


THE NEXT WEBINARS WITH CLEMENS FAUSTENHAMMER AT CAPTRADER

Ein professionelles Porträt eines lächelnden Mannes namens Clemens Faustenhammer in dunkler Jacke und blauem Hemd vor unscharfem Hintergrund.
Clemens Faustenhammer

The private investor from Austria Clemens Faustenhammer with a focus on dividend growth stocks and total return, lives with his family near Vienna. As a graduate in business administration with a strong passion for economic history, he has held various management positions in the financial sector for over a decade. The stock market plays an important role both professionally and privately. He has been investing in the capital market since 2005, with a particular focus on individual stocks for the past ten years.

View all posts
Mandatory information and disclaimer

This is a marketing communication within the meaning of Section 63 (6) of the German Securities Trading Act and does not contain investment strategy recommendations, investment recommendations or financial analyses in accordance with Section 85 of the German Securities Trading Act and Article 20 of the Market Abuse Regulation. It therefore does not fulfill the legal requirements to guarantee the objectivity of investment strategy recommendations/investment recommendations/financial analyses. CapTrader GmbH or its employees are therefore not legally prohibited from trading or providing services in the securities products mentioned therein prior to publication of the information.

Past performance, simulations or forecasts are not a reliable indicator of future performance. Mandatory information and limitation of liability for CapTrader and any third-party content providers can be found at https://www.captrader.com/marketingmitteilung/angaben
Please note that investing in financial instruments involves high risks and take note of our disclaimer and the mandatory legal information at the locations indicated.

  1. Mandatory information

Responsible: CapTrader GmbH, Elberfelder Straße 2, 40213 Düsseldorf; Commercial Register Number: HRB 86537 Düsseldorf Local Court; VAT ID DE323771603; Managing Directors Andreas Weiß, Christian Weiß, Michael Heyder; Tel: +49 211-740786-00, Fax: +49 211-740786-90.

Zuständige Aufsichtsbehörde: Bundesanstalt für Finanzdienstleistungsaufsicht, Graurheindorfer Straße 108, D – 53117 Bonn und Marie-Curie-Str. 24-28 D – 60439 Frankfurt am Main, Tel: 0228 4108 – 0 Fax: 0228 4108 1550 E-Mail: poststelle@bafin.de; Institutsnummer 10156708

Conflicts of interest CapTrader in marketing communications: CapTrader GmbH confirms that it does not hold any positions in the mentioned financial instruments beyond the positions mentioned in the marketing communication itself, if applicable. There are also no other conflicts of interest within the meaning of CapTrader GmbH's Financial Analysis and Marketing Communication Policy.

Conflicts of interest and mandatory disclosures by the third-party content provider for marketing communications with financial instrument recommendations: See under https://www.captrader.com/marketingmitteilung/angaben  to creators of third-party content

The copyright to the marketing communication is reserved. Reprinting and distribution is only permitted with our consent.

  1. Disclaimer

By accepting the content, the recipient accepts the binding nature of the limitation of liability.

a) Disclaimer for third-party content

CapTrader GmbH offers authors - such as editors, guest commentators, agencies and companies - the opportunity to publish comments, analyses, news and company announcements. Their opinions do not necessarily reflect the opinions and views of CapTrader GmbH and its employees. CapTrader GmbH assumes neither liability nor guarantee for this content. This applies in particular to incomplete or incorrectly reproduced reports, incorrect price information and editorial errors. Liability claims relating to material or immaterial damage caused by the use or non-use of the published information or by the use of incorrect or incomplete information are fundamentally excluded.

b) Exclusion of liability for CapTrader's own content

CapTrader has taken its own information in this marketing communication from sources believed to be reliable, but has not verified all such information itself. Accordingly, CapTrader makes no warranties or representations as to the accuracy, completeness or correctness of the information or opinions contained herein. Subsequent changes cannot be taken into account. The marketing communication does not constitute an offer or solicitation to buy shares of the issuer and is in no way a substitute for advice appropriate to the investor and the property. We cannot verify whether the information in the marketing communication is in line with your personal investment strategies and objectives. We recommend that you consult an investment advisor for advice that is appropriate to the investor and the property. The marketing communication cannot and should not replace a securities prospectus and/or expert investment advice required for an investment. It can therefore never be the sole basis for an investment decision. By accepting the marketing communication, the recipient accepts the binding nature of the above limitation of liability.

CapTrader provides the information despite careful procurement and provision only without guarantee for the correctness / completeness, timeliness or accuracy and availability of the stock exchange and economic information, prices, rates, indices, general market data, valuations, assessments and other accessible content held and displayed for retrieval. This also applies to third-party content. Historical observations and forecasts are not a reliable indicator of future developments. The facts presented in particular in connection with product information are for illustrative purposes only and do not permit any statements to be made about future profits or losses. Any conditions stated are to be understood as non-binding indications and are dependent on market developments on the day of conclusion.

CapTrader accepts no liability for any direct or indirect damage caused by and/or related to the distribution and/or use of this marketing communication.

The information, opinions and statements correspond to the status at the time of preparation of the marketing communication. They may be outdated due to future developments without the publication being changed.

CapTrader is not obliged to update, amend or supplement the information in this marketing communication if a circumstance mentioned in this publication or a statement, estimate or forecast contained therein changes or becomes inaccurate. The presentation of the performance of financial instruments over previous periods does not provide a reliable indication of their future performance. No guarantee can therefore be given for the future price, value or income of any financial instrument mentioned in this publication.

Despite careful control of the content, we assume no liability for the content of external links. The operators of the linked pages are solely responsible for their content.

Distribution: This publication may only be distributed in accordance with the laws of the respective countries, and persons in possession of this publication should inform themselves about the applicable local regulations. The information contained herein is not intended for natural or legal persons who, due to their place of residence or business, are subject to a foreign legal system that imposes restrictions on the distribution of such information. The contents are therefore exclusively in German. In particular, this publication contains neither an offer nor an invitation to purchase securities to citizens of the USA, Great Britain and Australia.

Taxes: The tax treatment of financial instruments depends on the personal circumstances of the respective investor and may be subject to future changes, which may also have a retroactive effect.

Historical observations and forecasts are not a reliable indicator of future developments. The facts presented in particular in connection with product information are for illustrative purposes only and do not permit any statements to be made about future profits or losses. Any conditions stated are to be understood as non-binding indications and are dependent on market developments on the day of conclusion.

CapTrader accepts no liability for direct or indirect damage caused by and/or in connection with the distribution and/or use.

The information, opinions and statements correspond to the status at the time of preparation of the marketing communication. They may be outdated due to future developments without the publication being changed.

CapTrader is not obliged to update, amend or supplement the information if a circumstance mentioned in this publication or a statement, estimate or forecast contained therein changes or becomes inaccurate. The presentation of the performance of financial instruments over previous periods does not provide a reliable indication of their future performance. No guarantee can therefore be given for the future price, value or income of any financial instrument mentioned in this publication.

Despite careful control of the content, we assume no liability for the content of external links. The operators of the linked pages are solely responsible for their content.

Distribution: This publication may only be distributed in accordance with the laws of the respective countries, and persons in possession of this publication should inform themselves about the applicable local regulations. The information contained herein is not intended for natural or legal persons who, due to their place of residence or business, are subject to a foreign legal system that imposes restrictions on the distribution of such information. The contents are therefore exclusively in German. In particular, this publication contains neither an offer nor an invitation to purchase securities to citizens of the USA, Great Britain and Australia.

Taxes: The tax treatment of financial instruments depends on the personal circumstances of the respective investor and may be subject to future changes, which may also have a retroactive effect.

Email:

info@captrader.com

Send e-mail

Phone:

Hotline (Germany)
0800-8723370

Hotline (International)
00800-08723370

Further contact options