Your Broker for worldwide trading

Positive quarterly figures boost Nasdaq 100

Stock price chart showing a sharp decline followed by a partial recovery, with two moving averages and highlighted resistance areas and trading volume bars below.

Dear traders, dear stock market friends.

The Nasdaq 100 has staged a brilliant comeback in the last two weeks. In the past trading week, positive quarterly results from tech giants such as Microsoft and Meta, among others, led to a further improvement in sentiment and a further rise in share prices. The Nasdaq 100 was up 3.45% on the previous week and has already gained more than 20% since its low on April 7. The strong and rapid recovery certainly came as much of a surprise to many market participants as the previous price slump.

Positive quarterly figures provide tailwind

The reporting season has reached its peak in the last few days. Many of the Magnificent 7 stocks published their quarterly results last week, which were eagerly awaited.

Microsoft share price explodes after earnings announcement

Microsoft once again presented very strong results on Wednesday evening after the close of trading: With a turnover of 70.1 billion US dollars and earnings per share of 3.46 US dollars, forecasts were clearly beaten. The Azure cloud division in particular showed impressive momentum with revenue growth of 33 percent. Microsoft 365 also benefited from the growing interest in AI applications such as Copilot, which led to higher revenue per user. The gaming segment performed solidly, while the devices segment stagnated. 

Microsoft's share price already rose significantly in after-hours trading and was up more than 11% on a weekly basis.
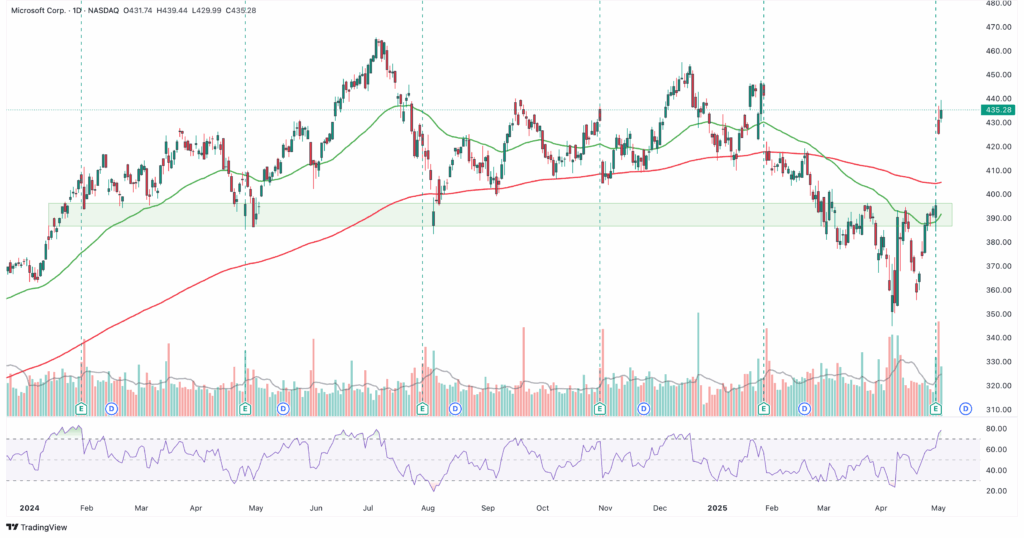
Line chart of the Microsoft share price from April 2023 to May 2024 with moving averages, trading volume bar and RSI indicator below the main chart.
Microsoft share daily chart

Meta Platforms continues to invest heavily in AI

Meta Platforms also published earnings on Wednesday evening and was also able to impress. Revenue rose to USD 42.32 billion in the first quarter and earnings per share of USD 6.43 were well above expectations. The advertising business - Meta's core area - once again posted double-digit growth, supported by the successful monetization of reels and returns from former TikTok advertising customers. At the same time, Meta is investing heavily in AI infrastructure and has increased its investment budget to up to USD 72 billion. This is causing mixed reactions on the market, as high expenditure on the one hand and the loss-making Metaverse project Reality Labs on the other raise questions about long-term profitability. However, the share reacted positively and gained 9.1 percent on a weekly basis.
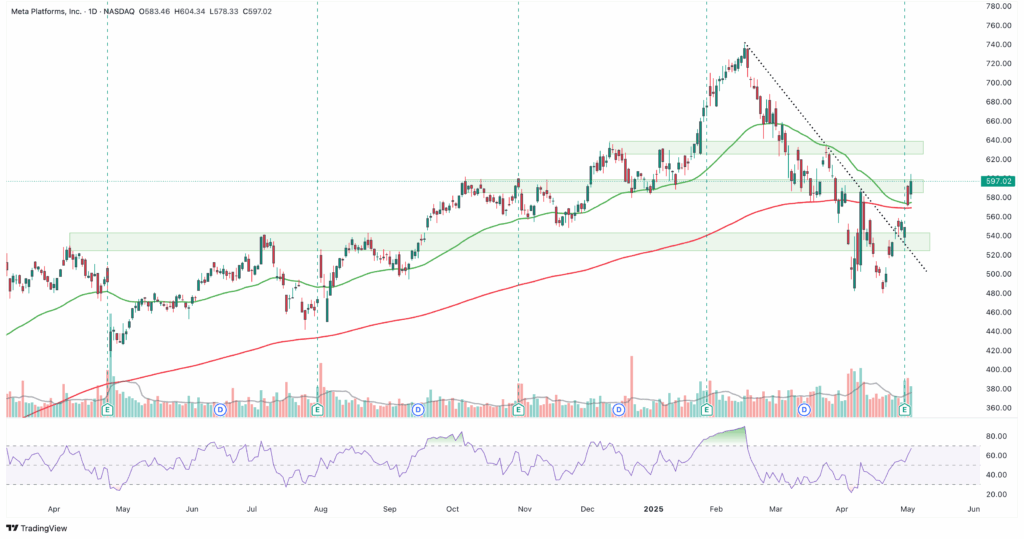
Stock chart for Meta Platforms, Inc. with daily candlestick charts, moving averages, trading volume, support/resistance zones and RSI indicator from April 2023 to May 2024.
Meta Platforms share daily chart

Apple: Breakout postponed

Apple only slightly exceeded analysts' estimates on Thursday evening. Quarterly sales amounted to 95.4 billion US dollars, with earnings per share of 1.65 US dollars. While iPhone sales stagnated, Apple's Services division was able to shine with a record figure of 26.6 billion US dollars, thus providing stability. Nevertheless, a cautious outlook dampened the euphoria: management referred to negative currency effects and the threat of import duties amounting to around 900 million US dollars, which unsettled investors.

Apple shares opened with a moderate down-gap on Friday, but stabilized over the course of the day.
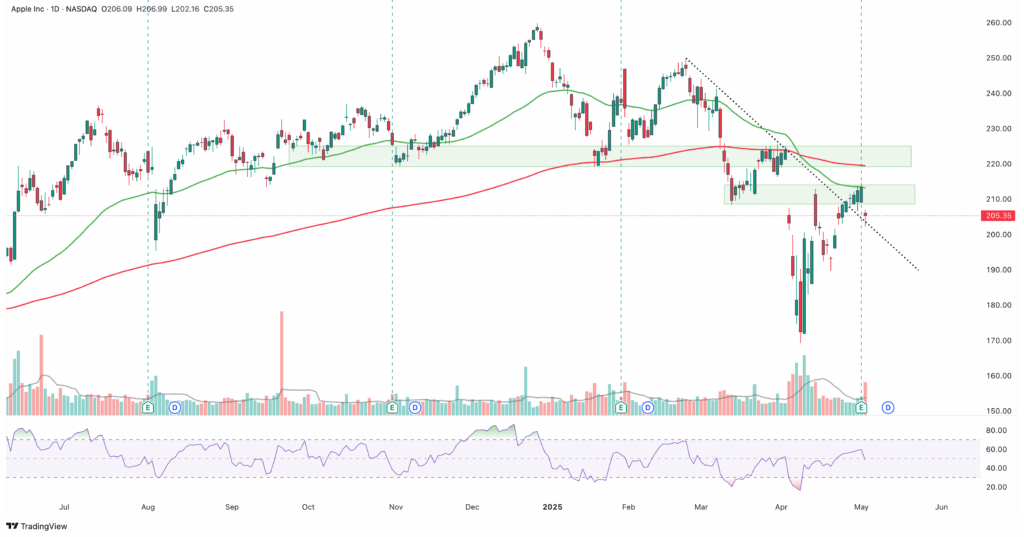
A stock chart of Apple Inc (AAPL) shows price action, volume bars, moving averages, RSI and support/resistance zones from July 2024 to May 2025.

Amazon beats expectations

In addition to Apple, Amazon's earnings were also on the agenda on Thursday evening. Amazon shares already showed strength on Thursday and more or less stood still on Friday. However, the figures presented were quite strong with sales of USD 155.7 billion and earnings per share of USD 1.59 - both above expectations. The cloud division AWS grew by 17 percent, but fell slightly short of analysts' expectations. On the other hand, the advertising business and Prime integration in e-commerce stood out positively. However, Amazon issued a cautious outlook for the coming quarter, citing rising logistics costs and potential risks due to the trade dispute.
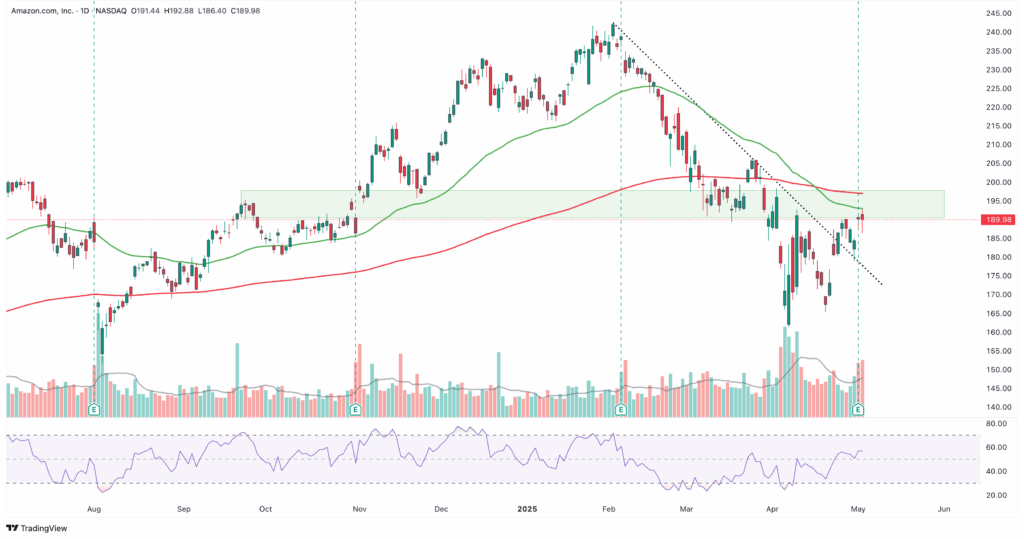
A candlestick chart shows the development of the Amazon share price with moving averages, trading volume, RSI indicator and marked support and resistance zones from August 2023 to May 2024.
Amazon share daily chart

US labor market remains robust

Another important event that was the focus of attention last week and created a positive mood was the labor market report (Non Farm Payrolls) published on Friday, which significantly exceeded market expectations: 177,000 new jobs were created in April, while analysts had only expected around 138,000 on average. The unemployment rate remained at 4.2 %, which is close to the cyclical low. This continues the trend of a robust but moderately cooling labor market that has been observed for months. 

On the markets, the combination of solid job momentum and moderate wage growth provided relief: the yield on 10-year US Treasuries briefly rose to 4.28 % as the probability of a Fed rate cut in June fell from 58 % to 40 %. At the same time, S&P 500 and Nasdaq 100 futures climbed by around 0.9 %, adding to the positive news flow from the tech reporting season. For the Nasdaq 100, the robust labor market means a tailwind for the time being as economic concerns recede into the background, while the prospect of a continued data-driven Fed makes interest rates - and thus the valuation models for high-growth tech stocks - more predictable.

Nasdaq 100: Technical outlook

As you can see on the following daily chart, the Nasdaq 100 has risen significantly in the last two weeks and is now back above the daily EMA-200 and just below the daily SMA-200 at 20,103 points. As the index is overbought in the short term and is directly in front of a resistance area, a correction in the coming days would be a logical consequence. However, due to the extremely strong performance of the last few days, the strength of the market breadth, the strong earnings season and the resolution of the trade dispute, the chances of further gains in the coming weeks are good. If the Nasdaq 100 manages to break above the resistance at 20,200 - 20,300 points, the technical picture would also brighten considerably and clear the way to the old all-time highs at 22,200 points.
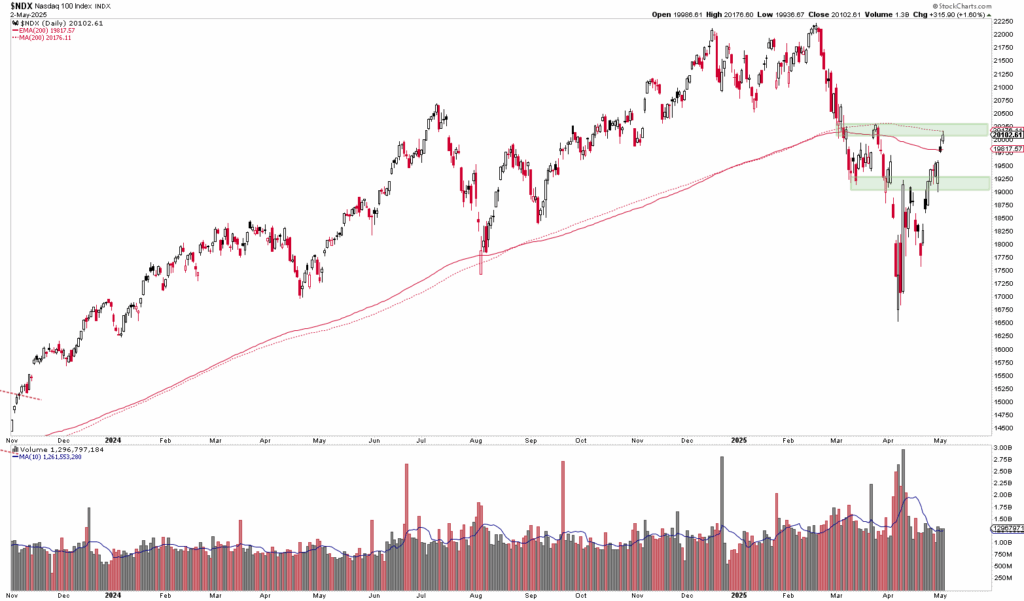
Stock price chart showing a sharp decline followed by a partial recovery, with two moving averages and highlighted resistance areas and trading volume bars below.
Nasdaq 100 Index daily chart

Author: Tobias Schmid
Date: 05.05.2025

A man with slicked-back hair and a trimmed beard, wearing a navy blue suit jacket and a white shirt, looks into the camera with a slight smile. Industrial background.
Tobias Schmid

Tobias Schmid has been a trader and analyst since 2008 and specializes in trading futures options and equity options. His strategies and analysis methods are based on a combination of technical analysis, intermarket analysis and sentiment analysis. Tobias Schmid is also the founder of Fomo Financea financial website for active traders, investors and options traders.

Mandatory information and disclaimer

This is a marketing communication within the meaning of Section 63 (6) of the German Securities Trading Act and does not contain investment strategy recommendations, investment recommendations or financial analyses in accordance with Section 85 of the German Securities Trading Act and Article 20 of the Market Abuse Regulation. It therefore does not fulfill the legal requirements to guarantee the objectivity of investment strategy recommendations/investment recommendations/financial analyses. CapTrader GmbH or its employees are therefore not legally prohibited from trading or providing services in the securities products mentioned therein prior to publication of the information.

Past performance, simulations or forecasts are not a reliable indicator of future performance. Mandatory information and limitation of liability for CapTrader and any third-party content providers can be found at https://www.captrader.com/marketingmitteilung/angaben
Please note that investing in financial instruments involves high risks and take note of our disclaimer and the mandatory legal information at the locations indicated.

  1. Mandatory information

Responsible: CapTrader GmbH, Elberfelder Straße 2, 40213 Düsseldorf; Commercial Register Number: HRB 86537 Düsseldorf Local Court; VAT ID DE323771603; Managing Directors Andreas Weiß, Christian Weiß, Michael Heyder; Tel: +49 211-740786-00, Fax: +49 211-740786-90.

Zuständige Aufsichtsbehörde: Bundesanstalt für Finanzdienstleistungsaufsicht, Graurheindorfer Straße 108, D – 53117 Bonn und Marie-Curie-Str. 24-28 D – 60439 Frankfurt am Main, Tel: 0228 4108 – 0 Fax: 0228 4108 1550 E-Mail: poststelle@bafin.de; Institutsnummer 10156708

Conflicts of interest CapTrader in marketing communications: CapTrader GmbH confirms that it does not hold any positions in the mentioned financial instruments beyond the positions mentioned in the marketing communication itself, if applicable. There are also no other conflicts of interest within the meaning of CapTrader GmbH's Financial Analysis and Marketing Communication Policy.

Conflicts of interest and mandatory disclosures by the third-party content provider for marketing communications with financial instrument recommendations: See under https://www.captrader.com/marketingmitteilung/angaben  to creators of third-party content

The copyright to the marketing communication is reserved. Reprinting and distribution is only permitted with our consent.

  1. Disclaimer

By accepting the content, the recipient accepts the binding nature of the limitation of liability.

a) Disclaimer for third-party content

CapTrader GmbH offers authors - such as editors, guest commentators, agencies and companies - the opportunity to publish comments, analyses, news and company announcements. Their opinions do not necessarily reflect the opinions and views of CapTrader GmbH and its employees. CapTrader GmbH assumes neither liability nor guarantee for this content. This applies in particular to incomplete or incorrectly reproduced reports, incorrect price information and editorial errors. Liability claims relating to material or immaterial damage caused by the use or non-use of the published information or by the use of incorrect or incomplete information are fundamentally excluded.

b) Exclusion of liability for CapTrader's own content

CapTrader has taken its own information in this marketing communication from sources believed to be reliable, but has not verified all such information itself. Accordingly, CapTrader makes no warranties or representations as to the accuracy, completeness or correctness of the information or opinions contained herein. Subsequent changes cannot be taken into account. The marketing communication does not constitute an offer or solicitation to buy shares of the issuer and is in no way a substitute for advice appropriate to the investor and the property. We cannot verify whether the information in the marketing communication is in line with your personal investment strategies and objectives. We recommend that you consult an investment advisor for advice that is appropriate to the investor and the property. The marketing communication cannot and should not replace a securities prospectus and/or expert investment advice required for an investment. It can therefore never be the sole basis for an investment decision. By accepting the marketing communication, the recipient accepts the binding nature of the above limitation of liability.

CapTrader provides the information despite careful procurement and provision only without guarantee for the correctness / completeness, timeliness or accuracy and availability of the stock exchange and economic information, prices, rates, indices, general market data, valuations, assessments and other accessible content held and displayed for retrieval. This also applies to third-party content. Historical observations and forecasts are not a reliable indicator of future developments. The facts presented in particular in connection with product information are for illustrative purposes only and do not permit any statements to be made about future profits or losses. Any conditions stated are to be understood as non-binding indications and are dependent on market developments on the day of conclusion.

CapTrader accepts no liability for any direct or indirect damage caused by and/or related to the distribution and/or use of this marketing communication.

The information, opinions and statements correspond to the status at the time of preparation of the marketing communication. They may be outdated due to future developments without the publication being changed.

CapTrader is not obliged to update, amend or supplement the information in this marketing communication if a circumstance mentioned in this publication or a statement, estimate or forecast contained therein changes or becomes inaccurate. The presentation of the performance of financial instruments over previous periods does not provide a reliable indication of their future performance. No guarantee can therefore be given for the future price, value or income of any financial instrument mentioned in this publication.

Despite careful control of the content, we assume no liability for the content of external links. The operators of the linked pages are solely responsible for their content.

Distribution: This publication may only be distributed in accordance with the laws of the respective countries, and persons in possession of this publication should inform themselves about the applicable local regulations. The information contained herein is not intended for natural or legal persons who, due to their place of residence or business, are subject to a foreign legal system that imposes restrictions on the distribution of such information. The contents are therefore exclusively in German. In particular, this publication contains neither an offer nor an invitation to purchase securities to citizens of the USA, Great Britain and Australia.

Taxes: The tax treatment of financial instruments depends on the personal circumstances of the respective investor and may be subject to future changes, which may also have a retroactive effect.

Historical observations and forecasts are not a reliable indicator of future developments. The facts presented in particular in connection with product information are for illustrative purposes only and do not permit any statements to be made about future profits or losses. Any conditions stated are to be understood as non-binding indications and are dependent on market developments on the day of conclusion.

CapTrader accepts no liability for direct or indirect damage caused by and/or in connection with the distribution and/or use.

The information, opinions and statements correspond to the status at the time of preparation of the marketing communication. They may be outdated due to future developments without the publication being changed.

CapTrader is not obliged to update, amend or supplement the information if a circumstance mentioned in this publication or a statement, estimate or forecast contained therein changes or becomes inaccurate. The presentation of the performance of financial instruments over previous periods does not provide a reliable indication of their future performance. No guarantee can therefore be given for the future price, value or income of any financial instrument mentioned in this publication.

Despite careful control of the content, we assume no liability for the content of external links. The operators of the linked pages are solely responsible for their content.

Distribution: This publication may only be distributed in accordance with the laws of the respective countries, and persons in possession of this publication should inform themselves about the applicable local regulations. The information contained herein is not intended for natural or legal persons who, due to their place of residence or business, are subject to a foreign legal system that imposes restrictions on the distribution of such information. The contents are therefore exclusively in German. In particular, this publication contains neither an offer nor an invitation to purchase securities to citizens of the USA, Great Britain and Australia.

Taxes: The tax treatment of financial instruments depends on the personal circumstances of the respective investor and may be subject to future changes, which may also have a retroactive effect.

Email:

info@captrader.com

Send e-mail

Phone:

Hotline (Germany)
0800-8723370

Hotline (International)
00800-08723370

Further contact options