



The most important in a nutshell
- Comcast is a broad-based and vertically diversified company that generates solid revenues in various parts of the telecommunications value chain
- The existing business in the broadband segment provides reliable cash flows that simultaneously enable investment in new growth areas and a very attractive capital allocation
- Since dividend payments began in 2007, they have been increased every year. In contrast to its competitors, the management buys back a lot of its own shares
- At a historically low price level, the telco has achieved an extremely favorable valuation, with the prospect of considerable upside potential over a medium to long-term investment horizon
- Click here for the DGI model portfolioand here to the overview of this series The dividend custody account
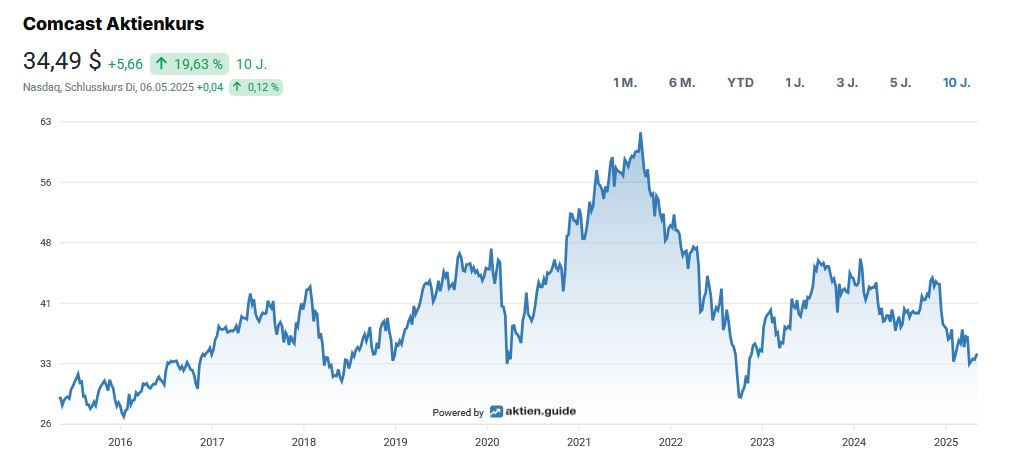
Company profile and business model: Who is Comcast and what does it do?
Since 1969, the telecommunications group has been operating under the name Comcast Corporationbefore going public a short time later in 1972. The company, which specialized in cable television at the time and had previously been known as American Cable Systems, made a large number of acquisitions in the following decades and participated as a co-founder in various joint ventures. Of particular note here is the entry into the Mobile communications business with the purchase of American Cellular Network (1988). With the increasing popularity of the Internet, the classic Triple-play offer from telco providers: cable, telephone and Internet connection as a combinable service offer for customers.
As if that were not enough, Comcast took over the largest cable television provider AT&T Broadband in 2001 for the impressive sum of USD 44.5 billion and became the largest provider of cable television in the US. The noughties were characterized by major coups and hopes of growth-accelerating mergers - accompanied by the odd disillusionment. An excerpt from this: In 2004, Comcast actually wanted to Walt Disney The acquisition famously fell through. The management proved to have a luckier hand with the acquisition of NBC Universal. The rather complex transaction, which lasted from 2009 until the final closing in 2013, was successfully completed via ties with the original owner, the industrial conglomerate General Electric. With the acquisition, Comcast not only complemented its range of TV channels (including National Broadcasting Company (NBC)) and powerful film studios (e.g. Universal Pictures), but also became the third-largest provider of entertainment and theme parks.
However, there were other acquisition targets on the management's shopping list. In retrospect, the planned takeover of Time Warner Cablewhich later went to competitor AT&T for just under USD 85 billion, was primarily due to the antitrust concerns of the Federal Department of Justice about the deal, which were fueled by competitors such as Netflix, DirectTV and Charter Communications. Less than three years later, in 2017, Comcast launched an attempt to take over 21st Century Fox. However, Walt Disney won the race. However, the failed deal resulted in something else positive for Comcast. Disney divested itself of some assets, including the 39% stake in Sky plc held via Fox. Comcast took over the entire British group shortly afterwards.
Since 2018, Sky has been a subsidiary of Comcast that now operates outside North America in Great Britain gained a foothold. With around 23 million subscribers, Sky can be described as the largest pay-TV broadcaster in Europe with offerings in the UK, Germany, Italy, Austria, Ireland and Switzerland (Sky Ticket). The majority of Sky's revenue is generated in the UK.
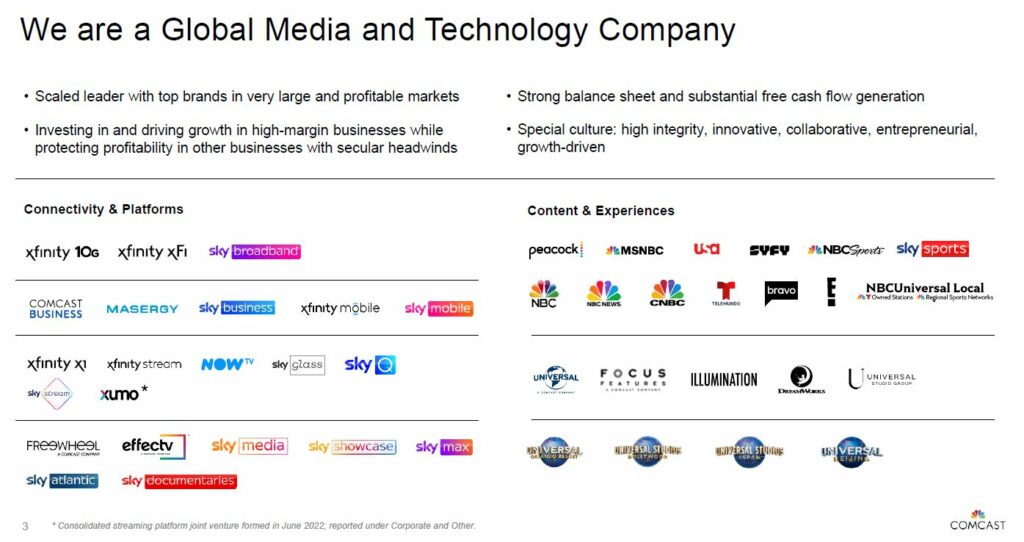
Today, Comcast is a global media and technology group that operates in the business model different broadband, television, telephone and streaming services for 51.6 million customers in the USA and Europe. Its broadband, wireless and video services include Xfinity, Comcast Business and Sky Brandsthe media empire are among the better-known names Universal, Sky Studios, NBC, Telemundo and Peacock Streaming. Comcast has a number of assets worthy of being characterized as a moat. Not the least of which is its historic Internet broadband presence, which reaches just over half (51 percent) of American households.
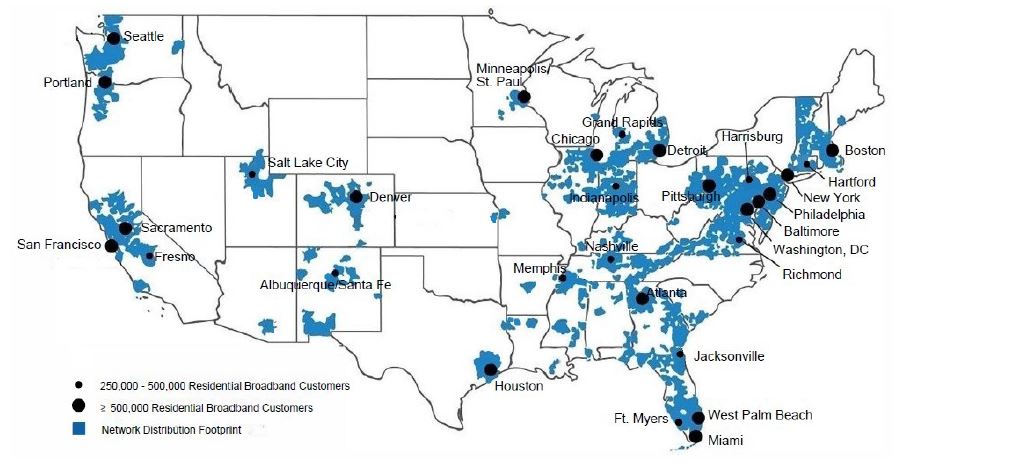
The company is currently the second largest broadcasting and cable television provider in the world in terms of revenue, only behind AT&T. It is also the largest pay-TV provider, the largest cable TV provider, the largest Internet provider in the USA and the third-largest provider of residential telephone services. Comcast provides its services to customers in 40 states the USA.
Most households in the U.S. today can get landline Internet access service from only two providers: the traditional cable or phone company. Comcast and Charter Communications (CHTR) together serve 200 million people in the United States. The overlap between the two companies adds up to less than two million people served by both companies.
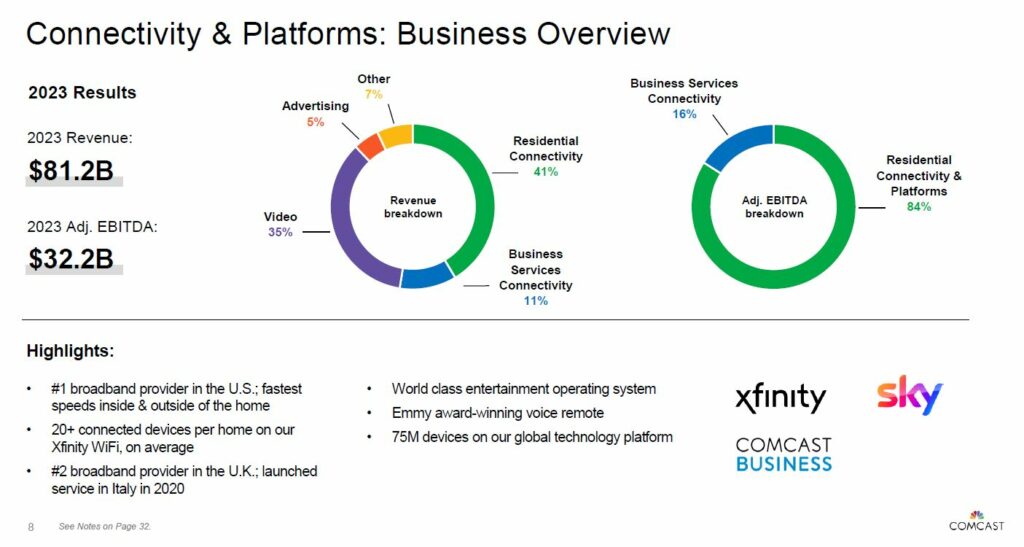
Comcast is over Universal Pictures is also active in film production. This is relevant for its own distribution of media content, as the launch of its own streaming service Peacock this content can be utilized itself. Peacock has increased its paid subscriber numbers by almost 20% year-on-year and is gradually gaining market share with a total of over 41 million customers (Q1 2025). Finally, the company is the owner of Universal Parks & Resortswhich includes the theme parks.

I would also like to mention the participation in the streaming service Huluwhich accounts for around one third. Disney holds the majority stake in Hulu. Hulu has around 50 million streaming subscribers and offers a large selection of current series, films, TV shows and even live TV. Interesting detail in passing: the CEO Daniel Loeb of the hedge fund Third Point already made in the The past Disney's management to buy the stake from Comcast. The contractually guaranteed minimum value of Comcast's Hulu stake is approximately USD 9.1 billion. Analysts estimate the value of Comcast's Hulu stake at USD 9 to 13 billion. The question remains as to what extent Hulu's massive subscriber growth has affected the valuation.
Comcast's management has repeatedly affirmed that its primary focus is on the Wireless business as the means with the greatest leverage to reduce customer churn for broadband connections. Lower profitability and the associated loss of profitability are accepted, as competition in the broadband sector is constantly increasing. Xfinity Mobilewhich is based on the mobile network of Verizon together with the streaming service Peacock, will enjoy strategic importance as potent profit centers in the future.
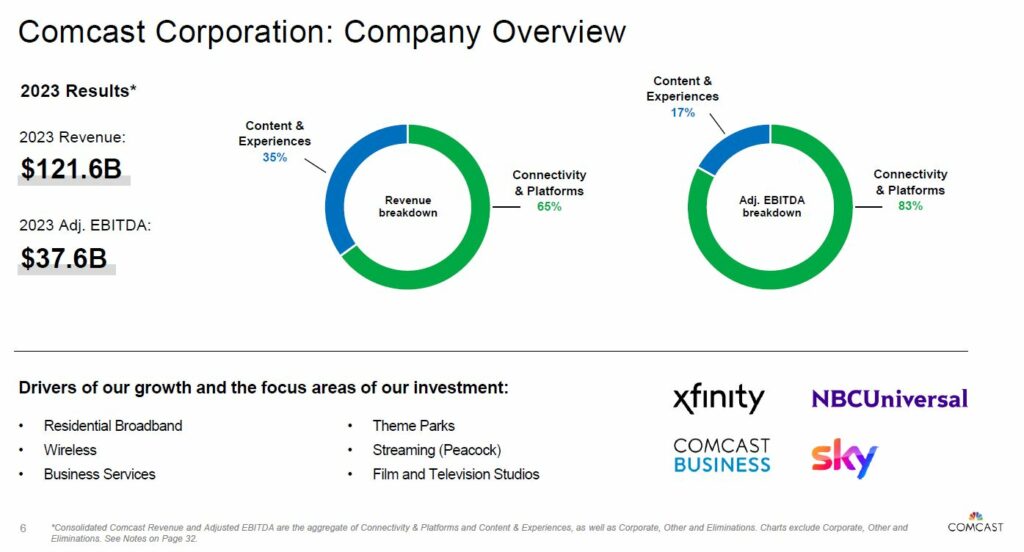
In the last November Comcast management announced a plan to spin off NBCUniversal's portfolio of cable television channels and take it public as a separate company ("SpinCo"). This new company will cover news, sports and entertainment content (including USA Network, CNBC, MSNBC, Oxygen, E!, SYFY, Golf Channel) and potentially reach 70 million households in the US. The transaction is expected to be completed in approximately one year. Based on the last financial year, the division to be spun off generated revenues of around USD 7 billion. SpinCo will have the same two-class share structure as Comcast. Finally, a quick look at the Geographical distribution of the revenues. 78 percent of Comcast's revenue is attributable to the United States, 12 percent Great Britain and ten percent is attributable to all other international markets.

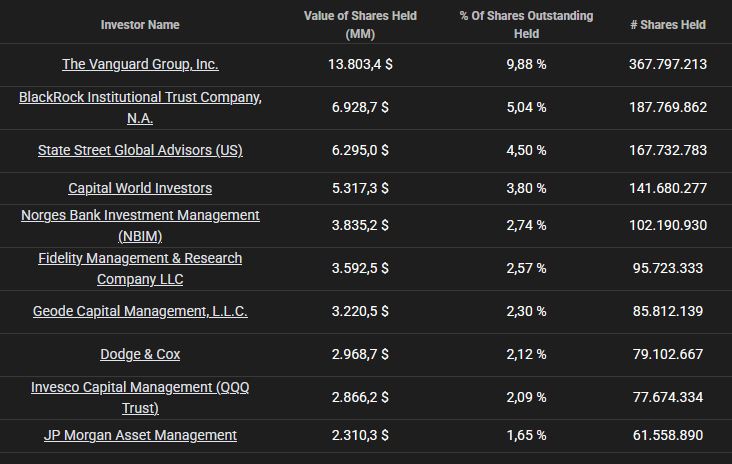
At the ownership structure of Comcast, two points stand out. On the one hand, the company has a very high proportion of Institutional investors out. This amounts to over 87 percent. On the other hand, the long-standing Chief Executive Officer Brian L. Roberts, who has held the reins since 1990, owns only 0.7 percent of the shares, but all voting Class B shares, which gives him a non-dilutable voting power of 33 percent over the company.
Industry profile and competitive situation
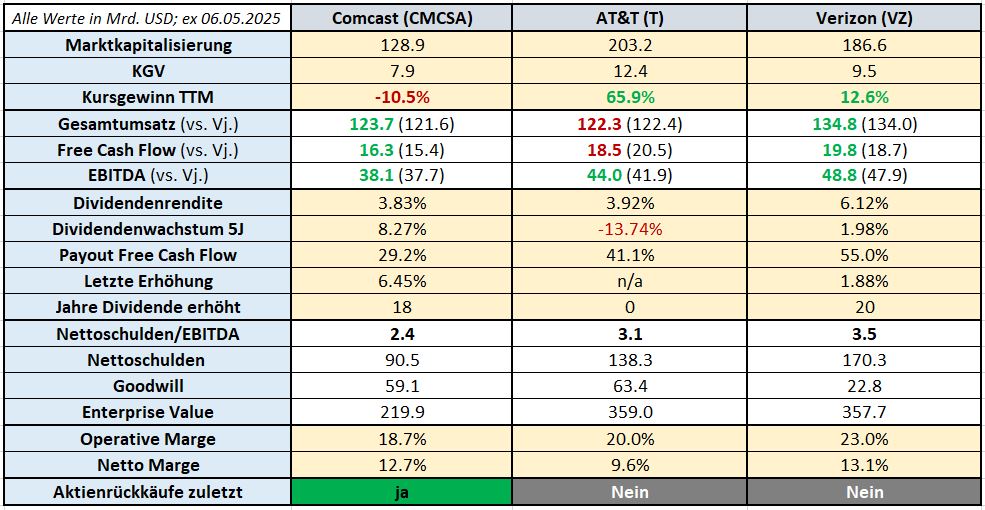
The characteristics of Comcast's business model shape the Comparison with listed competitors practicable at the overall Group level. The peer group is made up of the two major competitors AT&T and Verizon Communications. As the revenue share for the media business and theme parks does not dominate, I have not included other players from this segment such as Walt Disney, Charter Communications or Warner Bros. Discovery. In any case, you can form your own opinion based on the evaluated fundamental data of Comcast and possibly continue this on the basis of a segment-by-segment comparison with the leading companies in each division.
The Comcast financial picture
After gaining an overview of the industry in general and taking a closer look at the company, management and competition, we take a look at Comcast's balance sheet and the key financial figures derived from it. The focus here is on the following aspects Growth, profitability and the Financing.
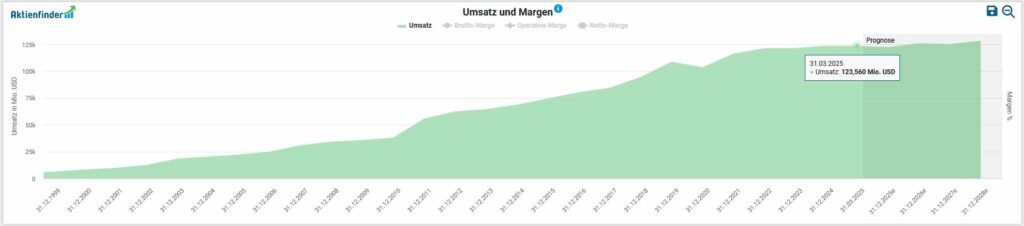
To analyze the financial situation, the first step is to look at the development of sales, profit and free cash flow. I have already discussed the internal distribution of turnover by segment in the chapter on the business model above. On average, the top line has grown over the last five years by 3.2 percent p.a.
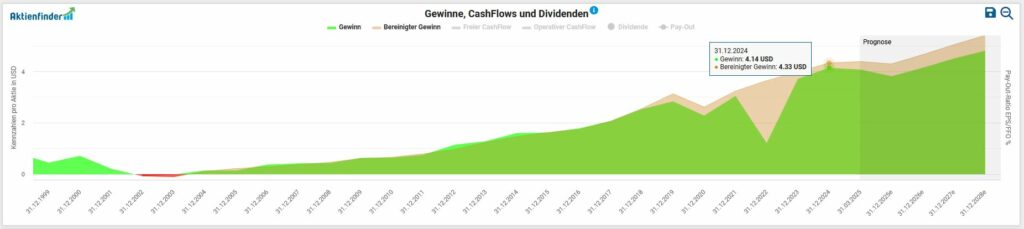
The (adjusted) Earnings per share we have seen a moderate upward trend for ten years. If we look at the past financial year 2024, the Adjusted earnings per share at 8.8 percent (USD 4.33 vs. USD 3.98). In the past financial year, Comcast generated a Net profit from over USD 16.2 billion.
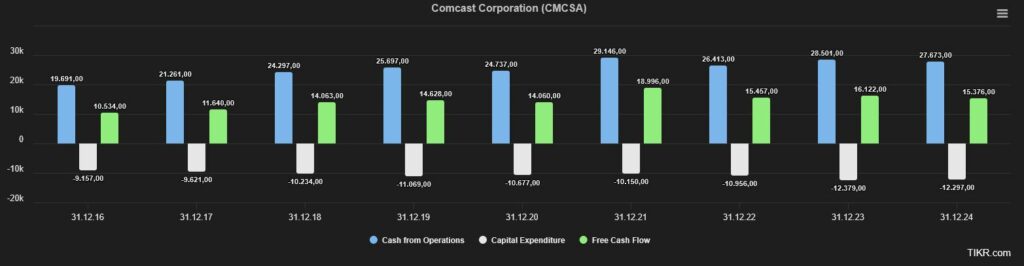
The amount available to the company Free Cash-Flow can be used for capital investments in organic growth, research and development, repayment of debt, expansion via company acquisitions, distributions of (increasing) dividends or share buybacks. In absolute figures - which I primarily like to use - the picture of operating and free cash flow as well as capital investments (CapEx) for the period 2016 to 2024 is as follows:
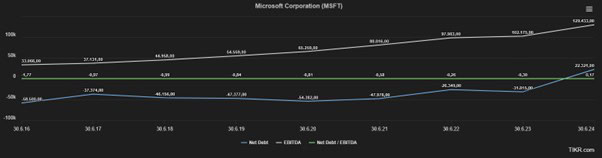
A look at the Debt situation tells us that, based on the last financial year, Comcast has interest-bearing financial liabilities of USD 99.1 billion, which in turn is offset by cash and cash equivalents and securities totaling USD 8.6 billion. If we now divide the remaining net debt of USD 90.5 billion by the most recently generated EBITDA of USD 38.3 billion, the result is 2.4, which is below the critical threshold of 3.
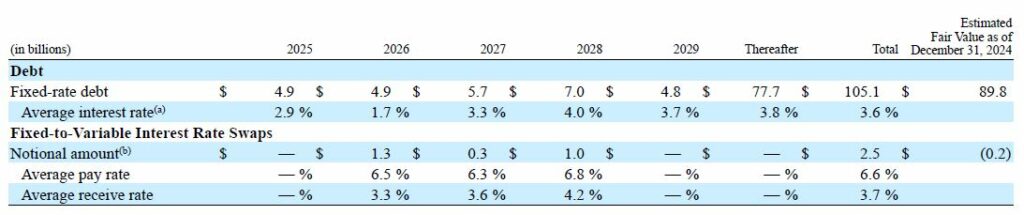
Around the topic Indebtedness and External financing it makes sense to look at the Interest profile and the Maturity structure of current liabilities. Finally, it is important to assess how vulnerable the company appears to be to the persistently high key interest rates and to what extent new financing or rescheduling of existing debt will be necessary in the near future. Up to End of 2029 a total of USD 27.3 billion of the non-current liabilities will fall due.
In the case of Comcast, I would like to briefly mention the relatively high balance sheet item Goodwill enter into. In German as Goodwill Goodwill is defined as intangible assets in the company that arise from the acquisition of other companies or investments. At Comcast, goodwill amounted to USD 59.1 billion as at the end of the 2024 financial year.
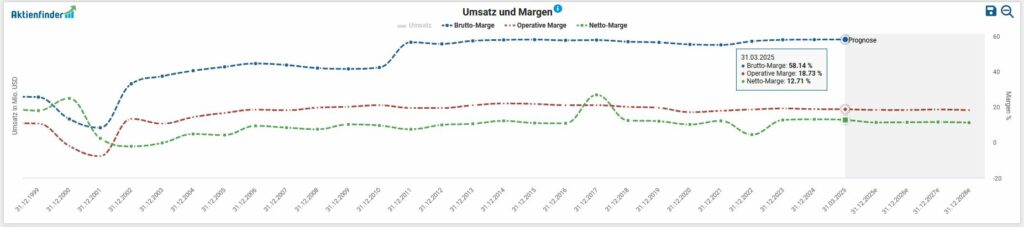
Finally, we look at the Profitability of Comcast based on the development of gross, operating and net margins. Here, too, a fundamentally positive or stable trend can be seen in the historical development.
Opportunities & risks
Comcast's existing business delivers reliable cash flows that simultaneously allow the company to invest in new product innovations and media content, allocate capital in an owner-friendly manner and reduce debt in a disciplined manner. Since October 2023, the company has been expanding its hybrid fiber offering to more households in the US via DOCSIS 4.0 technology, which should strengthen competitiveness due to low implementation costs.
In some regions of the United States, Comcast's business presence has monopolistic characteristics, where the Group can exploit the full potential of the network effects of its service portfolio. The combination of television, film, streaming, broadband, wireless and theme parks forms a globally positioned communications giant with a broadly diversified business model.
Nevertheless, there is high competitive pressure in all these segments. Comcast's growth in mobile telephony is currently not compensating for the decline in sales that the cable provider is experiencing due to losses in other areas of its core business.
In times of high price inflation (such as 2022), there is a risk that consumers will limit their discretionary spending on entertainment (including theme parks) when budgets are tight. Any (expensive) exclusive contracts for sports content, such as with the Premier League in English soccer, generate lower revenues due to reduced advertising budgets on the part of customers on the one hand and reduced reach (subscription cancellations) on the other.
The balance sheet share of goodwill amounting to almost USD 60 billion in intangible assets (built up through acquisitions and capitalized assets, among other things) are potential amortization items on the equity side. The negative effects resulting from extraordinary goodwill amortization (impairments) are not to be dismissed out of hand for the company's creditworthiness. Finally, the media segment is characterized by a permanent struggle for consumer time in the competition between numerous providers ("streaming wars"). The upside potential in the fee model is limited by relatively high price sensitivity.
Current valuation of the Comcast share
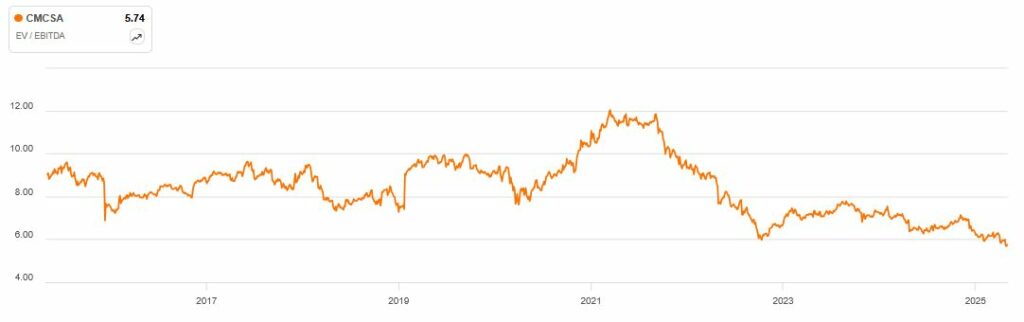
For the valuation of companies, I use the so-called Enterprise Value (EV) is used. In the case of a takeover, the EV indicates the amount required to purchase the assets required for operations and excludes the non-operating assets. I relate this key figure to operating profitability (before interest, taxes and investments (CAPEX)), expressed as EBITDA. The prevailing opinion is that a value of less than 10 indicates a „healthy valuation“ - as is always the case with generic Rules of thumb the company-specific context must be considered in the analysis by the careful investor himself. In the case of Comcast, we see the Valuation result of 5.7 a historically favorable multiple:
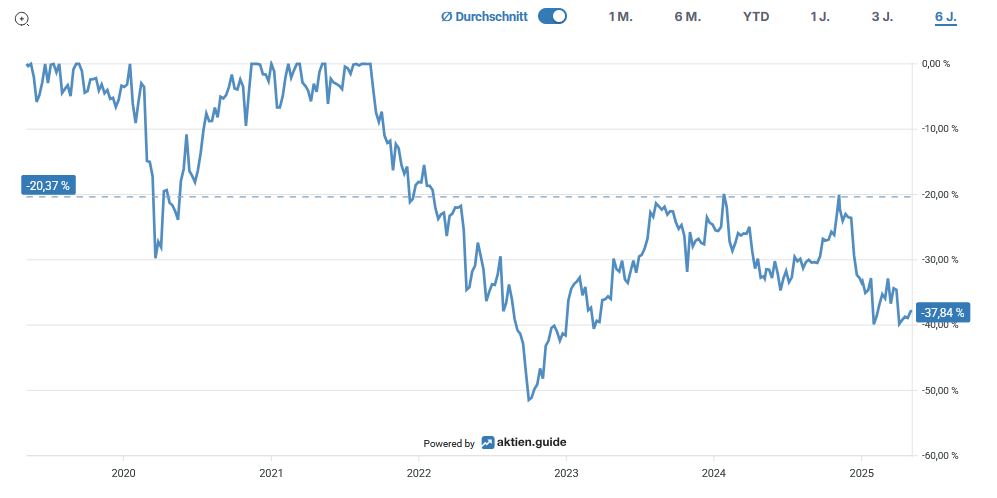
The Maximum decrease in the last six years amounted to approx. 51 percent in the bear market year 2022:
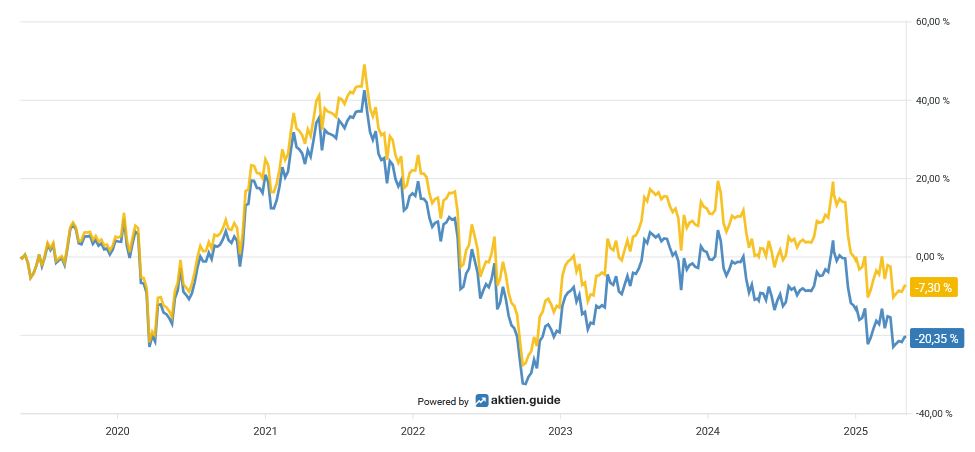
Over the past six years, an investment in Comcast has yielded Total Return, including dividends received, a negative Overall performance from 7.3 percent for the investor, which underlines the challenging situation for established telcos within the industry:
Capital allocation of Comcast
Since meanwhile 18 years Comcast pays an annually higher dividend to its shareholders. This means that the telecommunications group is a so-called Dividend Contenderwhich increase the dividend between 10 and 24 years.
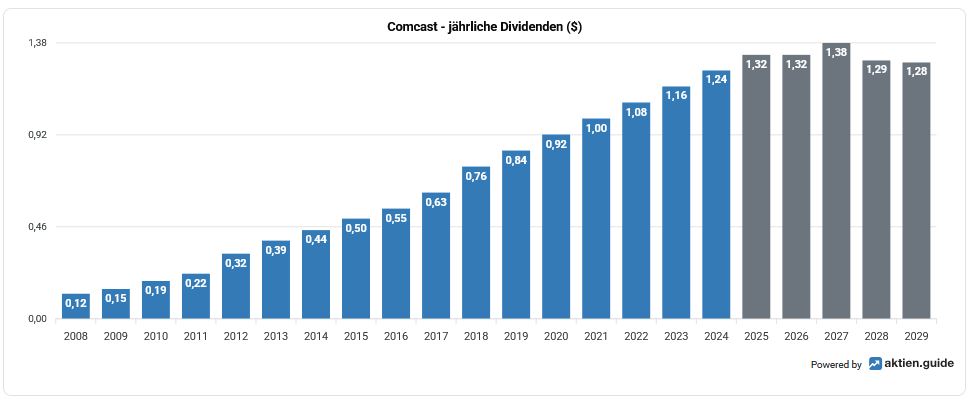
At the current share price of USD 34.46, this results in a Dividend yield from 3.8 percent. The Five-year dividend growth rate amounts to 8.3 percent p.a. or 10.9 percent p.a. in the Ten-year period. The company last increased its dividend by 6.5% this January. To round things off, here is an overview of the last five dividend increases:
- 2024: +6,9 %
- 2023: +7,4 %
- 2022: 8 %
- 2021: 8,70 %
- 2020: 9,52 %
The quartalsweise ausgeschüttete Dividende currently amounts to USD 0.33 per share and is paid out at the beginning of each quarter (January, April, July, October).
If we take the average value of the Free Cash Flow of the last three years as the basis for determining the Payout ratio we end up with a comfortable result of 34 percent for the payout ratio of Comcast.
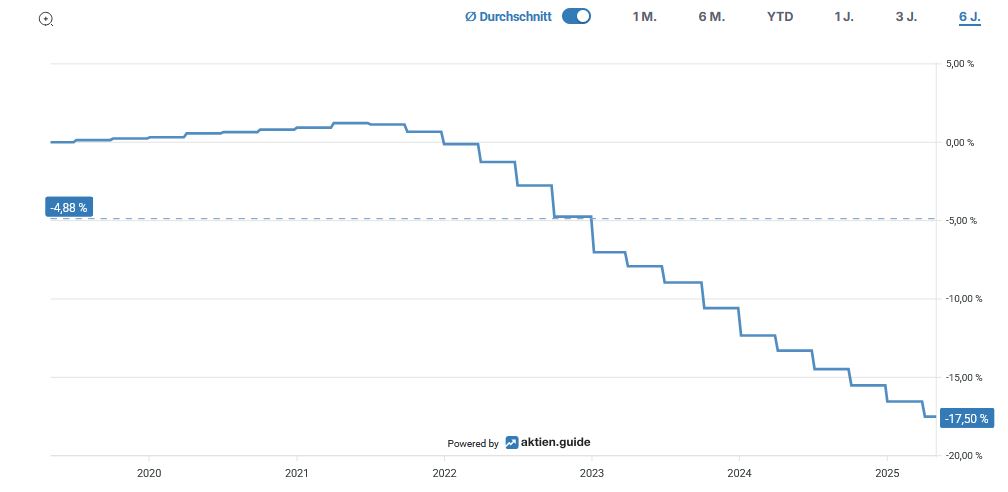
Over the past six years, the Number of shares outstanding added together by 17.5 percent reduction:
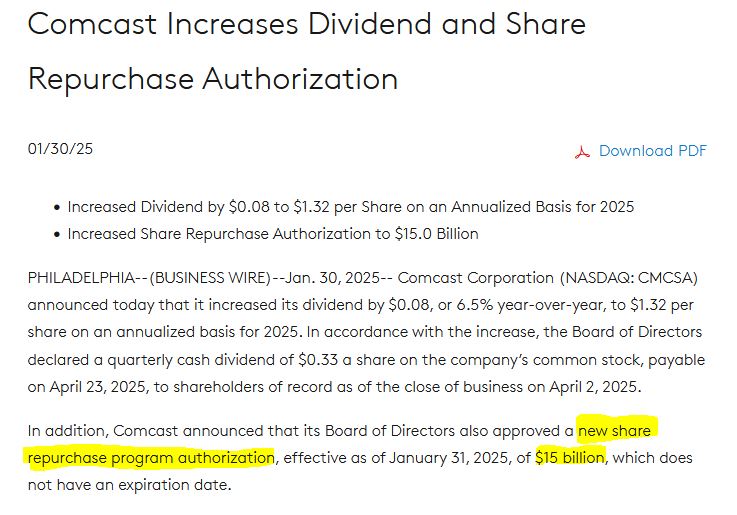
Together with the recent dividend increase, the company recently announced that the management had been authorized to buy back treasury shares in the amount of USD 15 billion was issued:
Conclusion: Considerations for my decision to invest in Comcast
Comcast is a broad-based and well-diversified company that currently generates revenues in various industries such as cable TV, pay TV, film, streaming, broadband, wireless and theme parks. In some US regions, Comcast has monopolistic tendencies and can fully exploit the economies of scale and network effects of its broad service portfolio in these areas. What should not be overlooked are the enormous initial capital investments required to seriously compete with the established telcos, even though sales in this segment are stagnating.
Comcast has been in the process of expanding its hybrid fiber optic offering via DOCSIS 4.0 technology since 2023, with the aim of improving the communications group's competitiveness in the customer-relevant areas of network quality and Internet speed. Furthermore, the aim is to offer US households an attractive proposition, as the implementation costs for this upgrade are comparatively low (approx. USD 200 per household) when using existing cable connections.
At a historically low price level, the telecommunications group, which intends to become leaner in the future with the spin-off of cable television, has reached an extremely attractive valuation level. In view of this low market valuation and its solid positioning within the industry, Comcast shares offer considerable catch-up potential with a medium to long-term investment horizon.

