


Chart patterns are visual images in price charts of securities that help us to predict the future direction with a certain probability. Historically, chart patterns have arisen because we humans "want" to see repeating patterns in many objects.

The most important in a nutshell
- Chart formations are repeating patterns in price charts that are based on real objects such as flags.
- A distinction is made between trend continuation patterns and trend reversal patterns.
- The best patterns are the flags and the shoulder-head-shoulder (SKS) formation.
- All chart formations are available as bullish and bearish variants, i.e. for rising and falling prices.
Chart formations Classification
In charting, chart formations are an integral part of almost every analysis. In general, you can distinguish between two types of chart formations: Formations for a continuation of a trend and formations that indicate a reversal of the current trend.
It is important to know that there is no formation that is correct at 100%! In other words, there is no formation that always reverses or continues a trend when it appears. Rather, you should only consider a chart formation as an admixture when creating a trading plan based on technical analysis.
Chart formations are a dime a dozen. Especially as a trading beginner, you can be overwhelmed by the large number. In practice, I personally only use a handful of chart patterns, which I have outlined for you in the chart:

Formations in Kurscharts work in all time units and in all different assets. This means that it doesn't matter whether you are analyzing the DAX minute chart or the Apple monthly chart - you can search for and observe chart formations at any time.
Good to know: In technical analysis, larger time units have more "power" than smaller ones. So if you see a formation in the daily chart, it is more meaningful than a formation in the minute chart.
Trend continuation formations
The best-known patterns that indicate a continuation of the existing trend are flag formations, triangles, trend channels and the rectangle formation. The best chart formation for trend following is the flag, closely followed by triangles.
In order to better understand the trend formation, it is important to know the structure of a trend. For example, an upward trend consists of the alternation between an upward thrust (=impulse) and a setback (=correction).
The flag pattern as the strongest trend pattern is structured as follows: The price initially starts with a strong upward movement, which forms the so-called flag pole. The price then falls back a little and forms the flag before resuming its original strength. The pattern of upward thrust + setback should now look familiar to you:
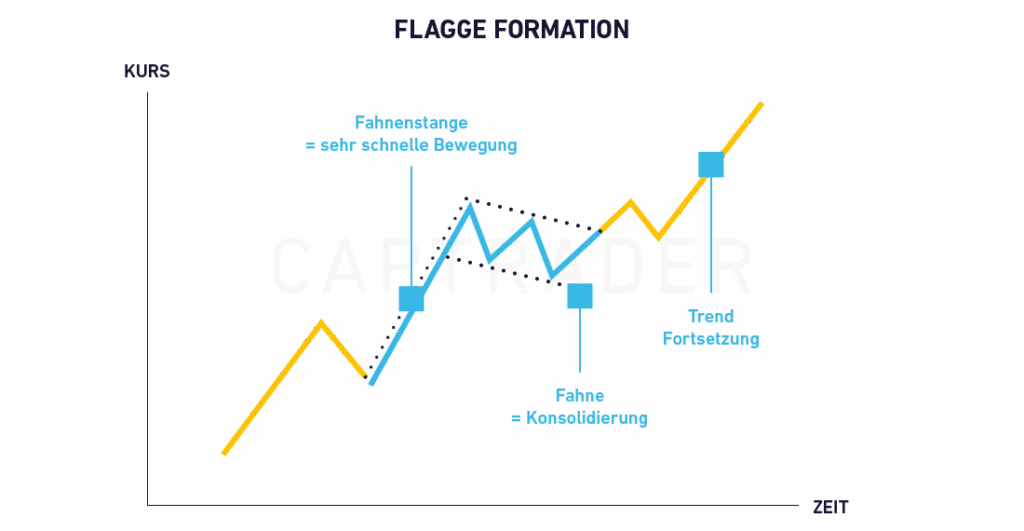
The flag formation in the chart indicates a rising price, which is why it is also referred to as a "bull flag". You can apply the opposite logic to the so-called "bear flag", which consists of a strong price drop (= flagpole) and a small rebound (= flag).
Interpretation of strength: The flag formation is the best trend formation, as it is by definition part of a trend! After all, it consists of an impulse and a corresponding setback.
Trend reversal formation
Trend reversal formations are characterized by the fact that they end an existing trend and start in the opposite direction. If you recognize such a pattern in practice, there is a good chance that, for example, an upward trend will end and a new downward trend will start. There are actually more reversal formations than trend-following formations.
Popular reversal patterns are the double and triple bottom, the shoulder-head-shoulder formation (SKS) and the broadening formation. The cup formation is rarely seen in practice. The strongest of the formations mentioned is the shoulder-head formation.
The SKS formation is strongly based on the image of a human and consists of 3 highs, with the middle one being the highest and representing the "head". To the left and right of this are the "shoulders", each of which is separated from the head by an intermediate low. If you connect the two low points with a trend line, you get the so-called "neck line".

The shoulder head formation reverses a bullish trend into a bearish trend. The counterpart is the "inverse shoulder head formation", which reverses a downward trend into an upward trend. A trading signal is generated for both formations when the neckline is crossed.
Practice trading with chart formations
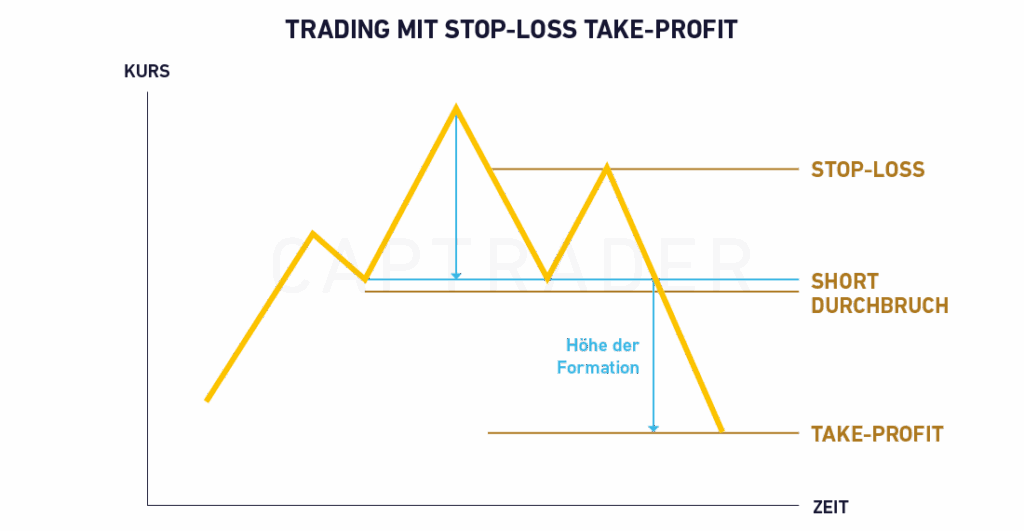
Chart formations not only give a forecast for the future price direction, but also provide technical stop-loss and take-profit levels. A trading signal in the sense of a pattern always arises when the price breaks out of that formation.
In the case of the shoulder to shoulder formation, as already explained, it is a breakout through the neckline. With triangles, on the other hand, it is the breakout from the limiting trend lines. In a flag formation, a firm signal is generated when the flag breaks out.
A technical price target (=take profit level) is typically calculated as follows: You measure the height of the formation and place this length at the breakout point of the chart formation. In the case of an SKS formation, for example, you measure the distance between the neckline and the head of the formation.
A stop-loss can be placed on the opposite side of the breakout direction. In practice, when placing a stop-loss order, I always ask myself the question "At what price level would the formation no longer be considered broken out?" - A sensible stop loss is placed at this level.
Tip from the field: Trading is risky and most traders lose their money. You can protect your capital by setting a stop loss. The chart technique helps you to find good levels!
Conclusion: Useful tool with lots of practice!
Chart formations are a very useful tool in trading if they are used correctly! Most traders make the mistake of relying completely on a single formation. This is not advantageous, as the hit rates of formations are not even close to 100%. I would rather estimate around 55%.
For this reason, it makes sense to combine chart patterns with other tools such as a trading indicator. If both objects indicate the same direction, the probability of a forecast is significantly higher than if only one chart formation is considered.
There are around 20 chart formations in the literature. In practice, I usually only see around 8, of which the bull flag & bear flag and the shoulder head formation are the strongest patterns. The term "strength" refers to a relatively high probability of the forecast occurring.