



The most important in a nutshell
- Canadian National Railway operates a profitable and diversified business model in a moat-protected industry characterized by few competitors in North America
- The railroad company operates a unique route network that includes all major economic centers in Canada from the Atlantic to the Pacific and connections through the USA to the Gulf of Mexico
- Due to the enormous distances involved, railroads are key companies that form the backbone of functioning, cost-efficient supply chains in North America's transportation system
- Canadian National Railway places a high value on shareholder return. The company's capital allocation policy is clearly focused on the shareholder through an attractive track record of dividend growth and generous share buybacks
- Click here for the DGI model portfolio and here to the overview of this series The dividend custody account
Company profile and business model: Who is Canadian National Railway and what does it do?
The Canadian National Railway (CN) was founded in 1918 by the Canadian government to unite several bankrupt railroad companies, including the Grand Trunk Railway, the Intercolonial Railway and the Canadian Northern Railway, into a stable national network and to secure nationwide rail transportation in the interests of the Canadian economy.
Over the decades, CN developed into one of the most important railroad companies in the country. It was state-owned for a long time and played a central role in freight and passenger transportation in Canada. In the 1970s, however, passenger transportation was spun off and later taken over by VIA Rail adopted.
Until the 1980s, Canadian National Railway closed most of its financial years with a loss, with the exception of the Second World War period. This was partly due to political influence on the company in strategic matters, such as the operation of chronically financially loss-making branch lines. An important step towards better economic management was taken in 1978 with the recapitalization and repositioning of the company as a profit-making Crown Corporation.
The decisive turning point was 1995, when CN was fully liberalized as part of a comprehensive wave of privatization by the Canadian government. At the time, this was the largest IPO in Canadian history. CN then expanded strongly into the USA and became a North American logistics giant with a route network stretching from the Atlantic coast (Nova Scotia) to the Pacific coast (British Columbia). In the following ten years, the company expanded considerably in the United States and acquired the Illinois Central Railroad and Wisconsin Central Transportation, among others. Through its subsidiary in the USA, the Grand Trunk Corporation, CN now owns a rail network that stretches along the Mississippi River from the Great Lakes to the Gulf of Mexico. The company is headquartered in Montreal, Quebec.
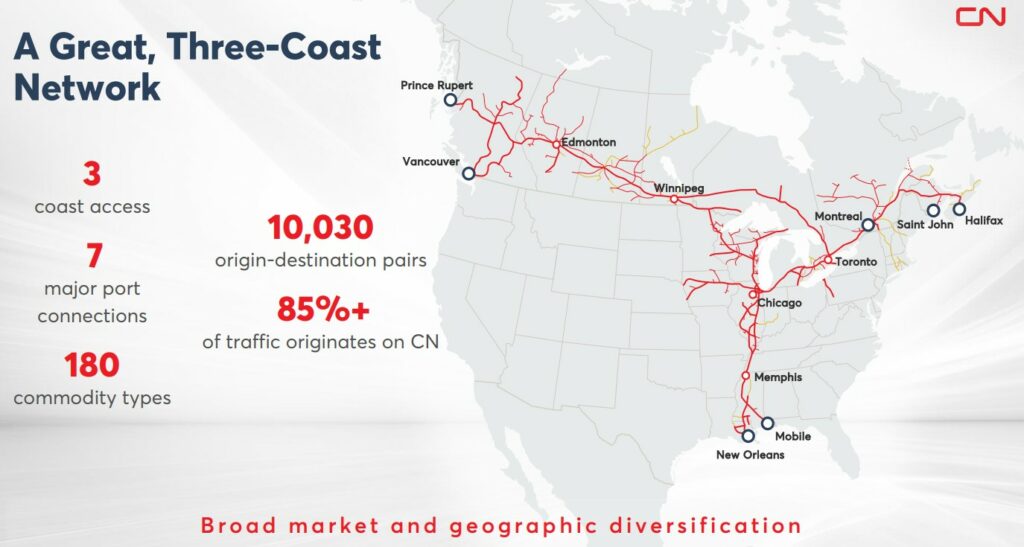
The company is the largest Canadian railroad company both in terms of the size of its route network (around 32,180 km) and its turnover. The rail company plays a key role in North America in continental freight transportation - particularly for raw materials, agricultural products, industrial products and intermodal containers.
The business model is based on the transportation of goods over long distances at the lowest possible cost - efficiently, reliably and predictably. CN earns its money primarily through transportation fees, which are charged for the shipment of various categories of goods. A particular competitive advantage lies in intermodal transportation (combination of rail, truck and ship) as well as in the vertically integrated infrastructure and IT-supported logistics solutions.
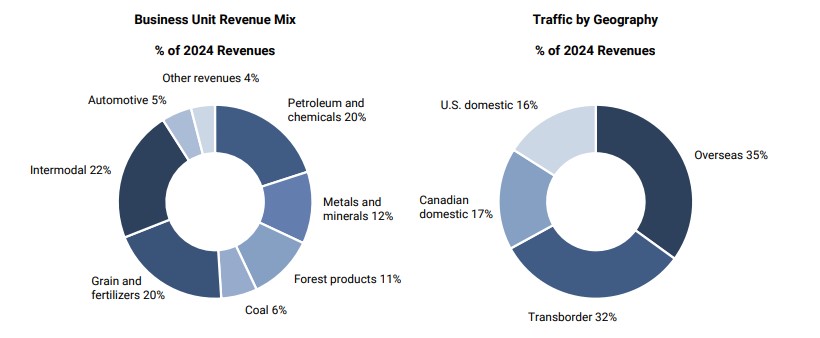
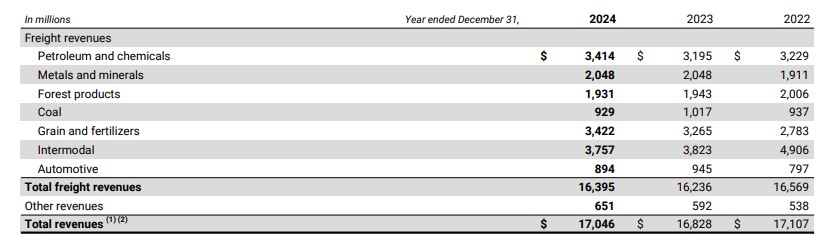
CN typically divides its business into the following seven main segments and an "Other Revenues" segment:
- Intermodal (22% of sales)
Transport of containers (e.g. consumer goods) in combined transport between ports, terminals and distribution centers. This area benefits greatly from global trade and e-commerce. - Petroleum & Chemicals (approx. 20%)
Transport of crude oil, refinery products, chemicals and fertilizers. A very profitable segment, but dependent on the energy sector. - Cereals & Fertilizers (20 %)
Transportation of grain, oilseeds and agricultural products - particularly relevant for Canadian exporters. Highly seasonal, but stable in volume. - Metals & Minerals (12 %)
Raw materials such as iron ore, steel, copper and building materials. Closely linked to mining and major industrial projects. - Forest products (11 %)
Wood, pulp, paper, building materials - a traditional segment that is closely linked to the Canadian forestry industry. - Coal (6 %)
Transportation of coal, primarily from Western Canada. Although declining, it is still a stable source of income in the export business. - Automotive (5 %)
Transportation of cars and car parts for manufacturers in Canada and the USA. Dependent on production and sales in the automotive industry. - "Other revenue" (4 %)
Other revenue is derived from non-rail logistics services that support the company's rail business, including ships and docks, distribution, automotive logistics and freight forwarding and transportation management
The Corporate strategy of Canadian National Railway (CN) is based on a clear focus on sustainable, profitable growth through operational efficiency, strategic network investments and a consistent customer orientation. CN pursues the principle of "Precision Scheduled Railroading" (PSR) - an operating model based on scheduled and lean train connections to achieve higher punctuality, lower costs and better asset utilization.
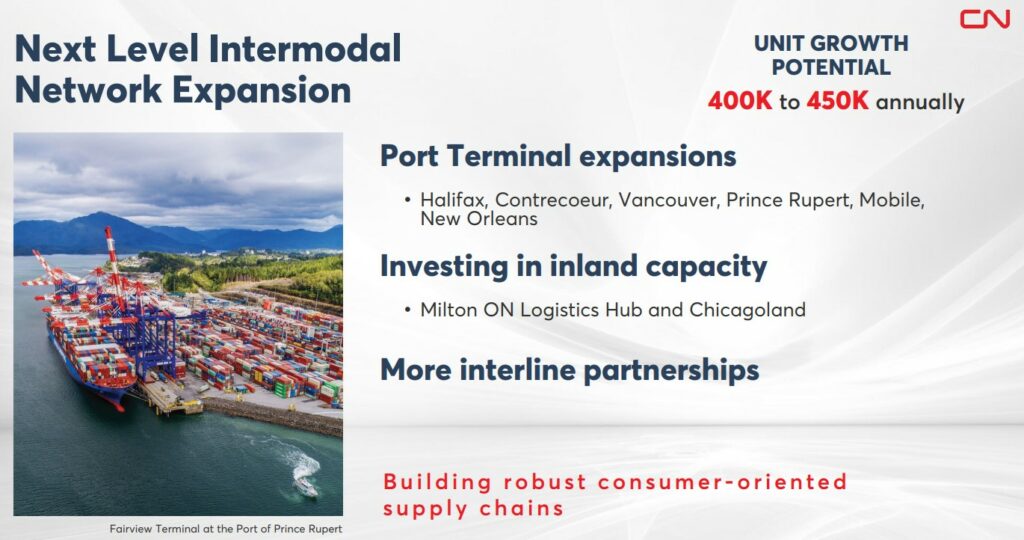
A key strategic goal is the expansion of intermodal transport solutions to enable seamless logistics chains between rail, road and sea. In this context, CN is making targeted investments in ports, container terminals and digital platforms in order to create added value as an integrated logistics service provider beyond pure rail transportation. CN's connections to major ports such as Vancouver, Prince Rupert, Halifax, New Orleans and Mobile are particularly relevant, making CN an important partner in North American and global trade.
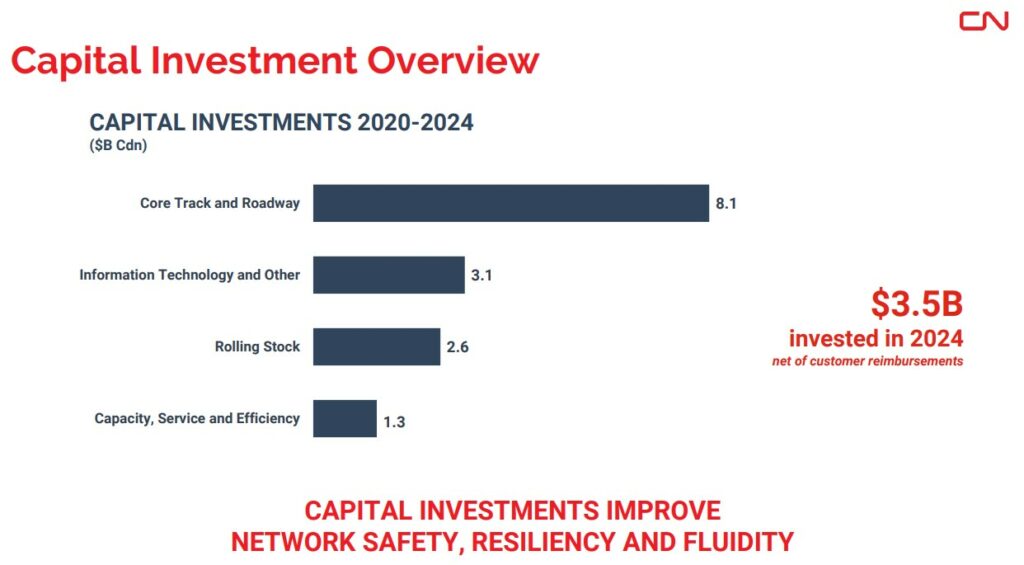
Another Strategic focus is on expanding the network and modernizing the infrastructure. Every year, CN invests billions in the expansion and maintenance of the rail network, in new locomotives, wagon fleets, modern signaling technology and digital technologies for automated maintenance, monitoring and dispatching. These measures serve to increase capacity, improve safety and reduce emissions. In order to cope with the higher volume of traffic and maintain operations, the company has invested CAD 3.5 billion in 2024 as part of the current "Capital Plan".
CN is also pursuing an ambitious agenda in the area of sustainability and decarbonization. The company is investing in alternative drive technologies (e.g. hydrogen locomotives, hybrid technology), more efficient operating processes and new emission standards in order to achieve its climate targets and at the same time meet the ESG requirements of investors.
At a strategic level, CN also pursues selective Acquisitions and partnershipsin particular to strengthen its position in the intermodal sector and for vertical integration. One example was the attempt to take over Kansas City Southern - although this was rejected in 2021, it illustrated CN's ambitions to expand its network further south towards Mexico. In April 2023, the Canadian company announced a collaboration with its American competitor Union Pacific and the Mexican railroad company Grupo México Transportes (GMXT). Together, the three railroad companies form the Falcon Premium Intermodal Service. As a result, transit times have been reduced by more than six days thanks to a continuous rail link for cross-border intermodal transport in North America.

Since January 2022 Tracy A. Robinson as Chief Executive Officer of CN. With the election of Robinson, CN prevailed against TCI Fund Management, which had campaigned for a change in the composition of the Board of Directors and proposed another candidate for the position of CEO of CN. Robinson was most recently a top manager in the energy sector at TC Energy. Prior to that, she held various positions at CN's longtime competitor, Canadian Pacific Railway, for a total of 27 years.
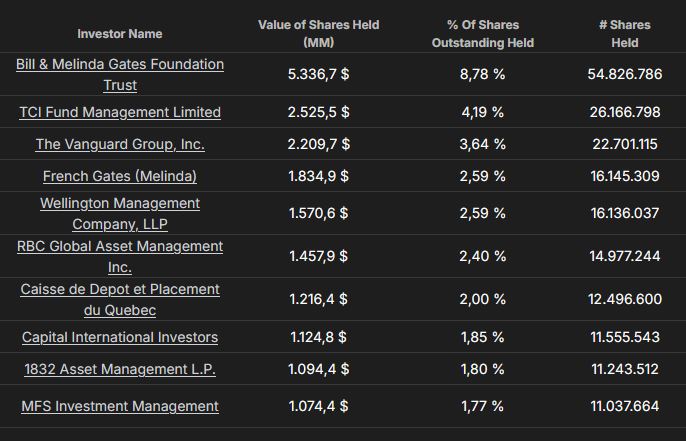
In addition to the usual major shareholders from asset management, the Bill and Melinda Gates Foundation holds around nine percent of the shares in Canadian National Railway. This makes the foundation the largest single shareholder in the Canadian group.
Industry profile and competitive situation
The characteristics of Canadian National Railway's business model and the characteristics of the industry allow for an almost exemplary Comparison of key figures of Canadian National Railway with its listed competitors.
Both companies are part of the elite Class-1 rail transportwhich concentrates freight and cargo traffic in Canada and the United States on only six railroads and one railroad company for passenger transport (Amtrak). The West, Midwest and South are dominated by Burlington Northern Santa Fe (BNSF) - a wholly owned subsidiary of Berkshire Hathaway - and Union Pacific. Along the east coast all the way down to the southeast, the CSX Corporation and Norfolk Southern set the tone. To round off the oligopoly, the Canadian National Railway and Canadian Pacific Kansas City which also occupy a significant position in freight transportation in the USA.
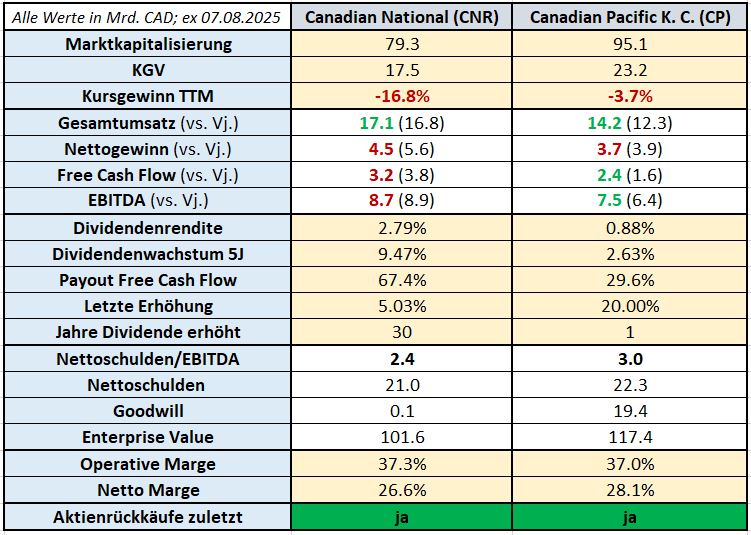
Let's get an overview thanks to the following comparison. I chose the main competitor in the Canadian domestic market as the appropriate peer group: Canadian Pacific Kansas City. Investors can decide for themselves whether this selection should be expanded to include other competitors from the United States, for example.
Notes on the values contained in the table:
- Green or red coloring of the figures indicates growth or decline compared to the previous year
- All values are quoted in Canadian dollars
The financial situation of Canadian National Railway
After gaining an overview of the industry in general and taking a closer look at the company, management and competition, we take a look at Canadian National's balance sheet and the key financial figures derived from it. The focus here is on the following aspects Growth, profitability and the Financing.
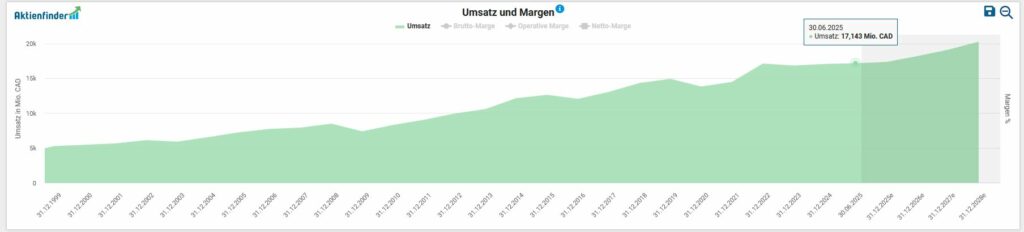
To analyze the financial situation, the first step is to look at the development of sales, profit and free cash flow. I have already discussed the internal distribution of sales by segment above in the section on the business model. On average, the Turnover in the last five years by 4.9 percent p.a.. an.
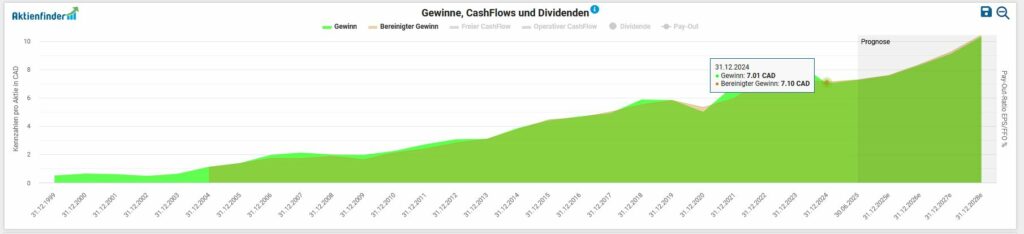
At Earnings per share we have seen an upward trend for ten years. If we look at the past financial year 2024, adjusted earnings per share fell marginally by 2.5% (CAD 7.10 vs. CAD 7.28). In the past financial year, Canadian National Railway generated a Net profit of CAD 4.5 billion.
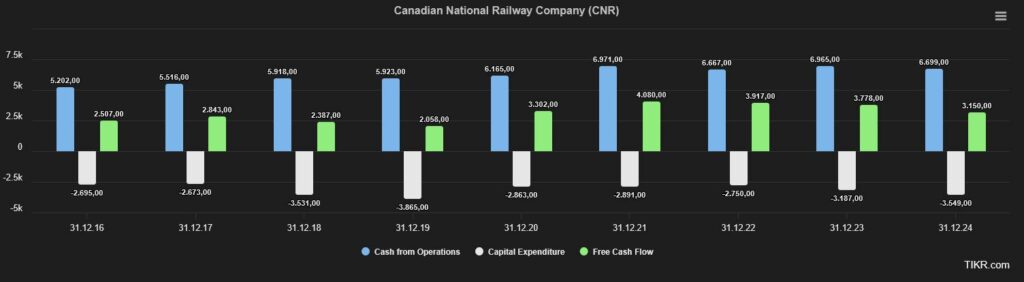
The amount available to the company Free Cash-Flow can be used for capital investments in organic growth, research and development, repayment of debt, expansion via company acquisitions, distributions of (increasing) dividends or share buybacks. In absolute figures - which I primarily like to use - the picture of operating and free cash flow as well as capital investments (CapEx) for the period 2016 to 2024 is as follows:
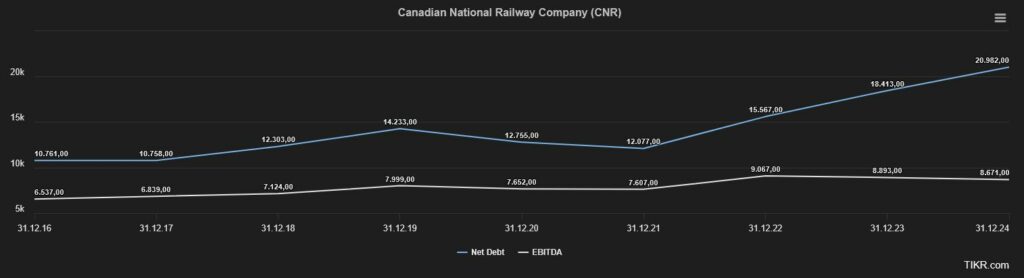
A look at the Debt situation shows us that, based on the last financial year, Canadian National Railway has a share of interest-bearing financial liabilities of CAD 21.4 billion, which in turn is offset by cash and cash equivalents and securities totaling CAD 0.4 billion. If we now divide the remaining net debt of CAD 21 billion by the most recent EBITDA of CAD 8.7 billion, we arrive at a value of 2.4. This result is below the critical threshold of 3, although it should be noted that the railroad industry is very capital-intensive and all players make quite good use of leverage.
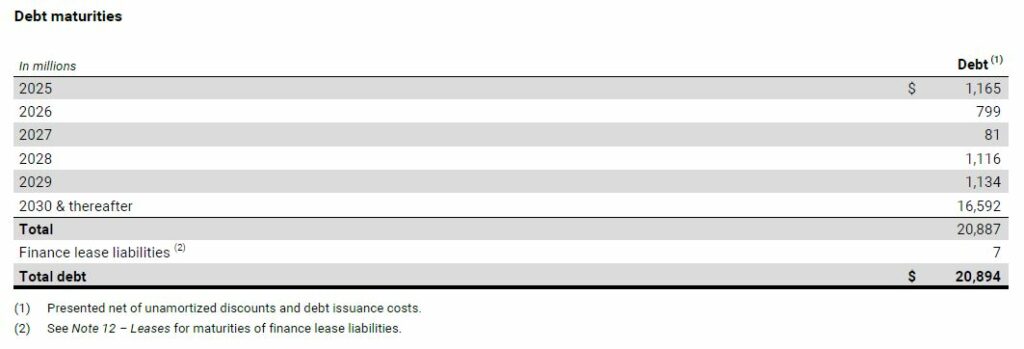
Around the topic Indebtedness and External financing it makes sense to look at the Interest profile and the Maturity structure of current liabilities. Finally, it is important to assess how vulnerable the company appears to be to key interest rates and to what extent new financing or rescheduling of existing debt is due in the near future. Up to End of 2029 a total of CAD 4.3 billion of the non-current liabilities will fall due. The railroad company almost exclusively chooses a fixed interest rate for its long-term financing.
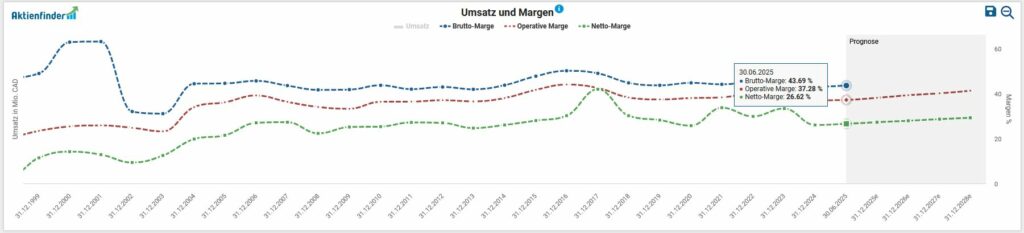
Finally, we look at the Profitability of Canadian National Railway based on the development of gross, operating and net margins. The constant development in recent years underpins Canadian National Railway's margin strength compared to its competitors.
Opportunities & risks
The competitive situation, which is concentrated on just a few providers, reflects the moat character of this industry. To put things in perspective: the leading railroad lines currently handle around 70 percent of freight traffic. This is reflected even more clearly in the financial indicator of turnover: the Class 1 network accounts for almost 95 percent of the industry's total turnover.
This is due in particular to the capital investment required to maintain a transregional rail network in the geographical dimensions of North America. In addition, the range of possible alternatives for land freight transport remains limited if a comparable price-performance ratio per transport volume is taken into consideration. Apart from the waterway, railroads are the most efficient and cost-minimizing means of transport for bulk goods on the North American continent. No wonder CN achieves very high margins.
But where there is light, there is also shadow. As a cyclical industry, the railroads are cyclically sensitive investments that are dependent on the global economy. If demand for goods of different types falls while stocks rise, the volume of transportation decreases in line with the economic law of supply and demand. This can be due to an overall economic slowdown or to sector-specific challenges such as chip shortages in the automotive industry, periods of drought, pandemic-related lockdowns, a weakening housing market, etc. In intermodal freight transport, dependencies on shipping and road transport are potential risks within the logistics chain. If a cargo ship is stuck in the Suez Canal, the rail company (as well as the waiting customer) suffers from the lack of container deliveries for onward transportation inland.
In recent months, the customs conflict has weighed on CN's shares. The railroads thrive on cross-border freight traffic in their two main markets. In general, tariffs or other trade barriers can slow down or reduce the flow of goods, resulting in lower freight volumes and therefore less turnover. In addition to the ongoing uncertainty for companies, they could reorganize their supply chains in response to tariffs and choose alternative routes or transport routes, which would consequently cost CN market share.
Current valuation of the Canadian National Railway share
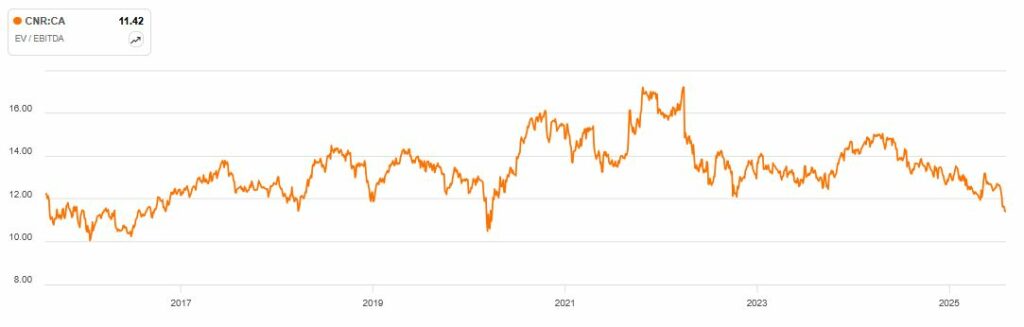
For the valuation of companies, I use the so-called Enterprise Value (EV) is used. In the case of a takeover, the EV indicates the amount required to purchase the assets required for operations and excludes the non-operating assets. I relate this key figure to operating profitability (before interest, taxes and investments (CAPEX)), expressed as EBITDA. The prevailing opinion is that a value of less than 10 indicates a „healthy valuation“ - as is always the case with generic Rules of thumb the company-specific context must be considered in the analysis by the careful investor himself. In the use case of Canadian National Railway, we have to consider a similarly fair valuation measured against the Result of 11.4 look back to the year 2020:
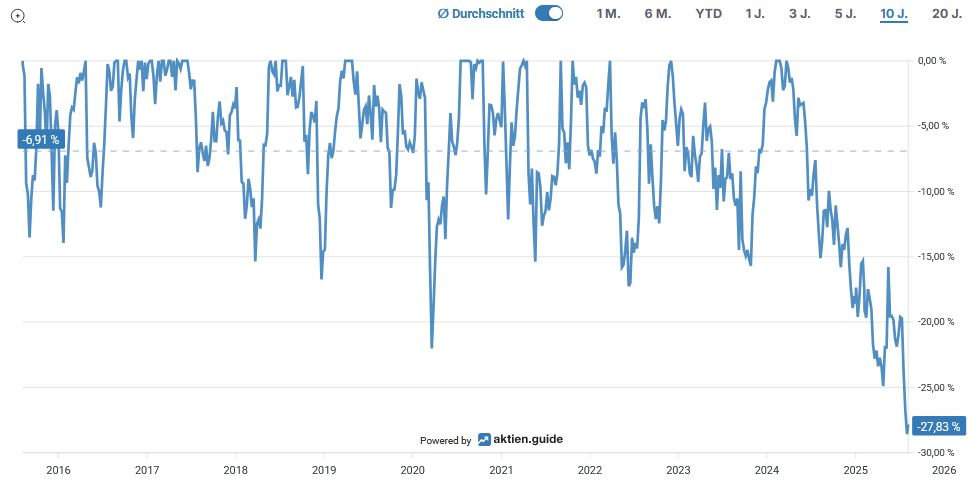
The Maximum decrease in the last ten years is currently approx. 28 percent:
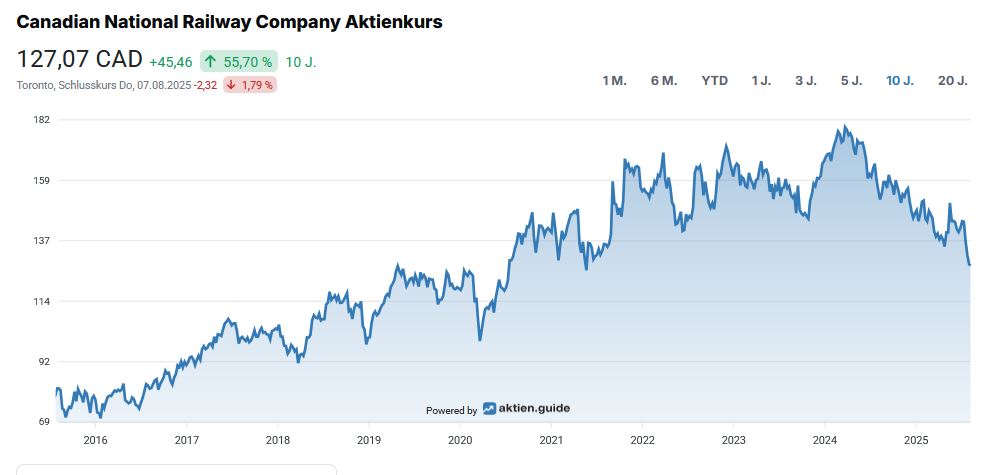
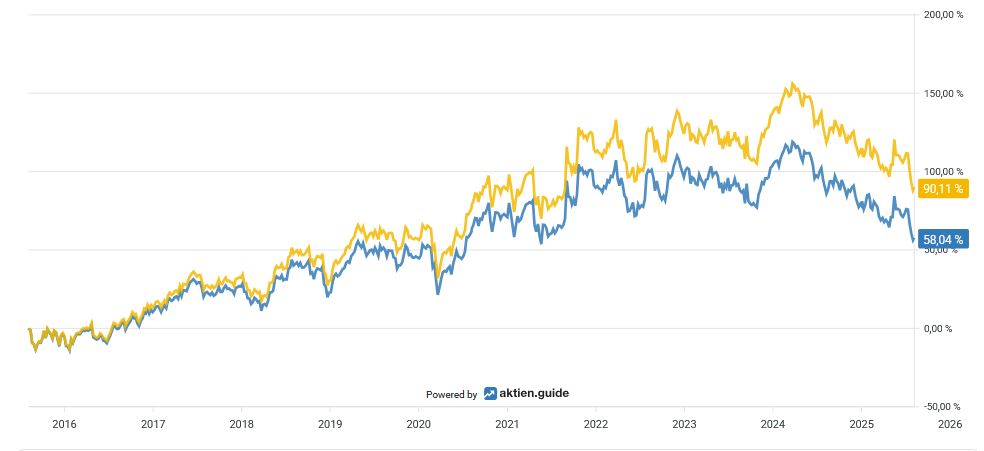
Over the past ten years, an investment in CN, measured in terms of Total Return, including dividends received, a Overall performance from 90 percent for the investor:
Capital allocation of Canadian National Railway
Since meanwhile 30 years CN pays an annually increasing dividend to its shareholders. This makes the Canadian railroad group a dividend aristocrat that has been continuously increasing its dividend for over 25 years.
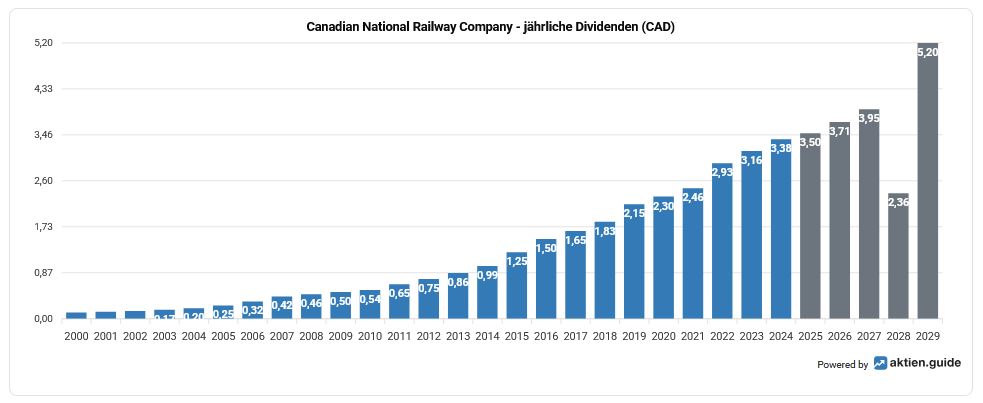
At the current share price of CAD 127.10, this results in a Dividend yield of 2.8 percent. Die Fünfjahres-Dividendenwachstumsrate amounts to 9.5 percent p.a. or 13 percent p.a. in the Ten-year period. The company last increased its dividend by 5 percent this January. To round things off, here is an overview of the last few years of dividend increases:
- 2024: +7,0 %
- 2023: +7,9 %
- 2022: +19,1 %
- 2021: +7,0 %
- 2020: +7,0 %
The quartalsweise ausgeschüttete Dividende currently amounts to CAD 0.8875 per share and is paid out at the beginning of each quarter (January, April, July, October).
If we take the average value of the Free Cash-Flow of the last three years as the basis for determining the payout ratio, we end up with a moderate result of 53.3 percent for the payout ratio of CN.
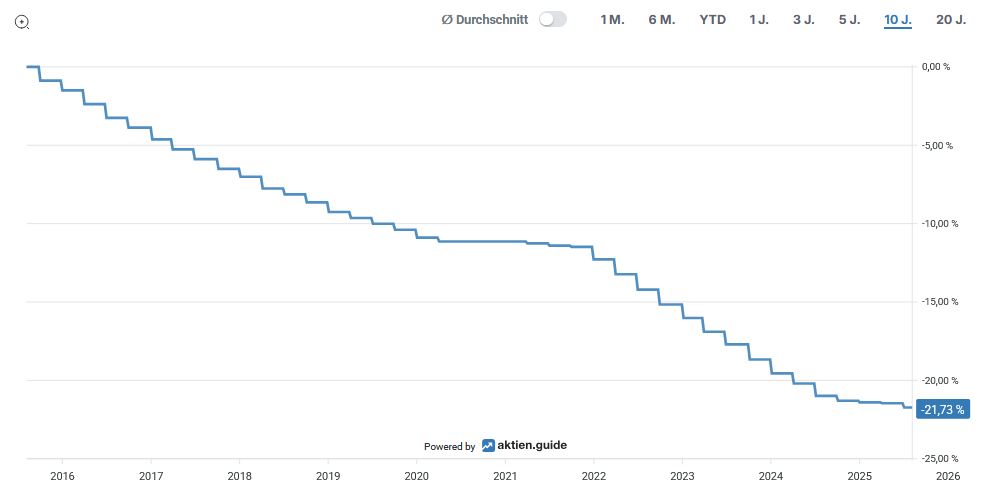
The Number of shares outstanding decreased overall by 21.7 percent in the past ten years.
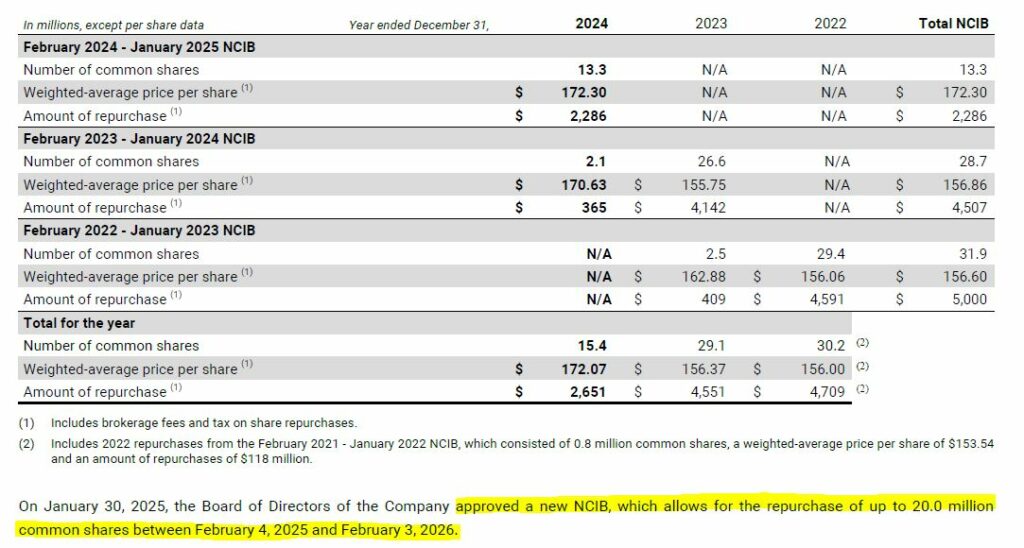
The current Aktienrückkaufprogramm grants the management the power to buy back a total of 20 million treasury shares by February 2026:
Conclusion: Considerations for my decision to invest in Canadian National Railway
Canadian National Railway's share price has suffered considerably in recent months, particularly due to the impending consequences of the tariff conflict between Canada and the United States. Despite this challenge, CN remains a key company in the North American transportation system with geostrategic importance in terms of functioning supply chains.
The broad moat, the shareholder-friendly management and diversified business model as well as the company's strategic positioning make me confident in the long term. Should the macroeconomic tailwinds improve, the railroad company still has sufficient growth and share price potential. Overall, CN is pursuing a strategy geared towards efficiency, capacity growth, digitalization and sustainability in order to secure its role as a leading North American logistics provider and its competitiveness in the long term.
The strong financial performance, coupled with an attractive dividend policy and solid cash flows, makes CN a reliable investment for investors looking for stable returns.

