Your Broker for worldwide trading

Nasdaq 100 weakens after Fed meeting

Candlestick chart showing the price movements of the Nasdaq index over time with Bollinger bands, a 50-day moving average and highlighted support and resistance zones.

Dear traders, dear stock market friends.

While the Dow Jones reached a new all-time high last week, the Nasdaq 100 came under pressure and ended the week down 1.9 %. After many investors initially bet on a tailwind for equities following the Fed meeting, sentiment in the tech sector changed noticeably. 

Fed interest rate decision and signal effect for the market

As expected by the majority of the futures markets, the Fed cut the key interest rate by a further 25 basis points last Wednesday to a range of 3.50 % - 3.75 %. This was the third rate cut in a row (following the rate cuts in September and October). More important than the cut itself was the communication:

  • Risk balance shifts: The Fed emphasized that downside risks on the labor market have recently increased. 
  • At the same time, inflation remains „somewhat elevated“. So not „mission accomplished“. 
  • The structure of the forward guidance was clearly geared towards the „extent and timing“ of further steps, i.e. no automatic mechanism for rapid further interest rate cuts.
  • There were 3 votes against: One was for a cut of 50 basis points, two for no cut at all; a signal that the Fed is clearly divided internally. 

Liquidity & reserve management purchases„

Away from the big headlines on the key interest rate, the Fed announced a technical but hugely important piece of news for the market structure: the declaration that although bank reserves are currently regarded as „ample“, proactive measures are being taken to secure this state in the long term and prevent volatility on the money market.

Specifically, the central bank announced that it would resume purchases of short-dated US government bonds (Treasury Bills). The program started on Friday, 12.12.2025, with an initial volume of around USD 40 billion per month.

  • Technology instead of stimulus (no QE): The Fed attaches great importance to ensuring that this is not misunderstood as „quantitative easing“ (QE) to stimulate the economy. It is purely technical „reserve management“.
  • Avoid the trauma of 2019: The aim is to safeguard the market function. The Fed wants to avoid stress on the repo market torpedoing interest rate management at all costs; a scenario that brings back painful memories of the repo crisis in September 2019.

Relative weakness in the Nasdaq 100

While the Dow Jones and the Russell 2000 made new highs last week, the Nasdaq 100 ended the week in the red. This divergence can be attributed to three core factors:

1) Disappointing earnings from tech heavyweights

In a week in which the macro environment was generally supportive, the negative factors in the tech sector were mainly attributable to specific micro factors. The focus was particularly on the quarterly figures from Oracle and Broadcom; two stocks that the market now regards as a kind of „thermometer“ for AI infrastructure spending (cloud, data centers, networking, custom chips).

Although both companies exceeded expectations in terms of earnings per share (EPS), the shares still came under pressure because the stock market is looking for confirmation of the next stage of growth in AI demand rather than rewarding the „bottom line beat“ at this stage.

At Oracle, it was primarily the quality of sales and growth that caused skepticism: the market had not only expected solid figures, but also clear signals that the AI-driven cloud momentum would accelerate even further. As these signals failed to materialize, a classic “sell on good news” set in after the earnings.

At Broadcom, the reactions were similar, but with a slightly different focus: Broadcom is also seen as an important beneficiary of the AI boom (network/connectivity, data center components and especially the custom silicon/accelerator ecosystem). However, the Broadcom share is already at a valuation level that is only justified if the AI trend translates smoothly into high growth rates plus stable or even rising margins. An EPS beat alone is not enough in such a phase if investors fear that AI sales will increase but margins will be worse than hoped, or competition and price pressure will increase.

2) Growth vs. valuation

At the end of 2025, many fund managers are asking themselves: how much growth is already priced in? Many mega-caps were trading on historically high multiples at the beginning of the week. The Fed's decision was a kind of catalyst to take risk out of these crowded trades and shift it to more favorable market segments.

3) Rotation favors "old economy"

With the Fed's rate cut and its signal that further steps will depend more on the upcoming data, the market positioned itself for a scenario without a hard recession (rather “soft landing” to “no landing”). The Fed projections also point to continued decent growth in 2026 (including a higher 2026 growth outlook). In such an environment, industrial, financial and transportation stocks typically perform better than highly valued growth stocks, which are more dependent on falling yields and „perfect“ growth stories.

Technical outlook for the Nasdaq 100

As long as the relative weakness in the Nasdaq 100 is only a short-term correction, there is not too much cause for concern for the time being. The following daily chart shows that the Nasdaq 100 Index is well supported in the short term at around 25,000 points in the area of the EMA 50 (green). Even if the correction were to continue, the long-term upward trend would not be in danger as long as the support zone around the 24,000-point mark is not breached.
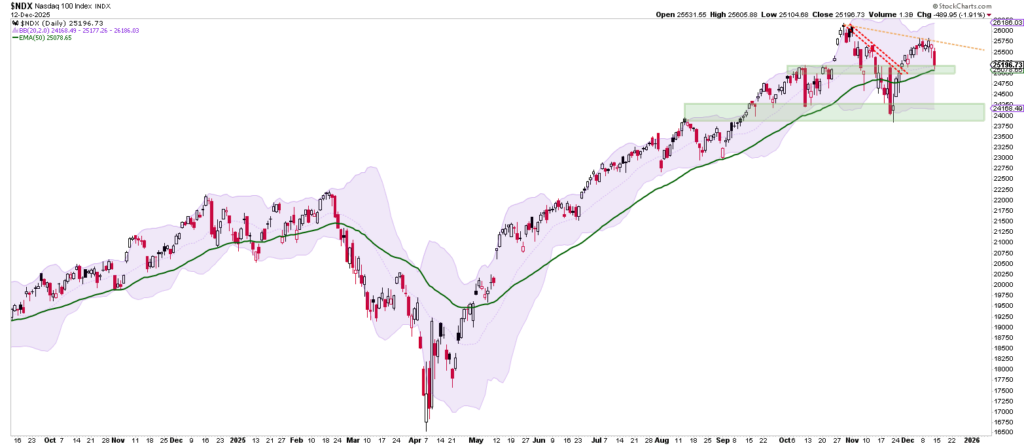
A daily candlestick chart of the NASDAQ 100 Index with a 50-day moving average, Bollinger Bands and an auto-saved blueprint highlighting support and resistance zones and a downward trend line.
Nasdaq 100 daily chart

In the medium to long term, however, relative weakness in the Nasdaq 100 would probably be a serious warning signal for the broad bull market. The following ratio chart shows the QQQ (Nasdaq 100 ETF) divided by the SPY (S&P 500 ETF). The correction (= relative weakness of the Nasdaq 100) that has been ongoing since the beginning of November can be clearly seen here.

The decisive factor for the further course of the market is now whether the marked support can be defended. A breakout above the last local high on the upside, on the other hand, would signal a renewed outperformance of the Nasdaq 100, which would also correlate with an upward trend in the broad market.
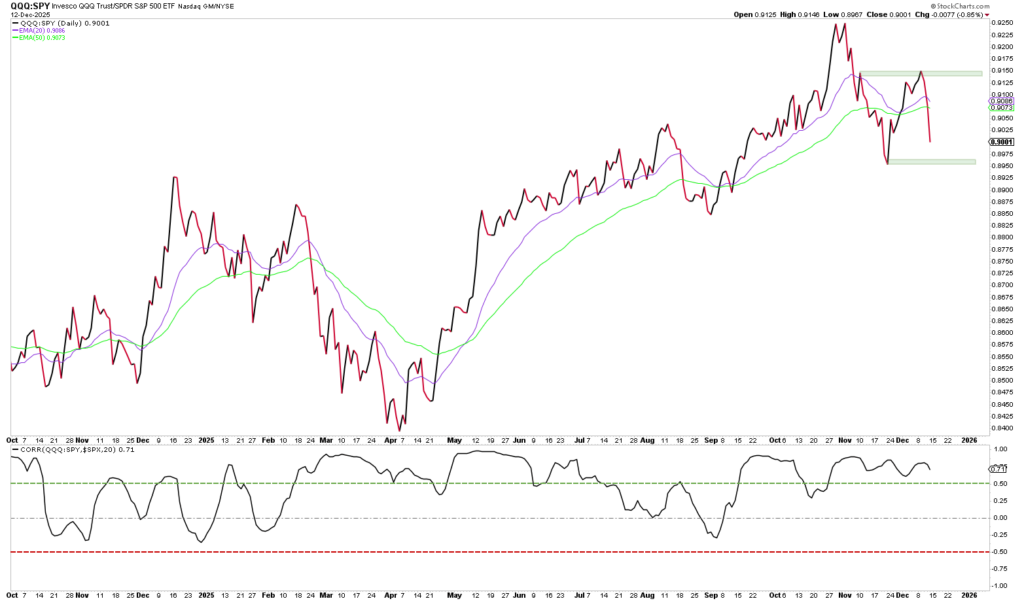
Line chart of the QQQ:SPY ratio from October 2022 to January 2024 with 50- and 200-day moving averages and a lower panel showing an oscillator with overbought and oversold lines - an automatically saved draft.
Relation chart: QQQ vs SPY

Author: Tobias Schmid
Date: 15.12.2025

A man with slicked-back hair and a trimmed beard, wearing a navy blue suit jacket and a white shirt, looks into the camera with a slight smile. Industrial background.
Tobias Schmid

Tobias Schmid has been a trader and analyst since 2008 and specializes in trading futures options and equity options. His strategies and analysis methods are based on a combination of technical analysis, intermarket analysis and sentiment analysis. Tobias Schmid is also the founder of Fomo Financea financial website for active traders, investors and options traders.

Mandatory information and disclaimer

This is a marketing communication within the meaning of Section 63 (6) of the German Securities Trading Act and does not contain investment strategy recommendations, investment recommendations or financial analyses in accordance with Section 85 of the German Securities Trading Act and Article 20 of the Market Abuse Regulation. It therefore does not fulfill the legal requirements to guarantee the objectivity of investment strategy recommendations/investment recommendations/financial analyses. CapTrader GmbH or its employees are therefore not legally prohibited from trading or providing services in the securities products mentioned therein prior to publication of the information.

Past performance, simulations or forecasts are not a reliable indicator of future performance. Mandatory information and limitation of liability for CapTrader and any third-party content providers can be found at https://www.captrader.com/marketingmitteilung/angaben
Please note that investing in financial instruments involves high risks and take note of our disclaimer and the mandatory legal information at the locations indicated.

  1. Mandatory information

Responsible: CapTrader GmbH, Elberfelder Straße 2, 40213 Düsseldorf; Commercial Register Number: HRB 86537 Düsseldorf Local Court; VAT ID DE323771603; Managing Directors Andreas Weiß, Christian Weiß, Michael Heyder; Tel: +49 211-740786-00, Fax: +49 211-740786-90.

Zuständige Aufsichtsbehörde: Bundesanstalt für Finanzdienstleistungsaufsicht, Graurheindorfer Straße 108, D – 53117 Bonn und Marie-Curie-Str. 24-28 D – 60439 Frankfurt am Main, Tel: 0228 4108 – 0 Fax: 0228 4108 1550 E-Mail: poststelle@bafin.de; Institutsnummer 10156708

Conflicts of interest CapTrader in marketing communications: CapTrader GmbH confirms that it does not hold any positions in the mentioned financial instruments beyond the positions mentioned in the marketing communication itself, if applicable. There are also no other conflicts of interest within the meaning of CapTrader GmbH's Financial Analysis and Marketing Communication Policy.

Conflicts of interest and mandatory disclosures by the third-party content provider for marketing communications with financial instrument recommendations: See under https://www.captrader.com/marketingmitteilung/angaben  to creators of third-party content

The copyright to the marketing communication is reserved. Reprinting and distribution is only permitted with our consent.

  1. Disclaimer

By accepting the content, the recipient accepts the binding nature of the limitation of liability.

a) Disclaimer for third-party content

CapTrader GmbH offers authors - such as editors, guest commentators, agencies and companies - the opportunity to publish comments, analyses, news and company announcements. Their opinions do not necessarily reflect the opinions and views of CapTrader GmbH and its employees. CapTrader GmbH assumes neither liability nor guarantee for this content. This applies in particular to incomplete or incorrectly reproduced reports, incorrect price information and editorial errors. Liability claims relating to material or immaterial damage caused by the use or non-use of the published information or by the use of incorrect or incomplete information are fundamentally excluded.

b) Exclusion of liability for CapTrader's own content

CapTrader has taken its own information in this marketing communication from sources believed to be reliable, but has not verified all such information itself. Accordingly, CapTrader makes no warranties or representations as to the accuracy, completeness or correctness of the information or opinions contained herein. Subsequent changes cannot be taken into account. The marketing communication does not constitute an offer or solicitation to buy shares of the issuer and is in no way a substitute for advice appropriate to the investor and the property. We cannot verify whether the information in the marketing communication is in line with your personal investment strategies and objectives. We recommend that you consult an investment advisor for advice that is appropriate to the investor and the property. The marketing communication cannot and should not replace a securities prospectus and/or expert investment advice required for an investment. It can therefore never be the sole basis for an investment decision. By accepting the marketing communication, the recipient accepts the binding nature of the above limitation of liability.

CapTrader provides the information despite careful procurement and provision only without guarantee for the correctness / completeness, timeliness or accuracy and availability of the stock exchange and economic information, prices, rates, indices, general market data, valuations, assessments and other accessible content held and displayed for retrieval. This also applies to third-party content. Historical observations and forecasts are not a reliable indicator of future developments. The facts presented in particular in connection with product information are for illustrative purposes only and do not permit any statements to be made about future profits or losses. Any conditions stated are to be understood as non-binding indications and are dependent on market developments on the day of conclusion.

CapTrader accepts no liability for any direct or indirect damage caused by and/or related to the distribution and/or use of this marketing communication.

The information, opinions and statements correspond to the status at the time of preparation of the marketing communication. They may be outdated due to future developments without the publication being changed.

CapTrader is not obliged to update, amend or supplement the information in this marketing communication if a circumstance mentioned in this publication or a statement, estimate or forecast contained therein changes or becomes inaccurate. The presentation of the performance of financial instruments over previous periods does not provide a reliable indication of their future performance. No guarantee can therefore be given for the future price, value or income of any financial instrument mentioned in this publication.

Despite careful control of the content, we assume no liability for the content of external links. The operators of the linked pages are solely responsible for their content.

Distribution: This publication may only be distributed in accordance with the laws of the respective countries, and persons in possession of this publication should inform themselves about the applicable local regulations. The information contained herein is not intended for natural or legal persons who, due to their place of residence or business, are subject to a foreign legal system that imposes restrictions on the distribution of such information. The contents are therefore exclusively in German. In particular, this publication contains neither an offer nor an invitation to purchase securities to citizens of the USA, Great Britain and Australia.

Taxes: The tax treatment of financial instruments depends on the personal circumstances of the respective investor and may be subject to future changes, which may also have a retroactive effect.

Historical observations and forecasts are not a reliable indicator of future developments. The facts presented in particular in connection with product information are for illustrative purposes only and do not permit any statements to be made about future profits or losses. Any conditions stated are to be understood as non-binding indications and are dependent on market developments on the day of conclusion.

CapTrader accepts no liability for direct or indirect damage caused by and/or in connection with the distribution and/or use.

The information, opinions and statements correspond to the status at the time of preparation of the marketing communication. They may be outdated due to future developments without the publication being changed.

CapTrader is not obliged to update, amend or supplement the information if a circumstance mentioned in this publication or a statement, estimate or forecast contained therein changes or becomes inaccurate. The presentation of the performance of financial instruments over previous periods does not provide a reliable indication of their future performance. No guarantee can therefore be given for the future price, value or income of any financial instrument mentioned in this publication.

Despite careful control of the content, we assume no liability for the content of external links. The operators of the linked pages are solely responsible for their content.

Distribution: This publication may only be distributed in accordance with the laws of the respective countries, and persons in possession of this publication should inform themselves about the applicable local regulations. The information contained herein is not intended for natural or legal persons who, due to their place of residence or business, are subject to a foreign legal system that imposes restrictions on the distribution of such information. The contents are therefore exclusively in German. In particular, this publication contains neither an offer nor an invitation to purchase securities to citizens of the USA, Great Britain and Australia.

Taxes: The tax treatment of financial instruments depends on the personal circumstances of the respective investor and may be subject to future changes, which may also have a retroactive effect.

Email:

info@captrader.com

Send e-mail

Phone:

Hotline (Germany)
0800-8723370

Hotline (International)
00800-08723370

Further contact options