Your Broker for worldwide trading

Analysis Hewlett Packard Enterprise Company (HPE)

Please note that investing in financial instruments involves high risks and take note of our disclaimer and the mandatory legal information at the end of the financial analysis. Past performance, simulations or forecasts are not a reliable indicator of future performance.

HPE- With the world's fastest computer and tech hype into Q3 2024?

Hewlett Packard Enterprise Company (HPE) is a global technology company. According to Reuters, its segments include Servers, Hybrid Cloud, Intelligent Edge, Financial Services, Corporate Investments and Other.

The Server segment consists of general-purpose servers for multi-workload computing and workload-optimized servers that offer performance for demanding applications and integrated systems. The Hybrid Cloud segment offers a variety of cloud-native and hybrid solutions in the areas of storage, private cloud and infrastructure software-as-a-service (SaaS). The Intelligent Edge segment offers wired and wireless local area networks, campus, branch and data center switching, software-defined wide area networks, software for private and public mobile networks, network security and related services. The Financial Services segment offers flexible investment solutions such as leasing, financing, IT consumption, utility programs and asset management services for customers that facilitate technology adoption models.

According to Statista, HPE currently owns the two best and fastest high-performance computers in the world, named Frontier and Aurora. As these computers are designed to process multiple data formats simultaneously, they are used in the field of AI in particular.

According to Thomson Reuters, HPE has a market capitalization of USD 25.2 billion as of 2 September 2024.

Before the quarterly figures - How will HPE start the second half of 2024?

HPE will publish its quarterly figures for Q3 2024 on 04.09.2024. Investors should be satisfied with the Group's share price performance to date. Since the beginning of the year, the share price has risen by 13.7%. HPE has been less convincing in the medium term. Those who have held the share for a year have only received an inflation adjustment with an increase of 5%.

The Dividend was increased from USD 0.48 last year to USD 0.52. HPE therefore currently pays a dividend of 2.7% p.a.

A closer look at the chart shows the volatility of HPE. The share has ranged between USD 14.80 and USD 21.80 over the past nine months.

In which direction will the pendulum swing for HPE? According to TOGGLE's AI, a volatile share price development is imminent. HPE shareholders or interested parties should therefore follow the quarterly figures closely.

According to TOGGLE, if the quarterly figures turn out better than expected, this will lead to a median increase of 4.47% one month after the figures are announced.
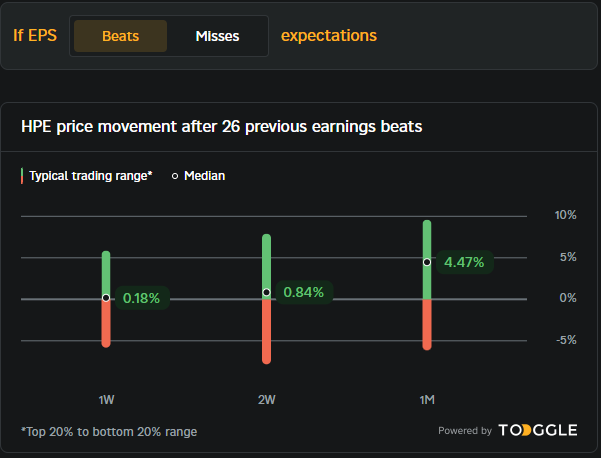
Analysis HPE Beat CapTrader Analysis

In the negative scenario, HPE underperforms the expected quarterly figures. According to TOGGLE, this scenario leads to a significant median price drop of 11.48% one month after the announcement of the figures.
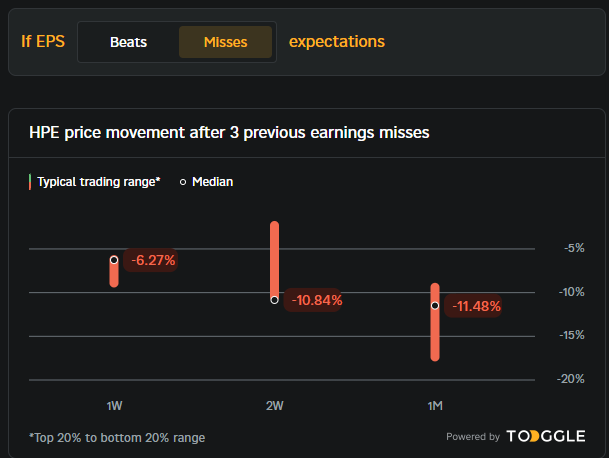
Analysis HPE Miss CapTrader Analysis

Fundamental data analysis - HPE's strengths and weaknesses

Fundamental analysis uses past financial and business data to draw conclusions about the current situation of a company. Here, factors such as debt, profit and Cash flow of great importance. In order to interpret these key figures appropriately, it is crucial to set them in relation to a comparative universe. This makes it possible to assess whether the company is in a strong or weak position compared to others in its sector.

Is HPE crisis-proof? - A look at the balance sheet

HPE's balance sheet has been severely impacted by the coronavirus pandemic in recent years. Returns were at rock bottom in the 2020 financial year, but the tech specialist has been able to recover in recent years.

The share of non-current assets in total assets has remained constant at over € 601 thousand since the 2020 financial year. In Q2 2024, 64.1% was recorded. HPE can therefore utilize the majority of the assets used from the substance. This is a quality feature, particularly in the technology industry, which has sometimes been affected by severe delivery delays.

The Debt ratio of HPE was reduced from 70% in the 2020 financial year to currently 63.6%. Given the current interest rate situation, a further reduction in borrowings would be desirable.

HPE's equity development is positive. Since 2020, the Equity by USD 35% and will now amount to around USD 21.7 billion in Q2 2024.

In summary, HPE was able to reduce its dependence on current assets in order to be less affected by supply bottlenecks. The debt ratio is slowly declining, and the company should aim to reduce debt more quickly given the current interest rate situation. The increase in equity by 35% since 2020 is extremely positive. All financial data presented here was calculated on the basis of Yahoo Finance.

How profitable is HPE?

The technology group's profitability has stabilized again since 2020, but is not satisfactory.

At 3%, the net return on assets was at rock bottom during the coronavirus crisis in 2020. Although this figure improved to 4.3% in the 2023 financial year, shareholders were not convinced. HPE stagnated in calendar year 2023, with the share price moving from USD 16 to USD 17.

HPE's net return on sales amounted to around 6% in 2020. A four-year high of 8.4% was reached in the 2023 financial year. In Q2 2024, 7% could be reported.

With a net return on equity of 10% in 2020, HPE recorded a four-year low. In the 2023 financial year, 11.5% was reported. In Q2 2024, HPE reported only 2% at this level.

In the 2023 financial year, HPE achieved a four-year high in the areas of return on assets, return on sales and return on equity. Comparing the current figures with those reported in 2020, it is clear that growth is only progressing slowly. HPE's return on assets in particular needs to be increased. Although HPE has the fastest computers in the world, its profitability growth is sluggish. On a positive note, the net return on sales reported in Q2 2024 points to a new record for the current financial year 2024.

Popular fundamental data on HPE

The Price-earnings ratio (P/E ratio) of HPE is currently 14.1 according to TWS, which is significantly below the level of competitors Cisco (19.9) and Dell (23.7).

Also the Kurs-Buchwert-Verhältnis of 1.2 is lower than Cisco's P/B ratio of 4.5.

At Price/sales ratio (P/S ratio) only Dell can keep up with HPE. The two companies have almost identical scores of 0.92 and 0.9. Cisco falls significantly behind here with 3.78.

HPE offers its shareholders a dividend of 2.7% based on the current share price, while Cisco pays 3.2% and Dell 1.5%.

Overall, HPE is valued significantly lower than Cisco and slightly lower than Dell.

Technical analysis - What picture does the HPE chart paint?

From March to June 2024, HPE rose from USD 14.60 to USD 22.60. The share was subsequently sold off with a temporary gap down to USD 16.50. However, the gap was closed again, allowing HPE to rise to USD 19.40. HPE has been highly volatile in recent months, which is why the following chart analysis is important.

With three negative and two positive aspects, the Ichimoku indicator tends to point to a consolidation and sideways phase.

The Relative Strength Indicator (RSI) describes whether a share is overbought or oversold. From a level of 70, the share is considered overbought. At a value below 30, the stock is considered oversold. According to this chart from TWS, HPE is rather overvalued at 60.8 according to the RSI.

The 200-day line serves as support for HPE at the USD 1.70 level, while the 50-day line at USD 19.60 forms resistance. The share is currently at USD 19.40 and must sustainably exceed the USD 19.60 hurdle in order to initiate an upward trend.

Overall, the chart points to a consolidation or a slight downward trend for HPE.

Chart HPE CapTrader Analysis

Conclusion: The valuation of HPE

HPE has become less dependent on supply bottlenecks and is slowly reducing its leverage. At the same time, profitability has reached a four-year high in all measured areas. The speed with which leverage is being reduced and profitability increased is worthy of criticism.

Based on the key figures described here, HPE is valued more favorably than Cisco and slightly lower than Dell.

HPE's volatile chart shows that investors are unsure about the direction in which the share is heading. The indicators tend to point to a slightly negative trend. The AI of TOGGLE points to a high volatility of 4% or 11% in both positive and negative scenarios.

HPE is making progress, but this is happening on too small a scale. Overall, the share must therefore be rated HOLD.

Jan Heyder in a suit and white shirt poses for a professional portrait photo in front of a plain background, looks directly into the camera and smiles slightly.
Jan Heyder

Jan Heyder has been with CapTrader since 2015 and holds the position of Senior Sales Manager. Mr. Heyder completed his Certified Derivatives Trader at EUREX in Eschborn in 2020. In 2021, he completed his Master of Science (M.Sc.) in Accounting & Finance at FOM Düsseldorf . At CapTrader, Mr. Heyder looks after corporate and private clients, clients in asset management managed accounts, securities account transfers and stock market simulations at FOM and EUREX.

Mandatory information and disclaimer
  1. Haftungserklärung

Bitte beachten Sie, dass die Anlage in Finanzinstrumenten hohe Risiken beinhaltet, insbesondere besonders hohe bei dem Einsatz von Derivaten und/oder kreditfinanzierten Anlagen. Bei Erstellung dieser Analyse haben wir uns die tatsächlichen Angaben aus uns zur Verfügung stehenden, allgemein als zuverlässig angesehenen Quellen verschafft. Wir können keinen Anspruch auf Richtigkeit und Vollständigkeit dieser Informationen erheben. Die auf diesen tatsächlichen Angaben beruhenden Einschätzungen unsererseits stellen unverbindliche Werturteile zum Zeitpunkt der Erstellung der Analyse dar. Nachträgliche Änderungen können nicht berücksichtigt werden. Eine Haftung für die Vollständigkeit oder Richtigkeit dieser Analyse können wir nicht übernehmen. Die Studie stellt kein Angebot und keine Aufforderung dar, Aktien des Emittenten zu erwerben. Diese Analyse ersetzt keinesfalls die anleger- und objektgerechte Beratung. Wir können nicht überprüfen, ob sich die Empfehlungen mit Ihren persönlichen Anlagestrategien und Zielen decken. Für eine anleger- und objektgerechte Beratung empfehlen wir Ihnen, einen Anlageberater aufzusuchen. Eine Analyse-Publikation kann und soll ein für eine Investition erforderliches Wertpapierprospekt und/oder eine fachkundige Anlageberatung keinesfalls ersetzen. Sie kann daher nicht alleinige Grundlage für die Entscheidung über eine Investition sein.

Das Urheberrecht an der Analyse wird vorbehalten, Nachdruck und Verbreitung ist nur mit unserer Zustimmung zulässig.

Mit Annahme der Analyse akzeptiert der Empfänger die Verbindlichkeit der vorstehenden Haftungsbeschränkung.

  1. Mandatory information
  2. aa) Verantwortung für die Erstellung und Verbreitung / Impressum

CapTrader GmbH, Elberfelder Straße 2, 40213 Düsseldorf; Handelsregisternummer: HRB 86537 Amtsgericht Düsseldorf; USt-ID DE323771603; Geschäftsführer Andreas Weiß, Christian Weiß, Michael Heyder; Tel:  +49 211-740786-00, Fax: +49 211-740786-90.

  1. bb) Zuständige Aufsichtsbehörde

Bundesanstalt für Finanzdienstleistungsaufsicht, Graurheindorfer Straße 108, D – 53117 Bonn und Marie-Curie-Str. 24-28 D – 60439 Frankfurt am Main, Tel: 0228 4108 – 0 Fax: 0228 4108 1550 E-Mail: poststelle@bafin.de; Institute number 10156708

  1. cc) Ersteller

Jan Heyder, Junior-Analyst

  1. dd) Completion of preparation: 12.04.2023, 4:00 p.m., first publication: 12.04.2023, 8:00 p.m.
  2. ee) Zeitliche Bedingungen vorgesehener Aktualisierungen: keine Aktualisierung vorgesehen
  3. ff) Vorangegangene Analysen in den letzten 12 Monaten, die eine von dieser Analyse abweichende Empfehlung für eine bestimmte Anlageentscheidung: siehe Liste unterhttps://www.captrader.com/analyse/ergaenzende-pflichtangaben
  4. gg) Die Analyse ist vor ihrer Veröffentlichung dem Emittenten nicht zugänglich gemacht worden.
  5. hh) Alle in der Analyse angegebenen Kurse und Kursverläufe beruhen auf den Schlusskursen zu dem hierfür angegebenen Datum und der Zeit, soweit zu den Kursen und Kursverläufen keine anderweitigen Angaben gemacht werden.
  6. ii) Die Analyse wird allen daran interessierten Personen zeitgleich bereitgestellt.
  7. jj) Übersicht über unsere Analysetätigkeit: siehehttps://www.captrader.com/analyse/uebersicht-analysetaetigkeit
  8. kk) Bedeutung der Angaben

Kaufen/Buy: Die Aktie wird nach unserer Einschätzung auf Sicht von 6 Monaten einen absoluten Gewinn von mindestens 5% aufweisen.

Halten/Hold: Die Aktie wird nach unserer Einschätzung auf Sicht von 6 Monaten einen absoluten Kursgewinn und/oder einen absoluten Kursverlust von 5% nicht überschreiten.

Verkaufen/Sell: Die Aktie wird nach unserer Einschätzung auf Sicht von 6 Monaten einen absoluten Kursverlust von mindestens 5% aufweisen.

Unabhängig von der vorgenommenen Einschätzung bestehen nach der Empfindlichkeitsanalyse deutliche Risiken aufgrund einer Änderung der zugrunde gelegten Annahmen. Zu den Risiken gehören unvorhergesehene Änderungen im Hinblick auf den Wettbewerbsdruck, bei der Nachfrage nach den Produkten eines Emittenten und bei der Angebotssituation für produktionsnotwendige Materialien, sowie der Nichteintritt der unterstellten Entwicklung. Solche Schwankungen können sich durch Veränderungen technologischer Art, Veränderungen der Konjunktur, Rechts- und Währungskursänderungen ergeben. Diese Erörterung von Risikofaktoren erhebt keinen Anspruch auf Vollständigkeit.

  1. ll) Interessenkonflikte

Weder die CapTrader GmbH, noch ein mit ihr verbundenes Unternehmen, noch eine bei der Erstellung mitwirkende Person (noch deren mit ihr eng verbundenen Personen), noch eine zu der Analyse vor Weitergabe Zugang habende oder haben könnende (sofern bei/von genanntem Unternehmen beschäftigte/beauftragte) Person

  1. sind am gezeichneten Kapital des Emittenten mit mindestens 5 Prozentbeteiligt.
  2. waren innerhalb der vorangegangenen zwölf Monate bei der öffentlichen Emission von Finanzinstrumenten des Emittenten federführend oder mitführend.
  3. waren Marketmaker oder Liquiditätsspender in den Finanzinstrumenten des Emittenten.
  4. haben mit dem Emittenten eine Vereinbarung über die Erbringung von Wertpapierdienstleistungen gemäß Anhang I Abschnitt A und B der Richtlinie 2014/65/EU getroffen, die innerhalb der vorangegangenen zwölf Monate gültig war oder in diesem Zeitraum eine Leistung oder ein Leistungsversprechen aus einer solchen Vereinbarung gegeben war.

Die CapTrader GmbH

  1. ist nicht in Besitz einer Nettoverkaufs- oder Nettokaufposition von über 0,5% des Finanzinstruments.
  2. hat mit dem Emittenten, der selbst oder dessen Finanzinstrumente Gegenstand der Analyse sind, eine Vereinbarung zu der Erstellung der Analyse getroffen.

Sonstige Beziehungen und Umstände, bei denen damit gerechnet werden kann, dass sie die Objektivität der Analyse beeinträchtigen, sind für die CapTrader GmbH betreffend ihr und den oben genannten Personen nicht kenntlich.

  1. mm) Interne organisatorische und regulative Vorkehrungen zur Prävention oder Behandlung von Interessenkonflikten.
    Mitarbeiter der CapTrader GmbH, die mit der Erstellung und/oder Darbietung von Finanzanalysen befasst sind und Personen, die zur Analyse vor Weitergabe Zugang haben oder haben können, unterliegen den internen Compliance-Regelungen. Die internen Compliance-Regelungen entsprechenden Vorschriften von § 85 WphG iVm. Art. 37 Delegierte Verordnung EU 2017/565. Dies beinhaltet Mitarbeitergeschäftsmeldepflichten und insbesondere Geschäftsverbote, Informationsschranken, Verbot für Zuwendungen Dritter, keine Erstellung von Auftragsanalysen und Regeln zur Vergütung der Mitarbeiter. Die Vergütung der an der Erstellung der Analyse beteiligten Mitarbeiter ist nicht an Geschäfte oder Dienstleistungen nach Anhang I Abschnitt A und B Richtlinie 2014/65/EU oder Handelsgebühren der Captrader GmbH oder verbundener Unternehmen gebunden.
  1. nn) Wesentliche Informationsquellen / Zusammenfassung der Bewertungsgrundlagen und Methoden:
    In- und ausländische Medien wie Informationsdienste (z.B. VWD, Bloomberg u. a.), Wirtschaftspresse (z.B. Börsen-Zeitung, Handelsblatt, FAZ, Wallstreet Journal, Financial Times u. a.), Fachpresse, veröffentlichte Statistiken, das Internet sowie Veröffentlichungen, Angaben und Informationen der analysierten Emittenten.

Zur  Bewertung der Fundamentalindikatoren werden gängige und anerkannte Bewertungsmethoden (u. a. DCF-Methode, Excess-Return-Modell, Dividendendiskontierungsmodell und Peer-Group-Analyse) verwandt. In der DCF-Methode wird der Wert des Emittenten berechnet, der die Summe der abgezinsten Zahlungsströme, d.h. des Barwertes der zukünftigen Zahlungsströme des Emittenten, darstellt. Der Wert wird somit durch die erwarteten künftigen Zahlungsströme und durch den angewandten Diskontierungssatz bestimmt. Für das Excess-Return-Modell und das Dividendendiskontierungsmodell werden Standardmodelle verwendet. In der Peergroup-Analyse werden an der Börse notierte Emittenten durch den Vergleich von Verhältniskennzahlen (z.B. Kurs-/Gewinn-Verhältnis Kurs-/ Buchwert-Verhältnis, Enterprise Value/Umsatz, Enterprise Value/EBITDA, Enterprise Value/EBIT) bewertet. Die Vergleichbarkeit der Verhältniskennzahlen wird in erster Linie durch die Geschäftstätigkeit und die wirtschaftlichen Aussichten bestimmt.

Zur Bewertung der Chart-Indikatoren wird die Kursentwicklung anhand diverser  Chartanalyseprogramme vorgenommen, insbesondere Stock3, Tradingview und Trader Workstation.

  1. oo) Adressaten

Die Analysen der CapTrader GmbH richten sich an Privatkunden. Sie stellen kein umfassendes Research zum analysierten Unternehmen dar, sondern sind als Anregung zur vertieften Eigenrecherche bzw. Befragung von Anlageberatern zu verstehen. Die Analysen sind daher nicht geeignet eine Anlageentscheidung ausschließlich auf dieser Basis zu treffen. Siehe hierzu auch die Haftungserklärung oben.

Track all markets on TradingView
Follow all markets on TradingView
Email:

info@captrader.com

Send e-mail

Phone:

Hotline (Germany)
0800-8723370

Hotline (International)
00800-08723370

Further contact options