Dear trader, dear stock market friends.
Last week was the worst for the Dow Jones since October. This is not necessarily evidence of a very weak week, but rather underlines the enormous strength that the market has shown over the last four months. In addition to the Dow, the other two major indices (S&P 500 and Nasdaq 100) also fell slightly. After the almost uninterrupted rally since November, many investors seem to be longing for a correction in order to get another chance to enter the market.
Labor market data provide contradictory signals
The labor market data for the month of February published on Friday afternoon provided contradictory signals as to when the US Federal Reserve may start lowering interest rates. On the one hand, the number of new jobs created last month was well above expectations at 275,000. The consensus estimate was 198,000, suggesting that the labor market remains robust and the economy is doing well.
The unemployment rate, on the other hand, rose to 3.9 % and wage growth was lower than feared, giving hope that inflation has cooled enough to reassure the Fed. January employment growth data was also revised downwards.
All in all, the data can probably be interpreted to mean that the market's expectations of the Fed for 2-3 interest rate hikes this year are realistic.
Hoping for a correction
With a decline of 365 points or 0.9%, the Dow Jones Index closed slightly lower for the second week in a row. However, following the strong rally that started in November from 32,500 points, the Dow is still in the overbought zone in the medium-term picture. The weekly RSI (14) is above 70 points. All those who have not yet been able to participate in the rally or have already taken profits are hoping for a correction and a second chance to jump on the trend.
As can be seen on the weekly chart, and as could not be otherwise in a bull market, the index is supported on several charts in the event of a correction. Should the market now actually enter correction mode, an ideal entry level would be around 37,000 points, the price level of the old all-time highs. Even in the event of an extended correction to the next support level at around 35,500 points, the overriding upward trend would not be called into question in any way.

Dow Jones Index weekly chart
Increased distribution days
As can be seen on the daily chart, there have been several distribution days in recent weeks (days with a negative price trend with higher volume than the previous day). This can be recognized when a red volume bar is larger than the volume bar of the previous day. (These are marked with a red arrow in the following chart.) As soon as distribution days occur more frequently, this is often a sign of an impending correction.
However, it should be noted that the stock market has built up extremely strong momentum in recent weeks and months. Signs of a correction should therefore at best be used to wait it out or to take profits and then reposition in the direction of the overriding upward trend when new bullish signals emerge. Trading against the trend would be a very risky strategy in the current market environment.
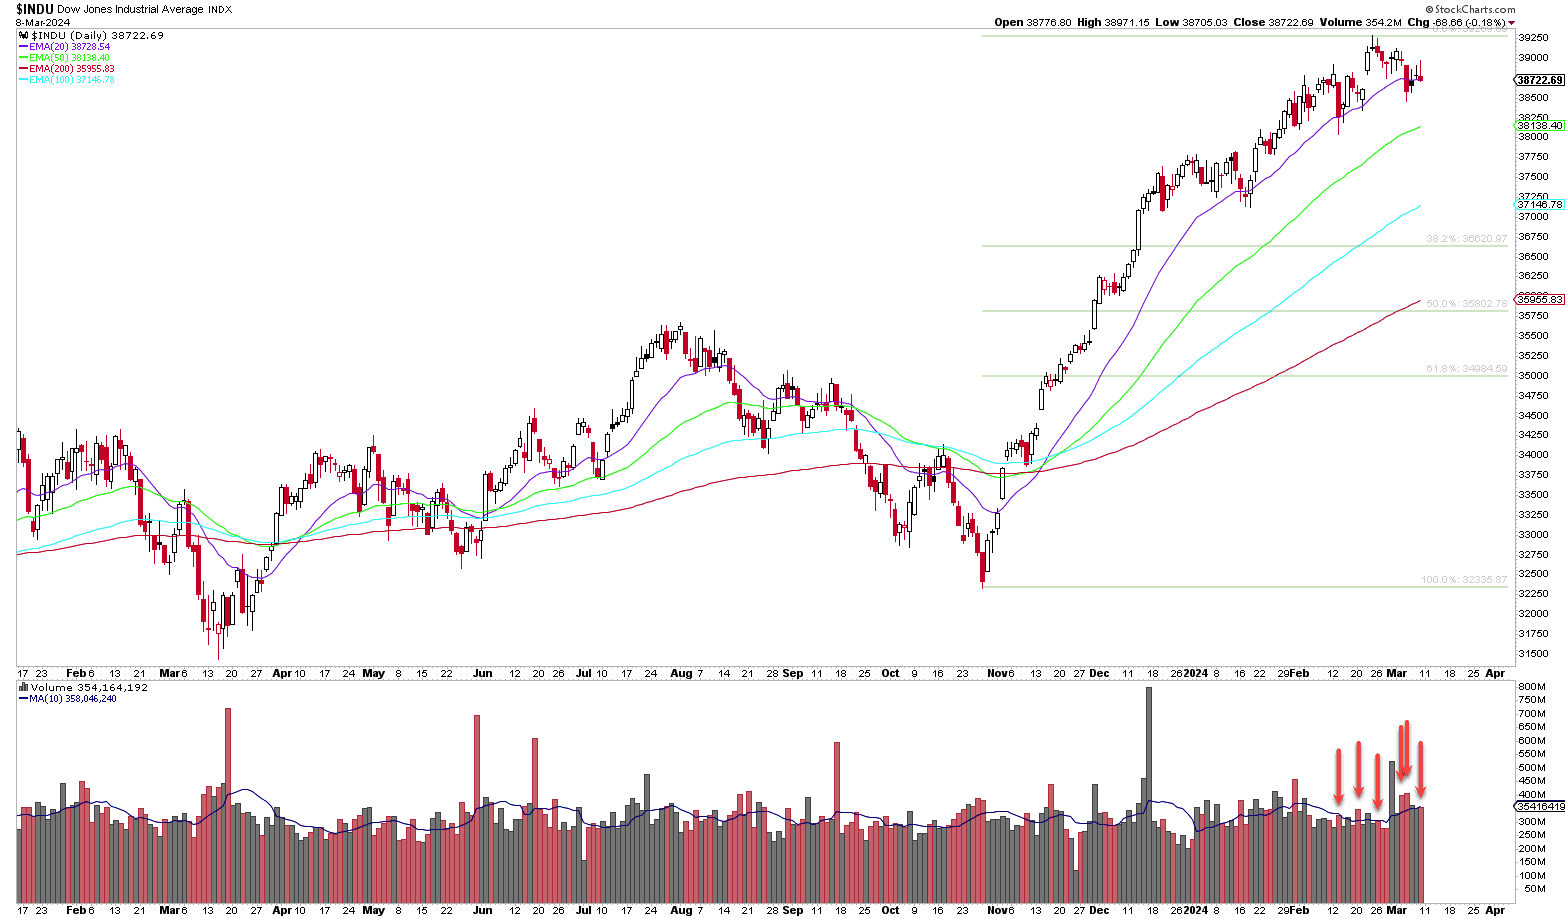
Dow Jones daily chart (red arrows = distribution days)
Dow lags behind the other indices
Of the four major and well-known US indices (S&P 500, Dow Jones, Nasdaq 100, Russell 2000), the Dow Jones is currently the weakest. While the Nasdaq 100 has gained around 9 % since the beginning of the year and the S&P 500 has risen by around 8 %, the Dow Jones is bringing up the rear with an annual performance of just under 3 %, behind the Russell 2000.
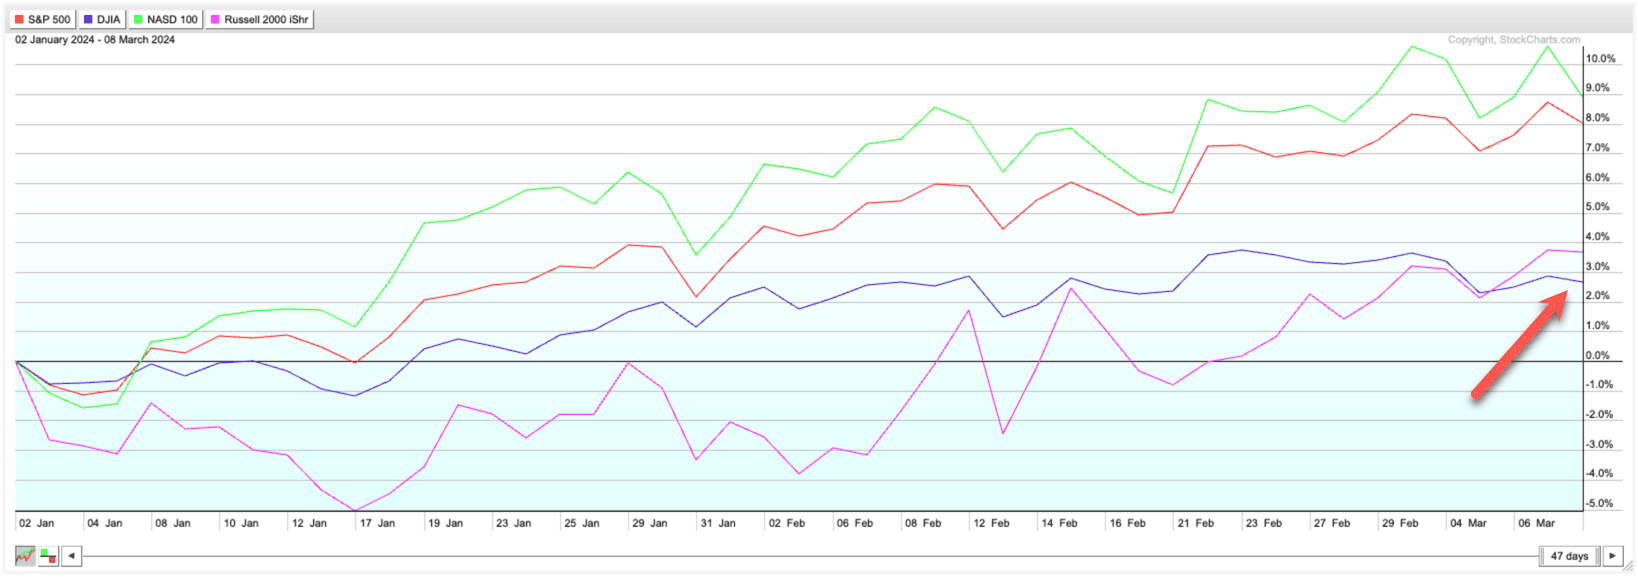
Performance chart US indices (green = Nasdaq 100, red = S&P 500, pink = Russell 2000, blue = Dow Jones)
Transportation index with relative weakness
The Dow Jones Transportation Index is also currently showing relative weakness and has not been able to generate any new highs recently compared to the above-mentioned share indices. According to Dow Theory and intermarket analysis, this is a warning signal that could call the trend into question. However, as all other share indices are in clear upward trends and almost all intermarket signals confirm the bull market, the warning signal in the transportation index should not be given too much importance at present. In any case, the transportation index should continue to be monitored. If it shows significant weakness, the likelihood that the Dow Jones Industrial Average will also come under pressure increases.
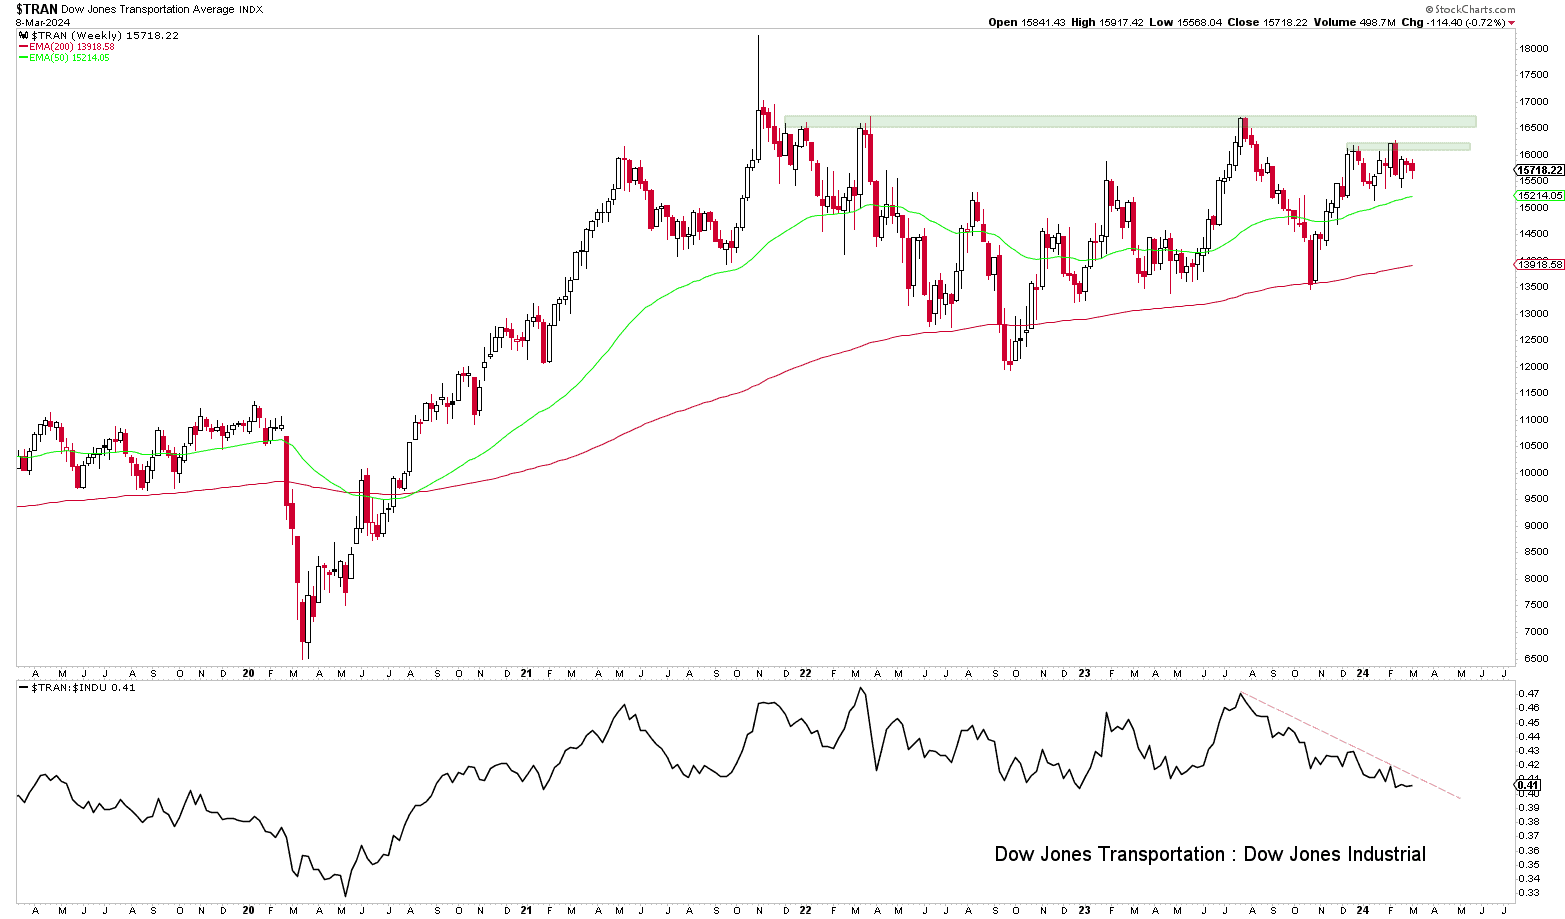
Dow Jones Transportation Index weekly chart
Conclusion: bull mode remains active
The Dow Jones is still in an uptrend with very strong momentum. The index has been trading in overbought territory for several weeks now and a correction is long overdue. The fact that this has not happened so far shows that in a strong bull market, indices can remain in overbought territory for several weeks or months and continue to rise. Bullish trades in individual stocks or index products therefore remain one of the preferred strategies at present.
Author: Tobias Schmid
Date: 11.03.2024