Dear traders, dear stock market friends.
The relative weakness of the Nasdaq 100 compared to the S&P 500 and the Dow Jones initially continued in the past trading week before a strong countermovement followed on Friday. With a drop of 1.9 % over the week and around 1000 points below its all-time high, the technology index still appears to be somewhat battered; however, the recovery on Friday gives reason to hope for a continuation of the overarching upward trend.
Rotation to “real economy” shares
After the sell-off over the course of the week to 24,500 points, the recovery on Friday cannot be attributed to a single trigger. Rather, it was a mixture of relief after the tech sell-off, slightly falling yields and a classic „buy the dip“ reaction.
Since the beginning of the year, the Nasdaq 100 has significantly underperformed the other major US indices:
- With a minus of 0.7 %, it is the only one with a red sign.
- The S&P 500 is up 1.3 % on a YTD basis,
- the Dow Jones gained 4.3 %
- and the Russell 2000 has already risen 7.7 %.
- Not to mention the Dow Jones Transportation Index, which topped the list of winners with a gain of 14.6 %.
This development reflects a sector rotation that has been observed since the beginning of the year. Capital is flowing out of highly valued technology stocks, which reached historically high index weightings last year. Traditional industrial and „old economy“ stocks in particular are benefiting against the backdrop of very strong economic growth.
It is important to note that even though an outperformance of the Nasdaq 100 is often seen as an indicator of a dynamic bull market (and relative weakness is interpreted as a warning signal), the current shifts are not necessarily negative for the market as a whole. On the contrary: if the price gains are no longer being driven by a few mega tech stocks but are spread across broader sectors, this tends to indicate a healthier market structure. The previously extremely high concentration in individual technology stocks was also a sign of exaggeration. The current rotation therefore looks like a normalization in which the market leadership is placed on a broader basis.
Nasdaq 100 defends 24,500-point mark
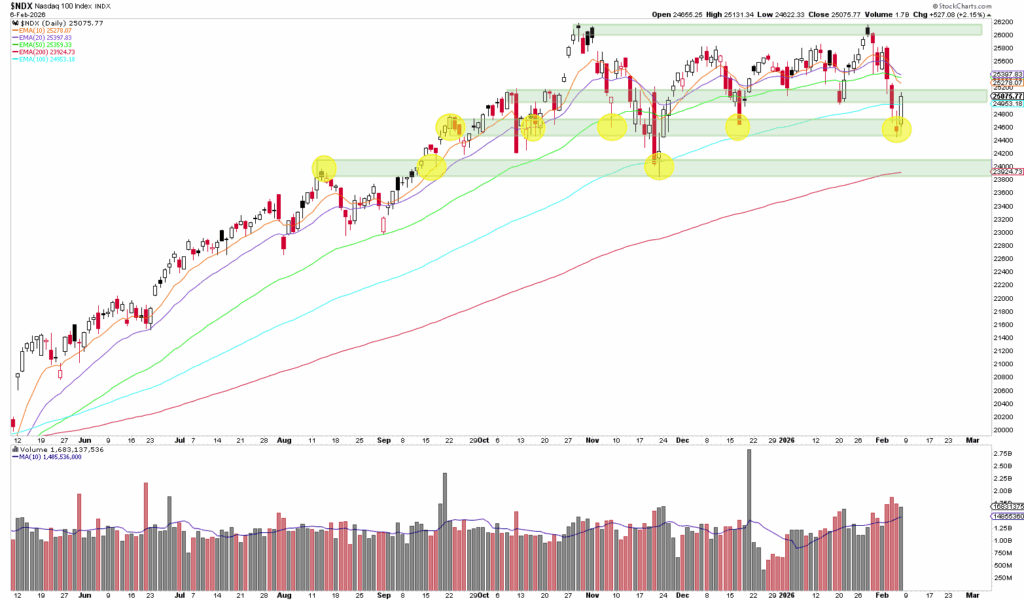
In chart terms, the 24,500 point zone was the decisive support last week. It was precisely from this price zone that the clear countermovement emerged on Friday.
Based on the support and resistance zones shown in the chart below, the following scenarios arise in the short to medium term:
- Bullish scenario: The short-term picture would brighten above 25,000 points. From a technical perspective, there would then be room for upward movement towards the overarching resistance/all-time high of around 26,000 points.
- Bearish scenario: On the downside, the area around the daily EMA-200 at around 24,000 points remains the line in the sand. A break would significantly cloud the chart picture and increase the risk of a downward acceleration.
Quarterly results & CapEx headlines
Further important impetus came from the reporting season last week: several heavyweights from the Nasdaq 100 presented figures, providing new arguments for the ongoing rotation within the US equity market.
- Advanced Micro Devices reported record sales in the fourth quarter on February 3, but the share price still reacted sensitively because the market was looking less at the past and more at the outlook and expectations for the coming quarters. The share lost around 12 % in value over the week, adding to the pressure on the AI and semiconductor sector.
- On February 4, the Alphabet operationally robust results and continued strong growth in the cloud business. However, the bigger headline was the investment outlook: Very high CapEx plans for 2026 (USD 175-185 billion) fueled the discussion about how quickly and how reliably the massive AI investments can be translated into measurable returns. Although the share price initially fell and opened with a down-gap, it quickly recovered.
- Also on February 4, the Qualcomm solid figures and thus signaled stability in the semiconductor segment. However, the price reaction here was also weak (-9.4 % on a weekly basis).
- This was followed on February 5 AmazonAWS growth was strong, but at the same time the focus was once again on capital expenditure. According to Reuters, the market is expecting CapEx in the region of USD 200 billion in 2026. An order of magnitude that caused significant price reactions in the aftermarket and also increased the already known concerns. Amazon shares lost 12.1 % over the week.
Especially in an environment in which sentiment has shifted away from AI momentum and towards cash flows and „real economy“ sectors anyway, such CapEx news had a boosting effect. This is because CapEx stands for investments in equipment, infrastructure and data centers, in the AI context primarily for expensive chips, servers, network and data center capacities. These expenditures are strategically important, but often burden free cash flow in the short term and can put margins under pressure because the money flows out today, while the economic benefits often only materialize over quarters or even years. This is precisely why the market is currently reacting so sensitively: the higher the investment requirement, the greater the focus on the question of when and how additional sales and profits will be generated and whether the expected return on AI spending justifies the high upfront expenditure.
Author: Tobias Schmid
Date: 09.02.2026