
Dear trader, dear stock market friends.
Following the correction on the stock markets during the summer months, we have seen a brilliant price rally with strong momentum since the beginning of November. The S&P 500 has risen around 500 points or 12 % virtually without pausing for breath.
What is currently driving the market
One of the main driving forces behind the upward movement is the change in investor expectations regarding the Fed's interest rate policy. Previously, "higher for longer" was considered a likely scenario, i.e. the assumption that the central bank will leave interest rates at a higher level for a longer period of time and will not immediately start to cut interest rates again after the rate hike cycle. In principle, high interest rates can be a negative factor for equity markets, whereas low interest rates or a loose monetary policy drive the market.
Interest rate cuts as early as 2024
There is a very useful tool for quantifying the market's expectations regarding the Fed's interest rate policy: The Fed Watch Tool of the CME. Based on the price movements of the so-called Fed Funds Futures - these are forward contracts used by investors to hedge against or speculate on changes in key interest rates - the Fed Watch Tool calculates the probability of future interest rate hikes.
Looking one year into the future, the Fed Watch Tool reflects the expectation that the interest rate in December 2024 will be 4.0 - 4.25 % with a probability of 28.8 %. The probability of an interest rate level of 4.25 % - 4.5 % is 28 %.
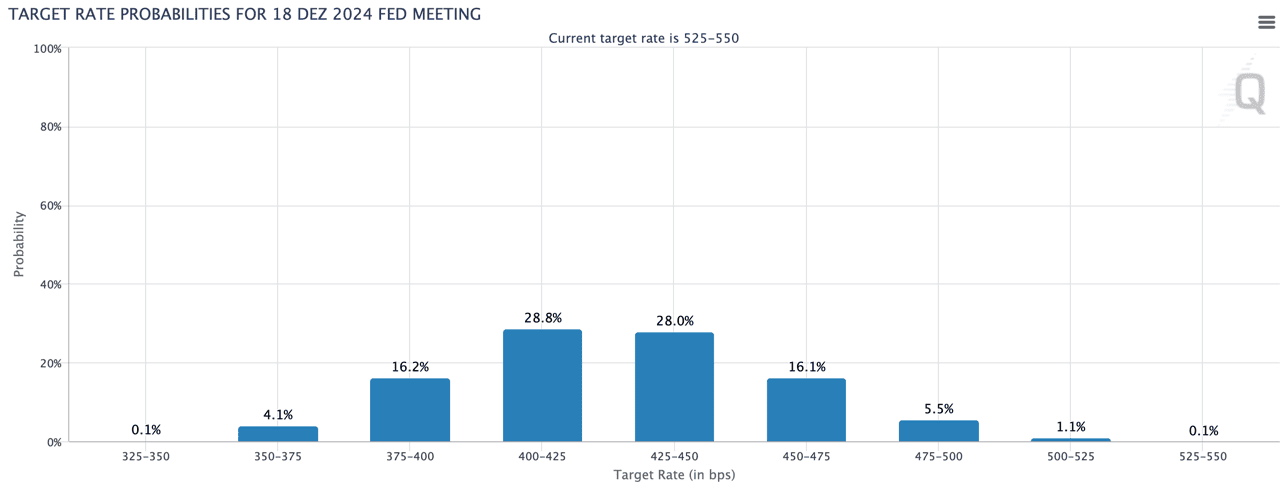
FED Watch Tool (source: https://www.cmegroup.com/markets/interest-rates/cme-fedwatch-tool.html)
The current target rate is 5.25 - 5.5 %. This means that there is a very high probability that there will be several interest rate cuts next year. Just a few days ago, the first rate cut was expected in March. Following the strong labor market data on Friday, expectations have shifted somewhat, so that the probability is higher that the first cut will not take place until May. However, this will also depend on the labor market and inflation data in the coming months.
Soft economic landing possible
The only problem with such a scenario is the following: Interest rate cuts of this magnitude are usually accompanied by a recession or at least a significant economic downturn, which in turn would be a headwind for the S&P 500.
In recent weeks, however, there have been increasing signs that the trend towards disinflation could continue without a hard economic landing in 2024. This "soft landing" scenario in conjunction with falling inflation rates, which form the basis for falling interest rates, would be an environment in which the S&P 500 would very likely continue to benefit next year.
Classification from a technical chart perspective
The S&P 500 has risen for six weeks in a row. At around 4600 points, the index is currently trading at the level of the annual high from July and around 200 points below the all-time high from January 2022.
S&P 500 weekly chart

S&P 500 weekly chart (source: TradingView)
Although the index is now overbought and the 4600-point mark represents resistance that has not yet been sustainably overcome, going against the strong trend is generally an extremely dangerous strategy. Jumping on the bandwagon does not currently offer an attractive risk/reward ratio, at least in the short term. In the medium term, however, there is a good chance that the trend will continue if nothing changes in the fundamental scenario described above.
S&P 500 daily chart
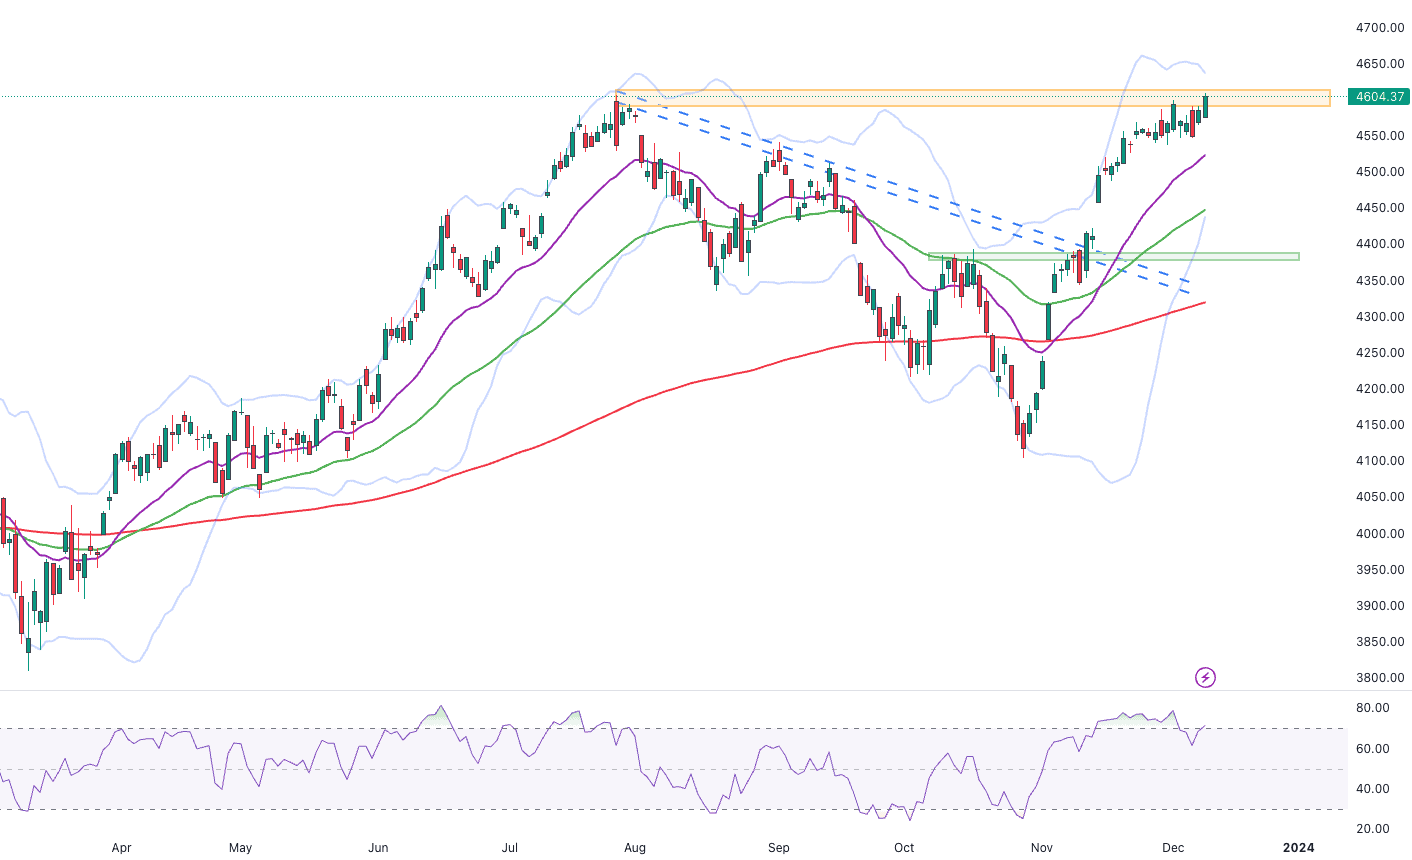
S&P 500 daily chart (source: TradingView)
Uptrend across a broad front
The signals from intermarket analysis also currently support the bullish scenario. We are not only seeing a few stocks driving the index upwards, but also a participation of the broad mass of stocks or the broad market. In addition, the sector rotation is continuing, which is also a positive signal. This means that we are seeing increased capital flows into offensive market sectors, while defensive market sectors are showing relative weakness.
Advance Decline Line
The AD line of the New York Stock Exchange has risen significantly in recent weeks, signaling that many stocks have risen in line with the upward movement of the index.

Advance Decline Line Daily (Source: stockcharts.com)
However, the weekly chart shows that we do not yet see a leading signal of a breakout.

Advance Decline Line Weekly (Source: stockcharts.com)
Many shares in an upward trend
Using the daily SMA 200 as an indicator of the long-term trend, we see that approximately 62 % of all stocks on the entire New York Stock Exchange are currently above the SMA 200. (As far as the S&P 500 is concerned, around 66 % of all stocks are above the SMA 200).
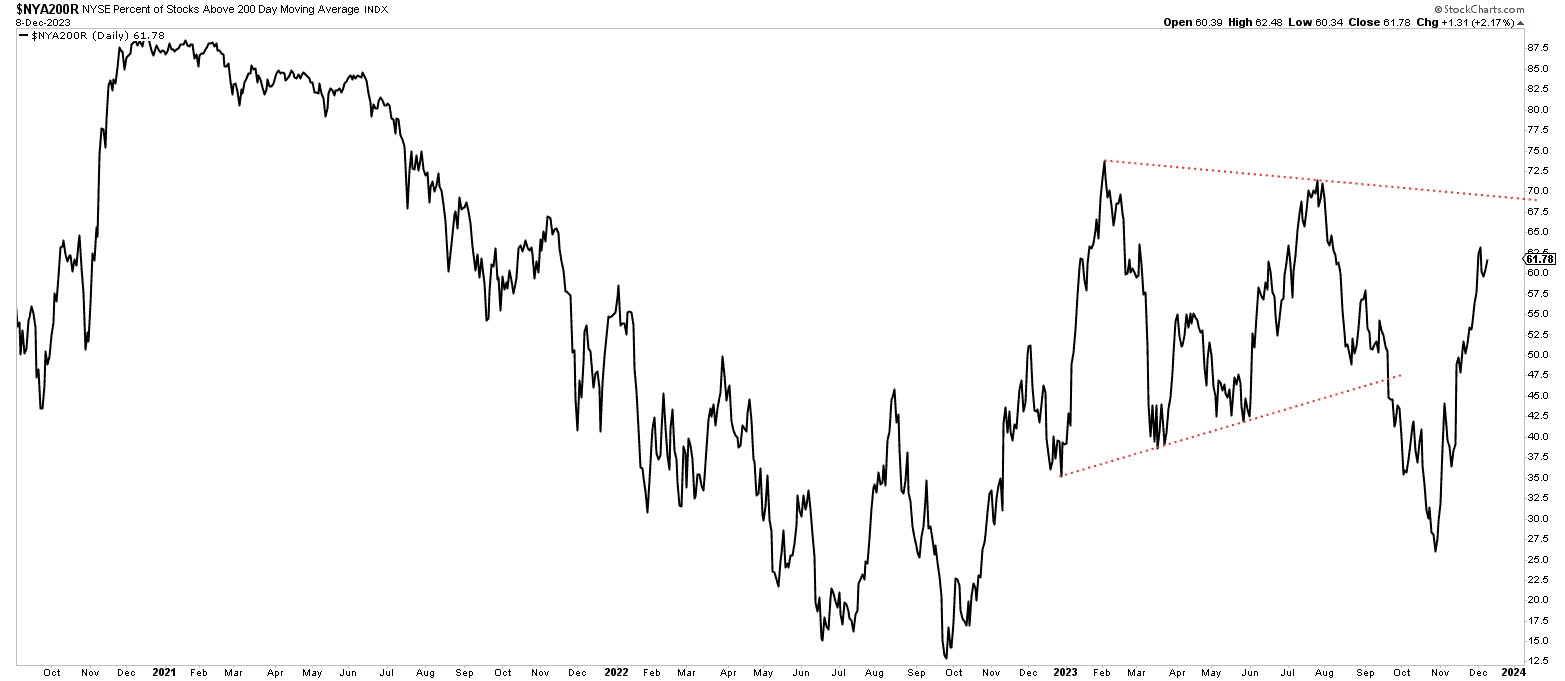
Number of shares above SMA 200 on the NYSE (source: stockcharts.com)
Conclusion: Overbought in the short term, opportunity for trend continuation in the medium term
Following the strong price rally over the past six weeks, the S&P 500 is facing a short-term resistance area. A correction already appears to be overdue. The fact that this has not yet occurred can also be seen as a sign of strength, as the smallest setbacks have always been bought immediately. Now that expectations of the Fed's interest rate policy have changed and the intermarket analysis is also providing positive signals, there does not seem to be much standing in the way of a continuation of the upward trend and the S&P 500 reaching new highs. However, this scenario needs to be confirmed by fundamental data in the coming weeks and months. A rapid return of inflation, an overly strong labor market or a sharp economic slowdown could create headwinds. In the current environment, the use of covered call strategies, such as cash-secured puts on equities or ETFs or the sale of vertical spreads, can be interesting.
Author: Tobias Schmid
Date: 11.12.2023