Dear traders, dear stock market friends.
The topics that we traders and investors usually deal with are technical analysis, intermarket analysis, monetary and interest rate policy, economic indicators, etc. The fact that the financial markets are also susceptible to unforeseen political and geopolitical events has been proven once again in recent days. The military escalation in the conflict between Israel and Iran took the markets by surprise on Friday. The fighting continued over the weekend and it is currently impossible to predict whether there will be a new escalation this week or whether the situation is likely to calm down soon. The reaction of the stock markets on Friday was comparatively moderate. However, even and especially in such situations, it is important not to react emotionally and to focus in particular on analyzing the markets and capital flows.
Rebound after initial losses
After the S&P 500 futures were still trending positively on Thursday evening, a rapid downward movement followed on Friday night after it was announced that Israel had attacked targets in Iran. However, a significant recovery followed later on Friday and the S&P 500 index ended the weekend down just 0.4 % on a weekly basis.
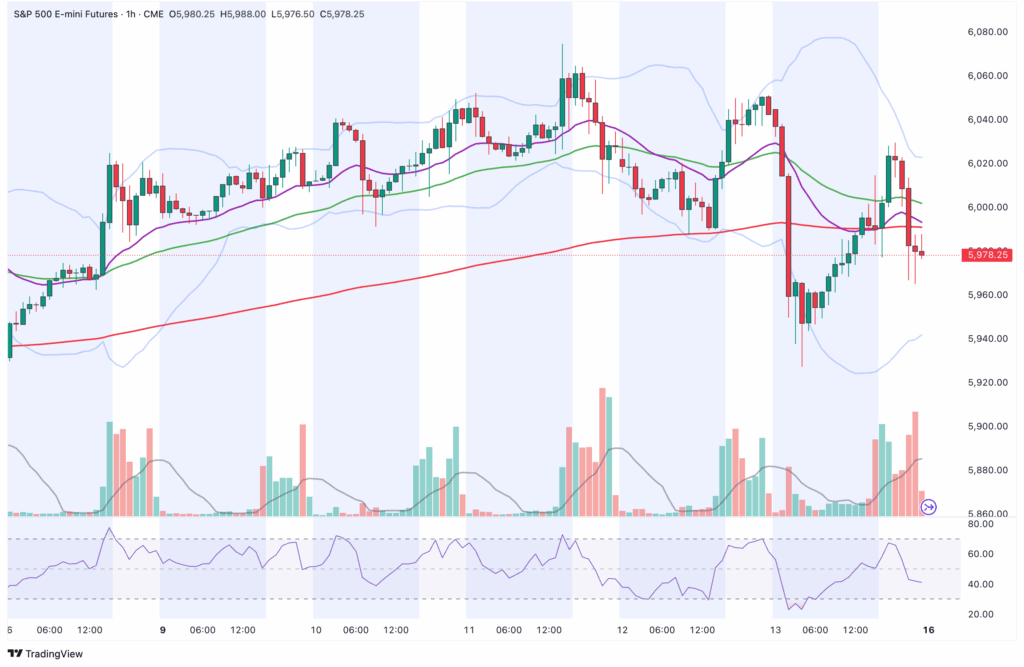
However, there has been little change in the overarching chart of the S&P 500: The index remains strong and the bullish signals predominate. However, after the very strong and rapid upward movement of recent weeks, a temporary recovery or consolidation would come as little surprise.
The most important short to medium-term support levels are at 5950 points and 5750 points.
- 5950 points: This is a horizontal support level in combination with the middle Bollinger Band or the SMA 20.
- 5820 & 5750: Points: The most important medium-term support zone for the index is currently around 5750 points. As you can see on the daily chart below, an important horizontal support is located here. The daily EMA 200 is currently at 5703 points and is likely to rise a few more points over the next few days, so that it could provide additional support. However, there is a good chance that the index will not fall that far and will find support earlier, in the area of the lower Bollinger Band in combination with the daily SMA 200 at around 5820 points.
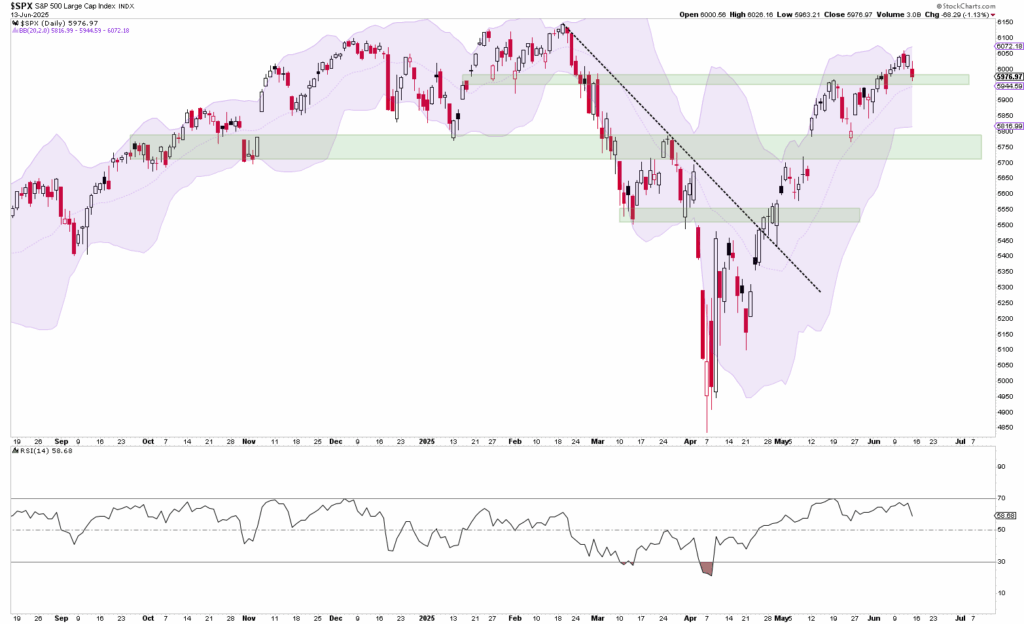
Ultimately, the price zone from 5700 to around 5820 points can be interpreted as a broad support zone. If the S&P 500 continues its correction this week, it would not be wrong to wait and see whether buyers enter the market at one of the aforementioned support levels and bullish signals such as candlestick reversal signals occur under high volume. If, on the other hand, the index falls below 5700 points and increased bearish volume is seen at the same time, the probability of prices falling further would be increased.
Advance Decline Line with new all-time high
A look at the Advance Decline Line shows that the bull case is to be preferred in the medium term. The AD Line reached a new high in mid-May. With the breakout above the local high on May 16, the AD Line confirmed the upward trend last week. If the AD Line breaks out to a new high, there is a high probability that the S&P 500 will also break out to a new high in the medium term. Unless a counter-signal from the AD-Line occurs quickly, which would neutralize the bullish signal, the bullish signal is valid.
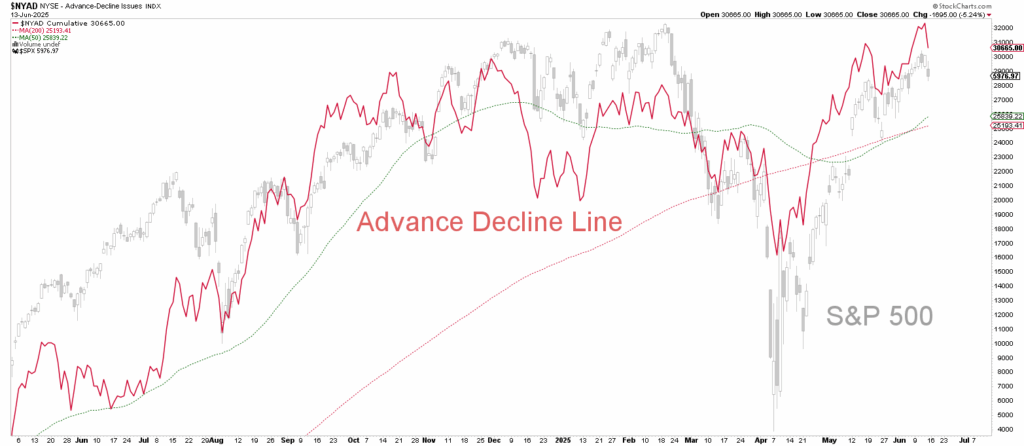
An analysis of the other market breadth indicators also shows a predominantly positive trend. However, the final impulse is still missing before the signals are actually clear and bullish again in the long term.
The number of stocks in the S&P 500 that are in an uptrend as measured by the SMA 200 has also increased significantly in recent weeks, but is still only 50 %.
The difference between the number of shares with new 52-week highs and the number of shares with new 52-week lows also turned positive in the last few days/weeks, but was already just below the zero line again on Friday.
Performance of the S&P 500 market sectors
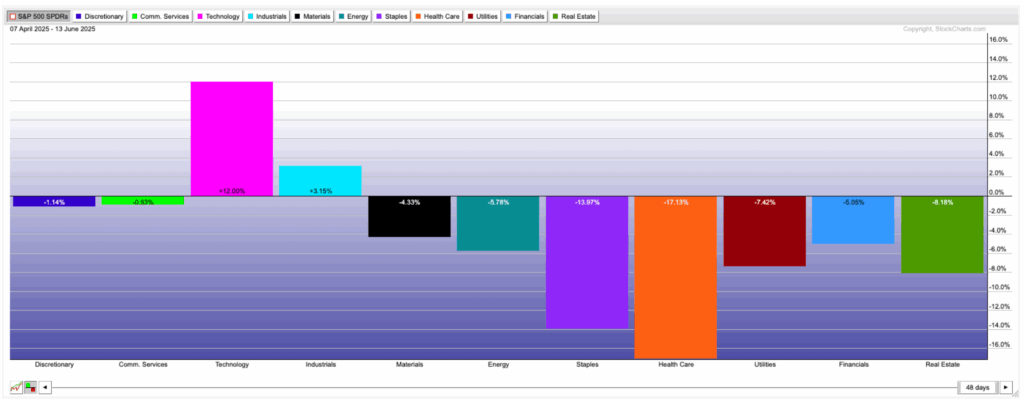
We are currently seeing a further confirming signal for the upward trend from the sector rotation. Although there was a slight relative weakness in the offensive market sectors of the S&P 500 last week and an outperformance of defensive sectors, an analysis of medium-term capital flows shows that investors have been increasingly investing in procyclical and therefore riskier or more offensive market sectors again since the low point in the S&P 500 on April 7.
The following chart shows the relative performance of the 11 market sectors of the S&P 500. The strongest sector by far since April 7 has been Technology. It has outperformed the S&P 500 by 12 %. The offensive sectors Consumer Discretionary and Communication Services were at least able to (almost) keep up with the performance of the S&P 500. By contrast, the defensive sectors Utilities, Consumer Staples and Health Care showed relative weakness or underperformance.
Conclusion: focus on continuation of the upward trend
Due to the armed conflict between Israel and Iran, there is a risk of further price falls in the short term. However, a look at the past shows that political stock markets have short legs and the market could possibly tick off the issue in a few days, provided there is no further and even more violent escalation spiral.
Bullish signals continue to predominate in technical and intermarket analysis. Setbacks therefore initially represent opportunities for new long commitments. However, if the above-mentioned technical support zones are breached and the sector rotation and market breadth generate bearish signals at the same time, the bull case would be invalid for the time being.
Author: Tobias Schmid
Date: 16.06.2025