The optimal Analysis tool
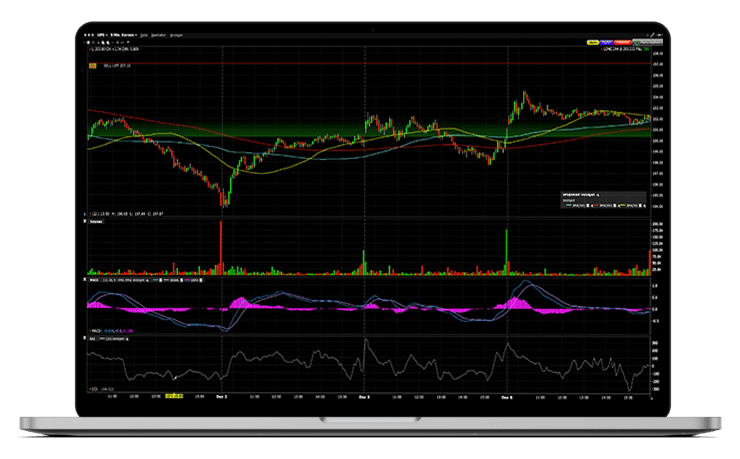
ChartTrader offers many options for comprehensive technical analysis of stocks and other securities. You can draw trendlines and access hundreds of indicators. You can choose between different chart types, set the time period and, of course, information about the traded volume, daily lows and highs of the considered security can be displayed or simply adjust the chart colors.
With ChartTrader you have the optimal analysis tool at hand, which is clear and easy to use in addition to many practical functions.
Show buy and sell prices for multiple securities as a chart
Create alarms
Manage, modify and transmit orders
Technical analysis features
Define parameters yourself
Multi-chart window
Display with graphical chart indicator
Variety of Parameters
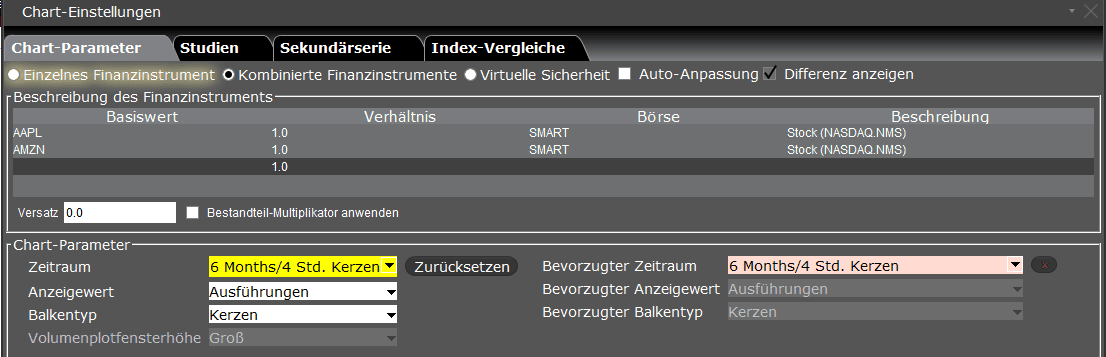
You can display the buy and sell prices for several securities as a chart. You can set this in the order window in the top menu. To select a chart for several securities, proceed as follows:
1. select an underlying, use the right mouse button and select "Charts", then "New chart".
2. click on "Combined Contracts" at the top of the order window
3. in the contract window you can select the desired securities
4. enter an offset amount if desired
5. select the time period you want to be displayed
6. click OK

Open a custody account now and ChartTraderuse
Use the modern trading software with exclusive trading tools in your securities account at CapTrader.
Trade worldwide at best conditions with first class customer service.