Practical tool for traders
Given that puts and calls are traded on most stocks in the options markets, the probability distribution (WV) for these stocks can be calculated as implied by the prevailing option prices. We call this the "WV of the market" because it results from the consensus of option buyers and sellers, even if many are unaware of the implications.
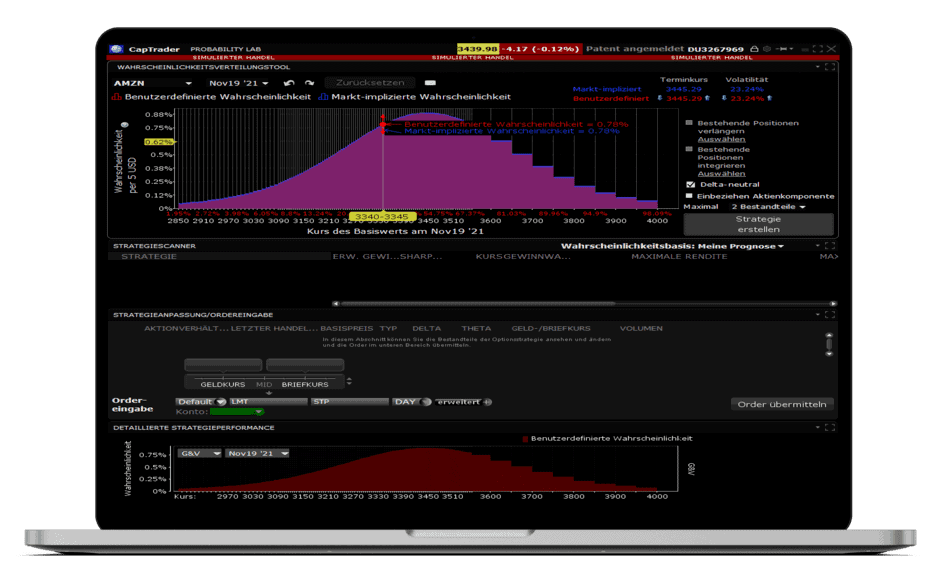
The highest point of the graph of the WV implied by the market is close to the current share price plus interest minus dividends. The further you move to the right or left from this point, the more the probabilities decrease - first slowly, then faster and finally slower again, but never quite reaching the value 0. The forward rate is the expected rate at expiration implied by the WV.
The curve is almost symmetrical, except that slightly higher prices have a higher probability than slightly lower prices, and significantly higher prices have a lower probability than prices that are close to 0. The reason for this is that prices tend to fall faster than they rise and all companies have some probability of a catastrophic event occurring.
In the Probability Lab, you can view the WV that we determine by means of the option prices currently prevailing in the market on stocks or commodities for which options are offered. All you have to do is enter the corresponding symbol.
The WV curve changes according to the changes in the bid and ask price of the option on the stock exchange. Now you can grab the horizontal bar of each interval and move it up or down if the probability of that interval's price occurring seems lower or higher than that implied by the market consensus. You will notice that all other bars move with you as you move one of the bars, with bars farther away moving in the opposite direction, since the sum of all probabilities must equal 1.00. Please also note that the WV of the market will still be displayed in blue, while your forecast will be displayed in red. Clicking the "Reset" button will cancel all your changes.
The market tends to assume that all WVs are close to the statistical average of past results unless a definitive corporate action, such as a merger or acquisition, is pending. If you follow the market or the specifics of certain stocks, industries or commodities, you may not share this view. Occasionally, you will arrive at a different assessment of the likelihood of certain events and, consequently, certain price movements. This tool gives you the opportunity to graphically represent and illustrate these personal assessments and to execute transactions based on these assessments. If your estimation of the probability distribution does not differ from the WV of the market, you should not execute a transaction, because every transaction executed on the basis of the WV of the market has an expected profit of zero (minus transaction costs). The sum of all possible outcomes (profit or loss in each interval) multiplied by the associated probability equals the statistically expected profit. Under the WV of the market, this value is zero for each transaction. You can take any specific transaction as an example and calculate the expected profit yourself to convince yourself of the accuracy of this statement. So, every time you make a transaction with an expected profit, you are basically making a bet that the WV of the market is wrong and your estimate is correct. This fact is true whether you are aware of it or not. Therefore, it is quite worthwhile to be aware of this fact and train your skills with the help of this tool.
Calculation of WV on the basis of option prices
The prices of put and call options on shares are determined by the WV. However, it is interesting to note that we can reverse this process. That is, if option prices are given, WV implied by these prices can be easily derived. It is not essential to know how this works, and you can easily skip the following section. However, if you are interested in understanding the procedure, the following is a method that should be understandable to any high school student.
Suppose that a security is trading at a price of $500 per share. What is the probability that the price will be between 510 and 515 when the option expires in approximately one month? Suppose the 510 call is trading at a price of $6.45 and the 515 call is trading at a price of $4.40. You can buy the 510 call, sell the 515 call, and pay $2.05.
- If the price is below 510 when the options expire, you lose $2.05
- If the price is between 510 and 515, your profit will be the average of your loss at a price of 510, namely $2.05, and your gain
at a rate of 515, namely $2.95, i.e. $0.45 - If the price is above 515, you win $2.95.
Further, assume that we have previously calculated that the probability of a stock price below a value of 510 is 56%, or 0.56.*
Assuming that options are traded "fairly", i.e., no profit or loss trades can be made if the WV of the market is correct, 0.56 * -2.05 + X * 0.45 + Y * 2.95 = 0, where X represents the probability that the stock price will be between 510 and 515, and Y represents the probability that the stock price will be above 515.
Since all possible occurring rates together have a probability of 100%, this gives 0.56 + X + Y = 1.00; thus X = 0.06 and Y = 0.38.
*To calculate the total WV, you need to start at the lowest strike price and estimate for the probability of a price below that. This will be a small number so you will not make too serious a mistake.
Derivation of the price of a call or put option
If you have read this far, you are probably also interested in how to derive the price of a call or put option from the WV.
For a call, you can take the median stock price of each segment above the strike price, subtract the strike price from it, and multiply the result by the probability that a price in that segment will occur. For the ending, you need to estimate a low probability and use a price that is about 20% above the upper strike price. The sum of all results is the call price.
For puts, take the mean share price of each segment below the strike price, subtract it from the strike price, and multiply the result by the probability. For the last segment between 0 and the lowest strike price, I would take 2/3 of the lowest strike price and guess the probability. Again, add up all the results to get the price of the put.
Some may hold the opinion that all of this is rather imprecise estimation. And the answer is: Yes, this is the nature of price predictions – they are imprecise. To claim otherwise would be foolish. Everyone estimates. Nobody knows anything definitively. To laypeople, it might seem like computer geeks are performing highly precise calculations with complex models. However, the simple truth is that nobody knows the probabilities, and your educated guess based on your understanding of the situation can sometimes be better than that of the computer experts based on past developments.
Please note that we do not discuss interest effects in this explanation. Also compensate for the fact that options can be exercised early, which makes them more valuable. This additional value must be taken into account when calculating the total WV. However, this is only significant for deep in-the-money options. By using calls to calculate the WV of high prices and puts to calculate the WV of low prices, you can avoid this problem.
Background: The probability distribution (WV)
The first concept to understand is the probability distribution (PD), which is basically just a more technical term for saying that for all possible future outcomes, there is a certain chance or probability that they will occur. The WV tells us exactly how likely certain outcomes are to occur. Examples:
What is the probability that the daily maximum temperature in Hong Kong on November 22 next year will be between 21 and 22 degrees Celsius?
We can consult the temperature records of November 22 for the last hundred years. Draw a horizontal line and mark on it a scale from 16 to 30 degrees. Then count the number of temperature records that fall in each degree interval. The number of temperature events in each interval is the percent probability that the temperature on November 22 will be within that interval. This is assuming that the future behaves the same as the past. This method works because we used 100 records. Otherwise, the result must be multiplied by one hundred and divided by the total number of all records used to get the percentages. To achieve greater accuracy, more data points would be needed. For example, we could use data from November 20 to 24.
Thus, we draw a horizontal line that spans the entire Celsius scale under consideration and has the height at each degree that corresponds to the set of data points in that interval. Using the records for November 20-24, we would get a larger amount of data and achieve greater accuracy, but we would have to multiply the resulting counts by 100 and divide by 500.
These horizontal lines give a graph of our WV. They index the respective percentage probability that the temperature will move in one of these intervals. If we want to find out the probability that the temperature will be below a certain level, we have to sum up all probabilities in the segment below this limit. Similarly, we sum up all probabilities above the selected level to get the probability of a higher temperature.
Consequently, the graph indicates that the probability for a temperature between 21 and 22 degrees Celsius is 15%and the probability for a temperature below 22 degrees Celsius is 2 + 5 + 6 + 15 = 28%. the probability for a temperature above 22 degrees is 100 – 28 = 72%.
Please note that the sum of the probabilities of all segments must add up to 1.00, i.e. there is a probability of 100% that there will be any temperature in Hong Kong on that date.
If even more data were available, we could further refine our WV by shrinking the intervals. This would shrink the horizontal lines to many points giving a smooth, bell-shaped curve.
Application to share prices
Just as it is possible to assign probabilities to future temperature intervals, this is also possible for intervals of future stock, commodity or currency prices. However, there is an important difference. While temperature development follows roughly the same pattern year after year, this does not apply to stock prices, as these are more strongly influenced by fundamental factors and human decisions.
Therefore, the answer to the question "What is the probability that the price of ABC will be between 21.00 and 22.00 on November 22?" is more of an educated guess compared to the temperature forecast for Hong Kong.
The information we work with is the current share price, information about its movements in the past, and fundamental data about the company's future prospects, industry, economy, currency, international economic and political aspects, etc., which may influence investors' opinions about the share price.
Predicting the future price of a stock is an imprecise process. Predicting the WV of future stock prices seems to leave more room for flexibility, or we become more aware of the probabilistic nature of this process. The more information and insight we have at our disposal, the better the chances of being right.
The best transactions and their possible consequences
Please take the opportunity and move the bars in the chart to get familiar with the adjustment of the WV. We will show you combination transactions that are likely to result in a positive outcome based on the WV you set. You can decide whether you want to be shown the "optimal transactions", which consist of combinations of up to two, three or four option components. We will show you the three best combination transactions, along with the respective expected profit, Sharpe ratio, net debit or net credit, percent probability of profit, maximum profit and maximum loss, and associated probabilities for each transaction based on your WV and applicable margin requirements.
The best trades are those with the highest Sharpe Ratio, or the highest ratio of the expected profit to the variability of the outcome. Keep in mind that the expected profit is by definition the sum of the profit or loss multiplied by the associated probability you set for all possible prices. In the graph below, you can see the projected profit or loss that would result from the transaction and the corresponding probability at each price point.
The interactive graph shown below is a rough simulation of the Probability Lab, a real-time based application we provide to our customers. Similarly, the "best transactions" are shown for illustrative purposes only. Unlike the actual application, these are not optimized for your specific distribution.
If you like a transaction in our software, you can increase the quantity and submit the order.
You are currently viewing placeholder content from Vimeo. To access the actual content, click the button below. Please note that doing so will share data with third-party providers.
More InformationThe Market use
In the Probability Lab, you can view the probability distribution (WV) that we determine using the option prices currently prevailing in the market on stocks or commodities for which options are offered. All you have to do is enter the corresponding symbol.

Open a securities account now and get the Probability Lab use
Use the modern trading software with exclusive trading tools in your securities account at CapTrader.
Trade worldwide at best conditions with first class customer service.