Your Broker for worldwide trading

Dow Jones

The Dow Jones Industrial Average (DJIA) or Dow Jones Index is one of the oldest stock indices in the USA, created in 1884 by Charles Dow and Edward Jones, the founders of the Wall Street Journal and Dow Jones. Charles Dow created the index to track the performance of the US stock market. The Dow Jones Index on the New York Stock Exchange (NYSE) consists of 30 of the largest US companies and, alongside the Dow Jones Transportation Average, is the oldest stock index still in existence in the USA.

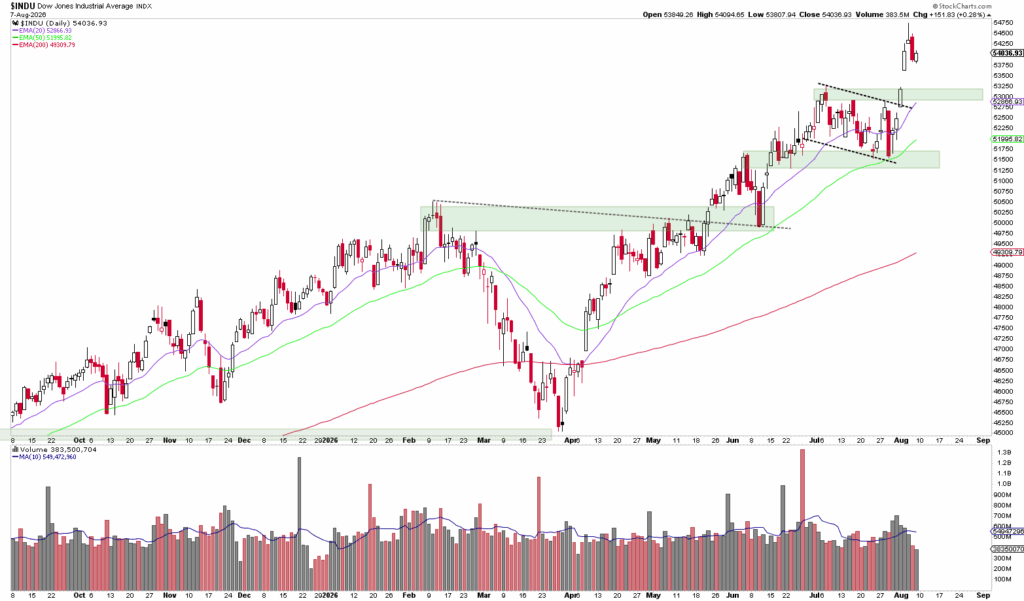
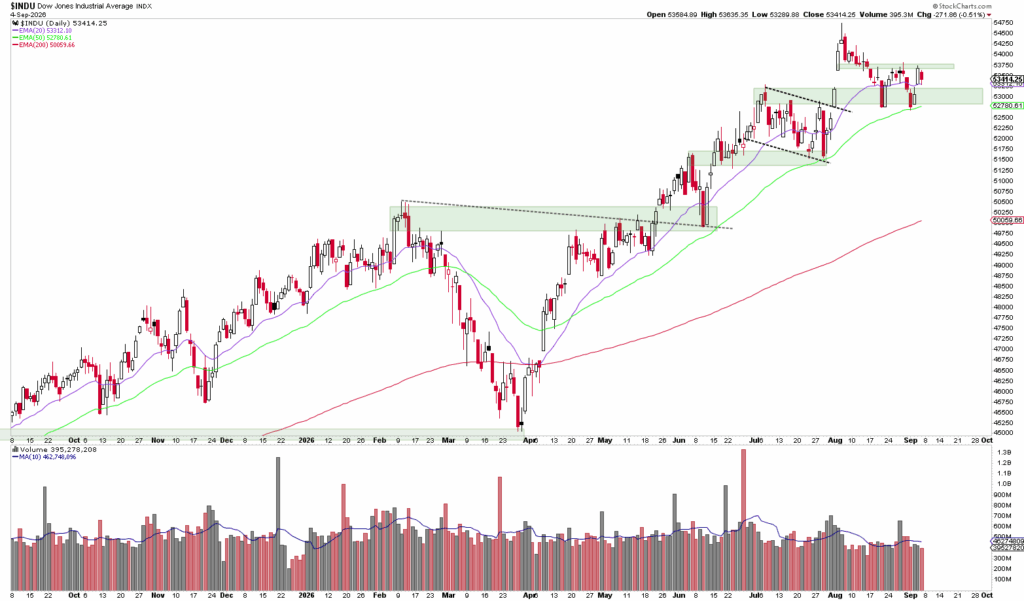
Dear traders, dear stock market friends. Over the past two trading weeks, the sentiment in the stock markets has changed significantly. The uncertainty...
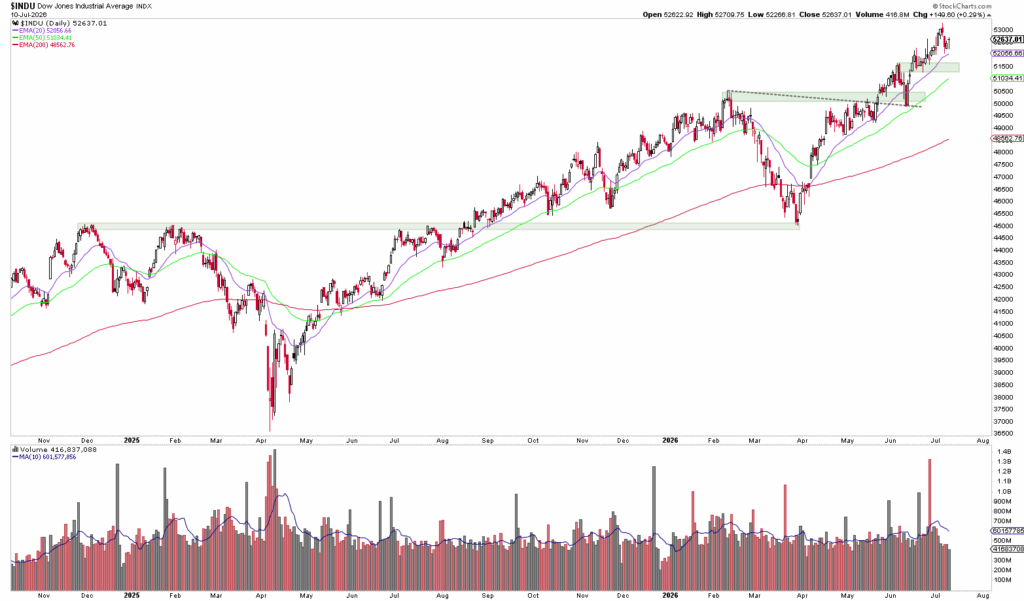
Dear traders, dear stock market friends. Last week, the Dow Jones made history and surpassed the 53,000 mark for the first time…
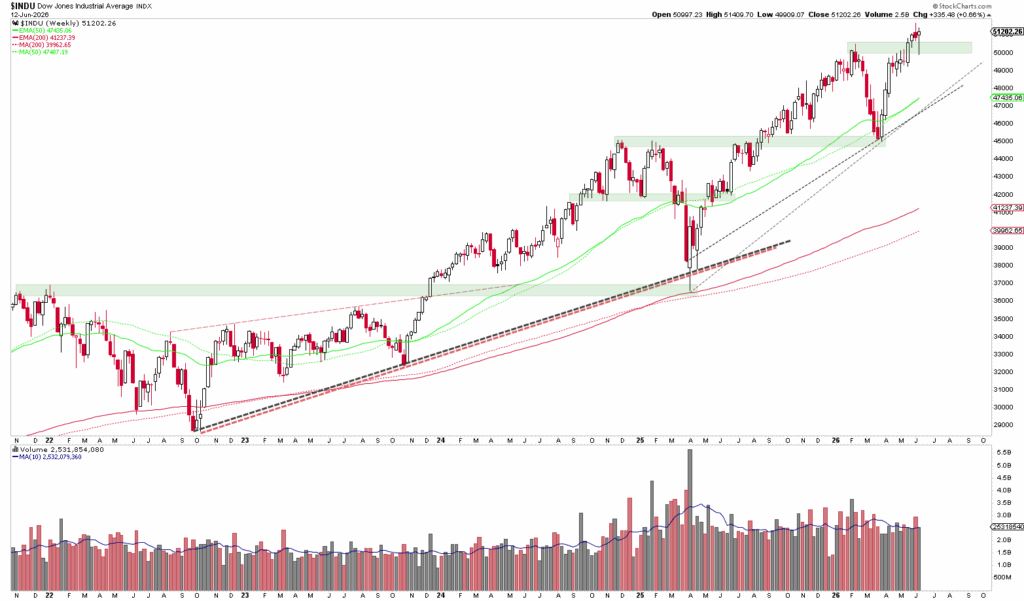
Dear traders, dear stock market friends. The Dow Jones ended a volatile trading week with a gain last Friday. In the meantime…

Dear traders, dear stock market friends. While the S&P 500 and the Nasdaq 100 have already reached several new all-time highs in recent weeks...
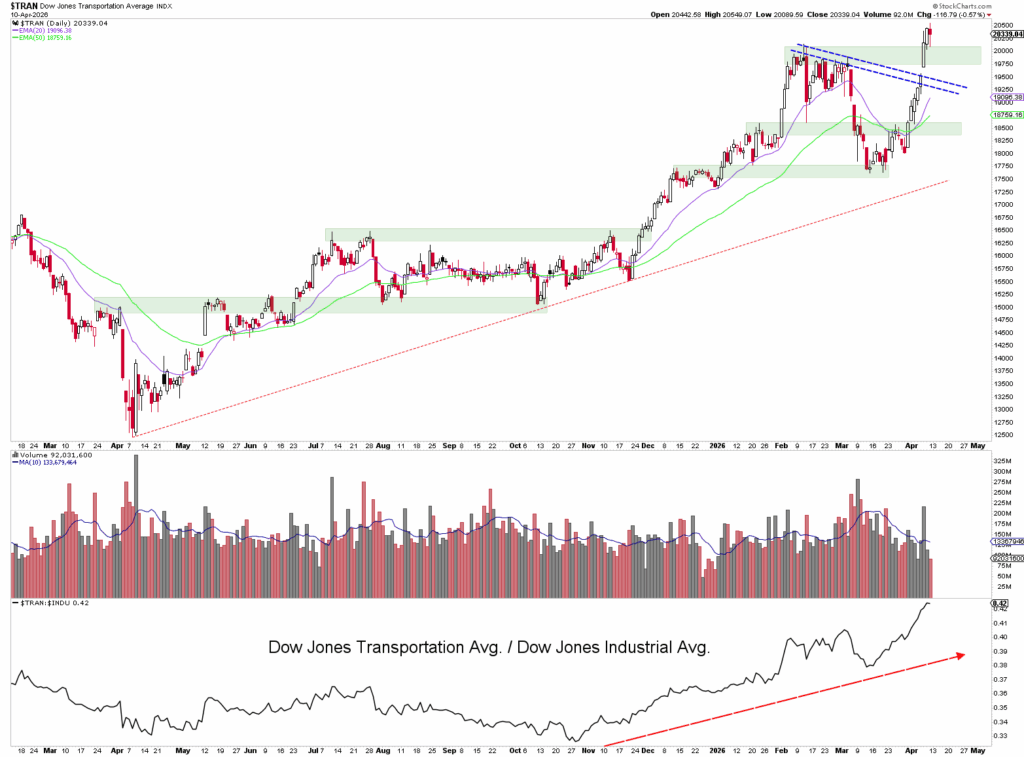
Line chart of the Dow Jones Transport Index at or near its all-time high, with trading volume shown below; technical trendlines and moving averages are displayed. The bottom panel shows the ratio to the Dow Jones Industrial Average.

Dear traders, dear stock market friends. With an increase of around 3.0 % the Dow Jones Industrial Average has in the past...
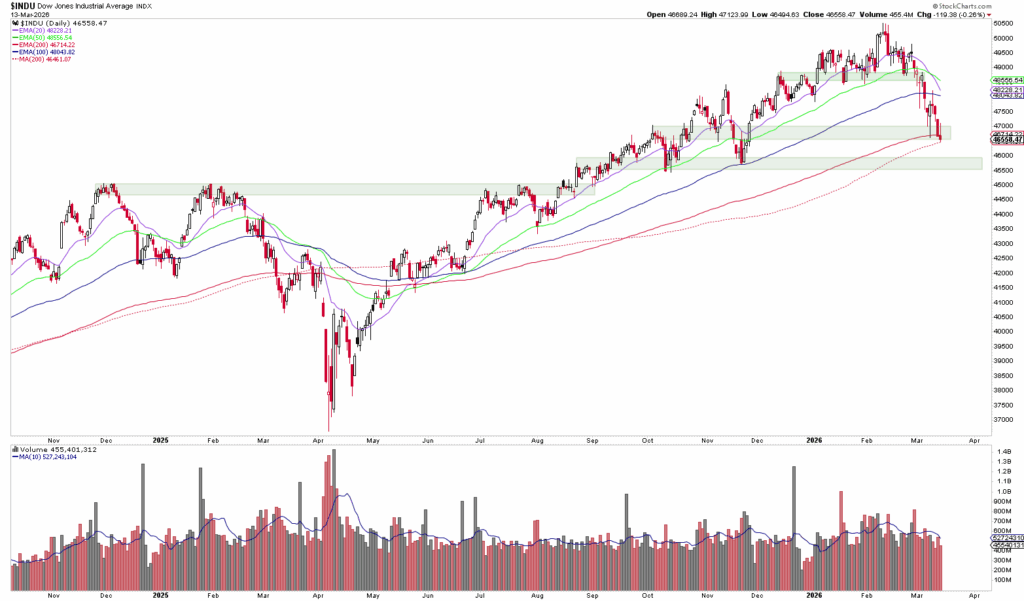
A stock chart of the Dow Jones Industrial Average from the end of 2022 to the beginning of 2024 shows price declines and increased trading volume, with the 200-day line and the important support zone clearly highlighted.

Dear traders, dear stock market friends. The Dow Jones Industrial Average continued its correction in the past trading week and closed the week...
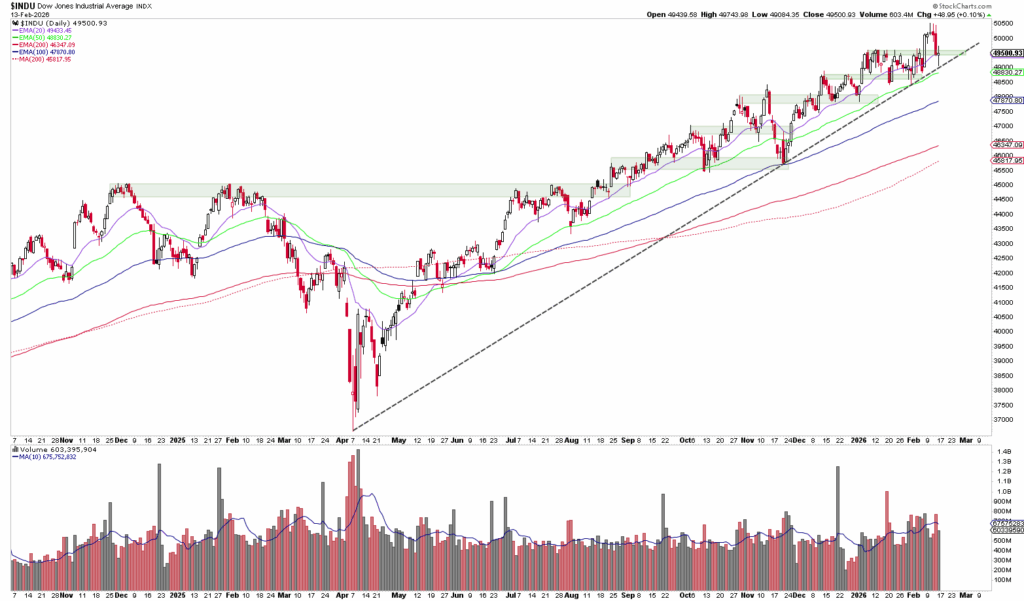
A stock chart depicting the Dow Jones Industrial Average Index from mid-2019 to early 2021 shows price performance, moving averages, trading volume and a dashed trend line highlighting any correction as a potential opportunity for investors.

Dear traders, dear stock market friends. On February 6, the Dow Jones broke through the 50,000-point mark for the first time before...

Line chart showing the performance of the Dow Jones Industrial Average Index from the beginning of 2020 to the end of 2021, with volume bars and moving average lines highlighting positive growth prospects and a general upward trend.

Dear traders, dear stock market friends. The Dow Jones is up 2.7 % since the beginning of the year and with this performance is clearly...
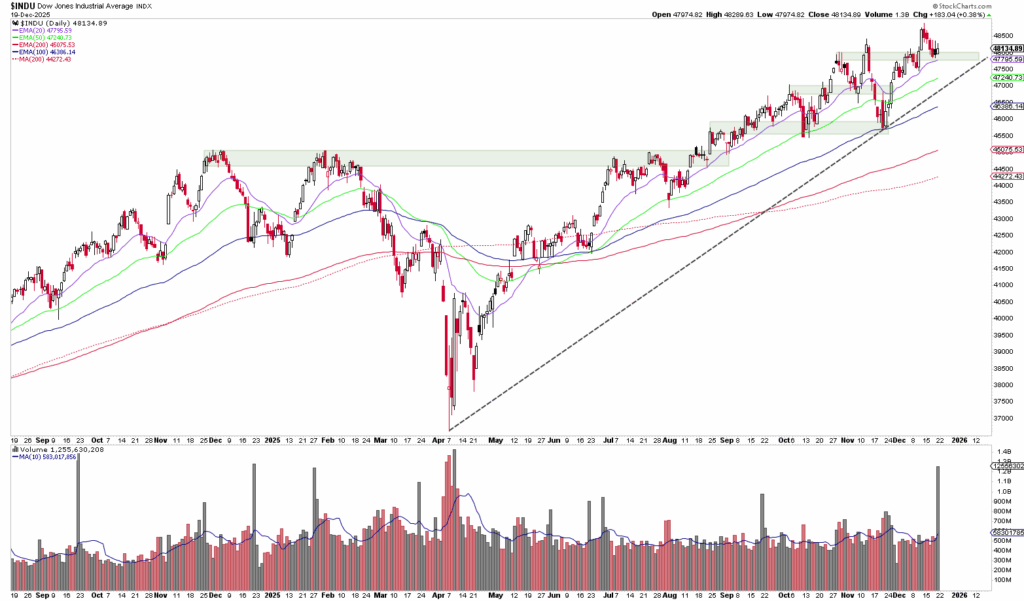
Line chart showing the price movement of the Dow Jones Industrial Average from August 2020 to December 2021, highlighting the periods when the index consolidates and reaches the record high, with multiple moving averages and volume bars below.

Dear traders, dear stock market friends. After the Dow Jones reached a new all-time high the week before last and peaked at...

A daily candlestick chart of the Dow Jones Industrial Average that is great for analyzing price trends, moving averages, trading volume and down arrows.

Dear traders, dear stock market friends. The Dow Jones Industrial Average ended the week on Friday with a significant recovery, remaining on the...

Email:

info@captrader.com

Send e-mail

Phone:

Hotline (Germany)
0800-8723370

Hotline (International)
00800-08723370

Further contact options