Your Broker for worldwide trading

Dow Jones

The Dow Jones Industrial Average (DJIA) or Dow Jones Index is one of the oldest stock indices in the USA, created in 1884 by Charles Dow and Edward Jones, the founders of the Wall Street Journal and Dow Jones. Charles Dow created the index to track the performance of the US stock market. The Dow Jones Index on the New York Stock Exchange (NYSE) consists of 30 of the largest US companies and, alongside the Dow Jones Transportation Average, is the oldest stock index still in existence in the USA.
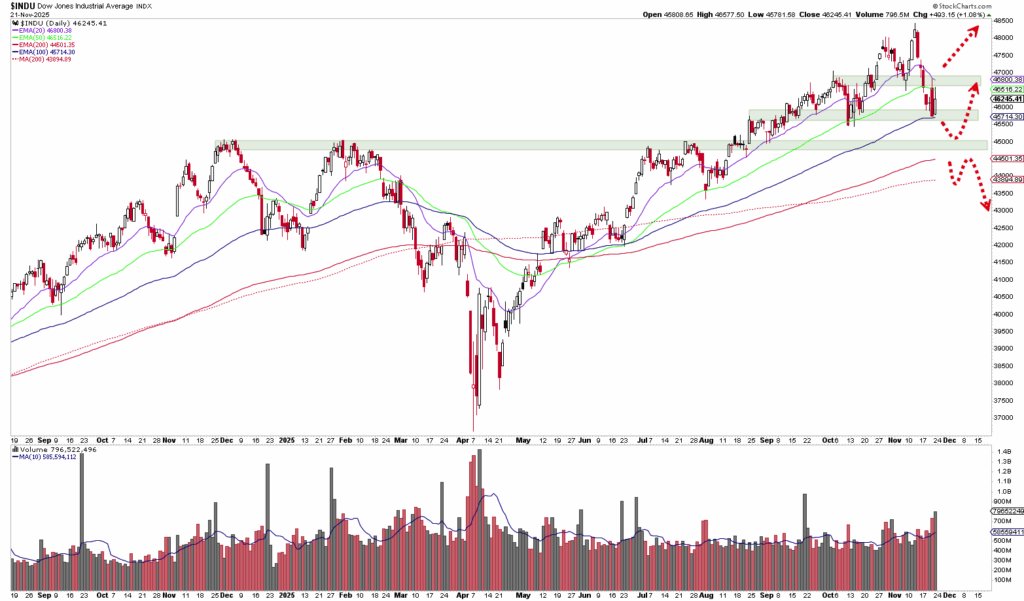
A candlestick chart of the Dow Jones Industrial Average on a daily basis with moving averages, volume bars and a highlighted resistance zone near the all-time high from the end of 2022 to the end of 2023.

Dear trader, dear stock market friends, With a gain of around 2.2 % and the breakout above the 47,000-point mark, the Dow...

A candlestick chart of the Dow Jones Industrial Average shows the price development from 2018 to 2024 - with moving averages, support zones, trend lines and annotated profit points - and highlights a breather. The volume bars appear below.

Dear trader, dear stock market friends, With a weekly performance of - 0.15 %, the Dow Jones ended the trading week last Friday...

Stock chart of the Dow Jones Industrial Average from September 2020 to September 2021, showing an uptrend with daily candles, moving averages, volume bars and highlighted support/resistance zones.

Dear trader, dear stock market friends, The Dow Jones Industrial Average has performed well in recent weeks. Since the spring...
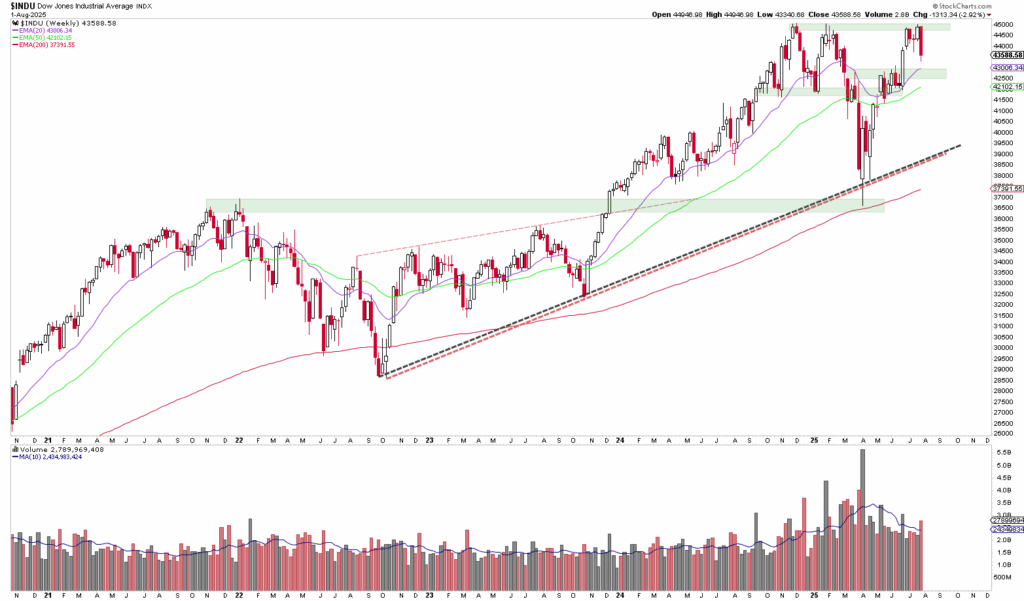
Line chart of the Dow Jones Industrial Average from 2017 to 2024 with moving averages, support/resistance zones, trend lines and trading volume bars below.

Dear trader, dear stock market friends. Since bottoming out on April 7, the Dow Jones has gained more than a third of its...

A candlestick chart shows the Dow Jones Industrial Average Index with trend lines, moving averages, support zones and monthly trading volumes from 2016 to mid-2023.

Dear trader, dear stock market friends. The first week of July brought a fresh tailwind for the stock markets. The Dow Jones Industrial Average...

A stock chart shows price movements with candles, trend lines, support/resistance zones and Bollinger bands and indicates a possible upward trend and important price levels.

Dear trader, dear stock market friends. The Dow Jones was able to turn green last week in terms of YTD performance and...
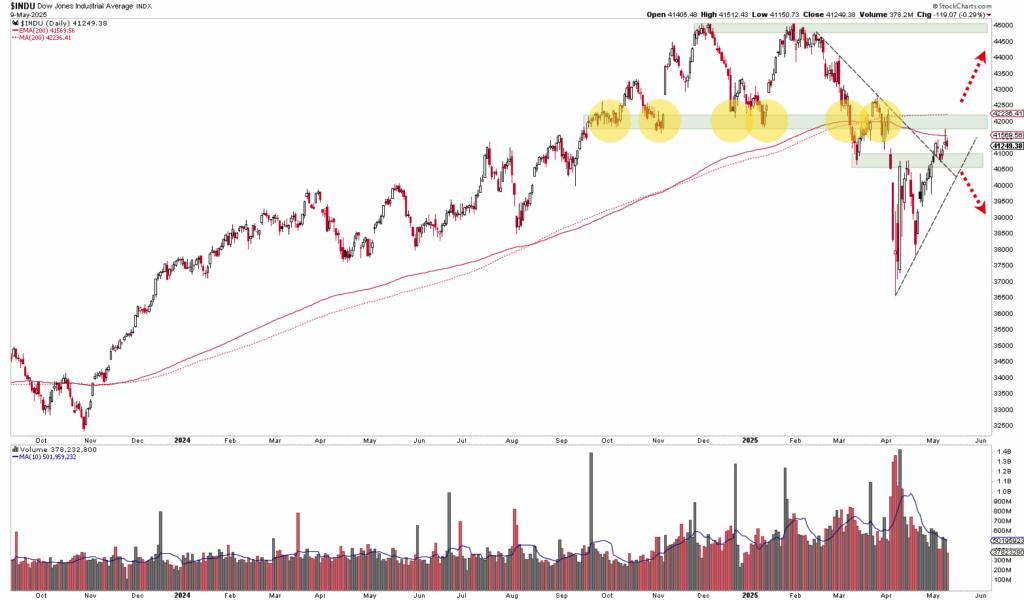
A stock chart showing the Dow Jones Industrial Average with highlighted resistance zones, trend lines, moving averages and volume spikes.

Dear trader, dear stock market friends. The Dow Jones has already risen 14 % since the low on April 7. In...

A detailed stock chart shows the Dow Jones Industrial Average with candles, trend lines and annotations. Volume data is shown below.

Dear trader, dear stock market friends. Following the announcement of the new tariffs by US President Donald Trump, stock markets around the world came under strong...
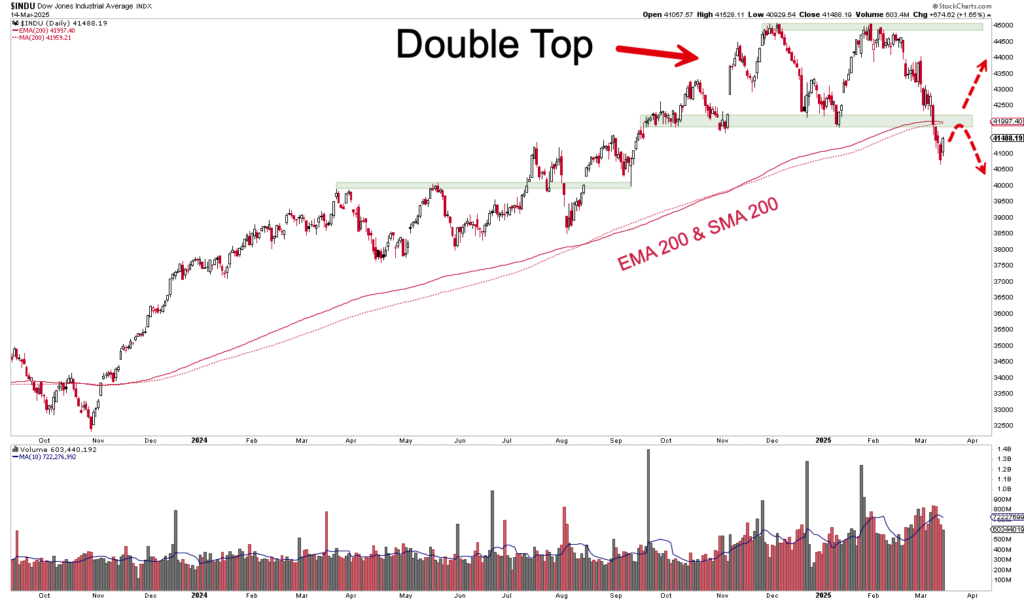
Stock price chart with double top pattern and red arrows. Contains EMA 200 and SMA 200 lines. The bar chart below shows the volume.

Dear trader, dear stock market friends. There seems to be no end to the bad news at the moment. Last week, the headlines were once again dominated by...

Stock chart showing trend lines, moving averages and volume for an index from mid-2022 to early 2023, with frequent fluctuations and upward trends towards the end of the period.

Dear trader, dear stock market friends. The mood on the stock markets remains positive. In the past trading week, the Dow Jones...

Email:

info@captrader.com

Send e-mail

Phone:

Hotline (Germany)
0800-8723370

Hotline (International)
00800-08723370

Further contact options