Your Broker for worldwide trading

S&P 500

The S&P 500 is an American stock index comprising the 500 largest companies traded on US stock exchanges. It offers a broad spectrum of industries and is considered one of the best indicators of the overall performance of the US stock market, painting a diverse picture of the US economy.
A candlestick chart showing the S&P 500 index trends from 2018 to 2023 with moving averages and volume bars was saved as an automatically saved draft.

Dear traders, dear stock market friends. Today marks the start of the last trading week before the US election. Just as exciting as the outcome of the election is...
A stock market chart showing price movements, moving averages and a possible head and shoulders pattern indicated by a red line. Volume is displayed at the bottom of this automatically saved draft.

Dear traders, dear stock market friends. During the summer months, especially in September, the stock market typically tends to be somewhat weaker and is susceptible to...
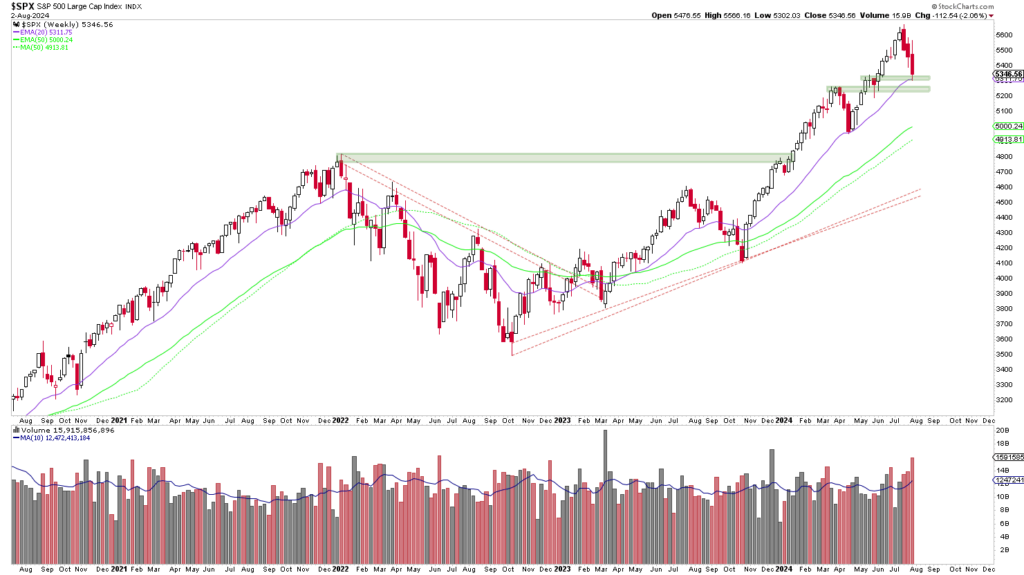
Line chart showing the development of the S&P 500 index from mid-2018 to mid-2023, with various moving averages and volume bars below. The index is shown with various support and resistance levels marked in this automatically saved draft.

Dear traders, dear stock market friends. The last few days have been turbulent on the stock markets and volatility has increased significantly...
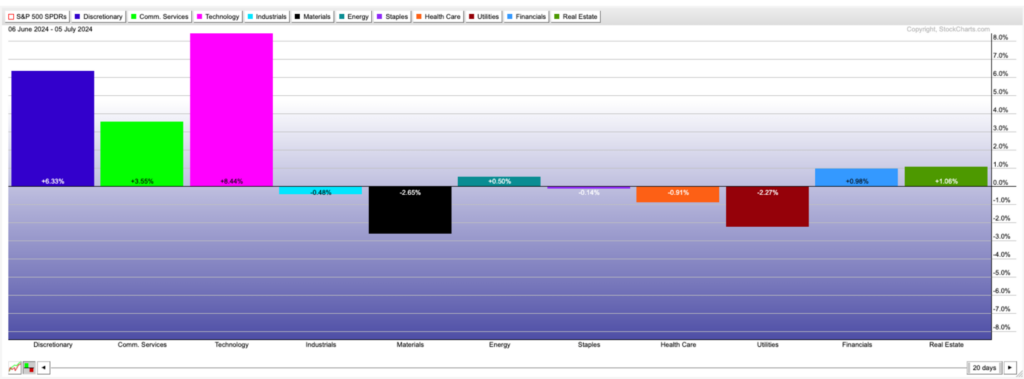
Bar chart showing the performance of various S&P 500 sectors from June 26, 2023 to July 5, 2023. Auto-saved draft shows that Technology is the best performer at +2.10 %, while Utilities lag at -2.47 %.

Dear traders, dear stock market friends. The US stock markets experienced another week of new records last week. The S&P...
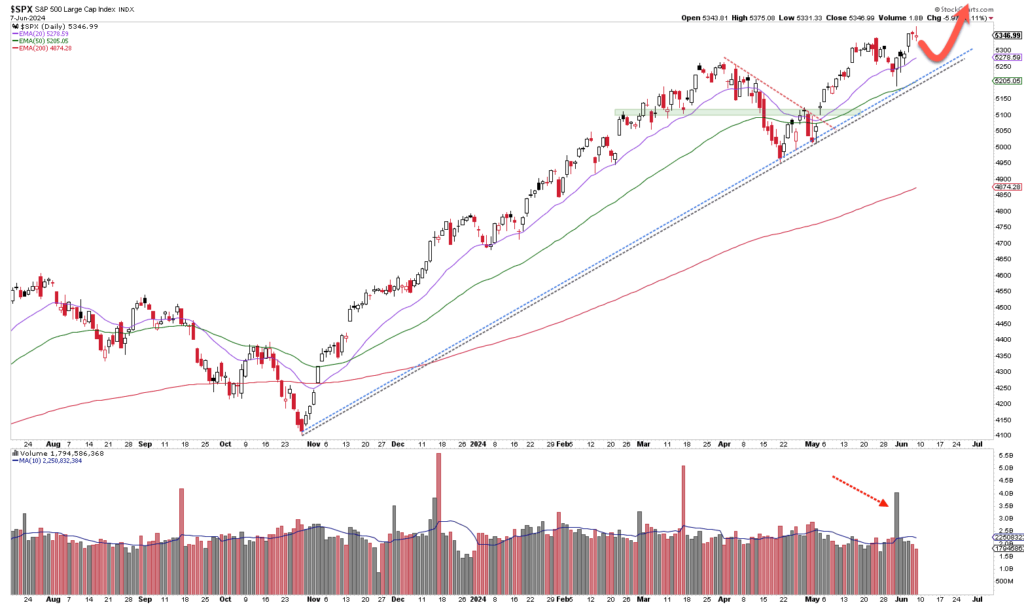
Ein Aktienchart für den S&P 500 mit steigenden Trendlinien und gleitenden Durchschnitten. Ein roter Pfeil hebt einen aktuellen Höchststand oder „Neue Hochs“ hervor, während ein zweiter Pfeil auf einen Anstieg des Handelsvolumens am unteren Ende des Charts hinweist.

Liebe Trader, liebe Börsenfreunde. Der S&P 500 schloss am Freitag nahezu unverändert und erzielte auf Wochenbasis einen moderaten Anstieg von…
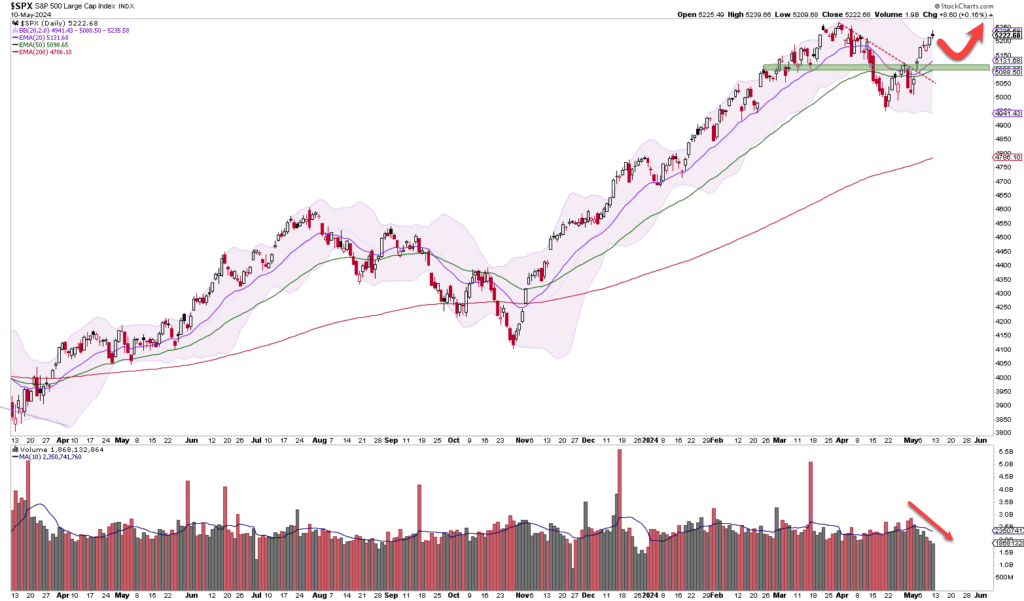
Ein Liniendiagramm des S&P 500-Index mit gleitenden Durchschnitten und Handelsvolumina, das SEO-Trends und -Schwankungen über einen bestimmten Zeitraum zeigt.

Liebe Trader, liebe Börsenfreunde. Nach einem schwachen April startete der S&P 500 mit Kursgewinnen in den Mai. In der vergangenen…
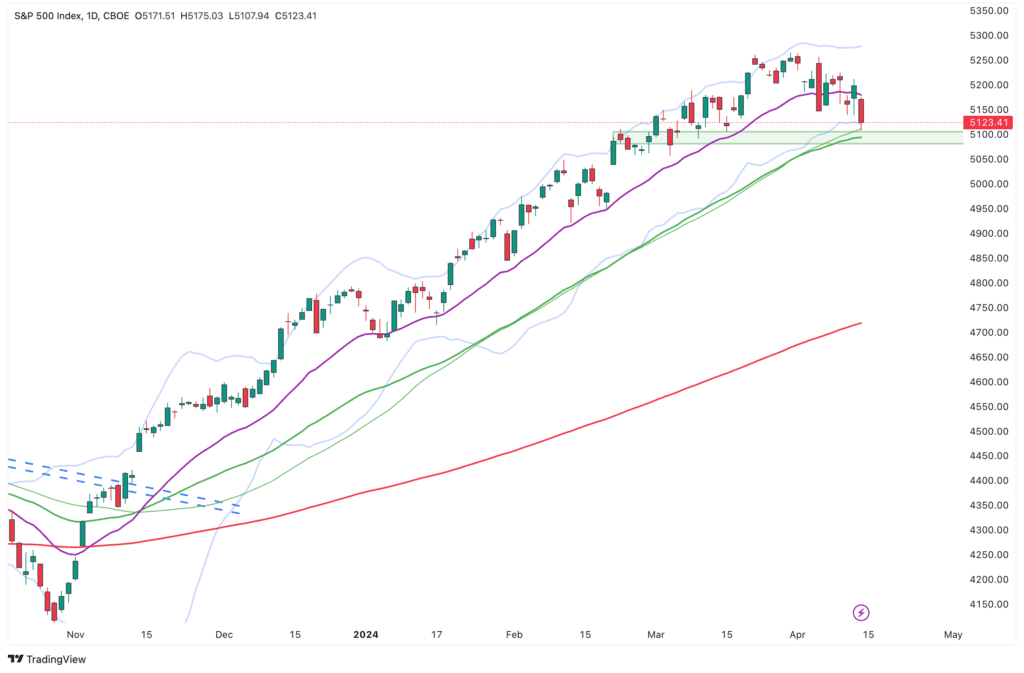
Line chart showing the S&P 500 forecast over time with moving average lines in different colors indicating trends and volatility.

Dear trader, dear stock market friends. Last week, the S&P 500 closed with a loss of slightly more than 1.5...
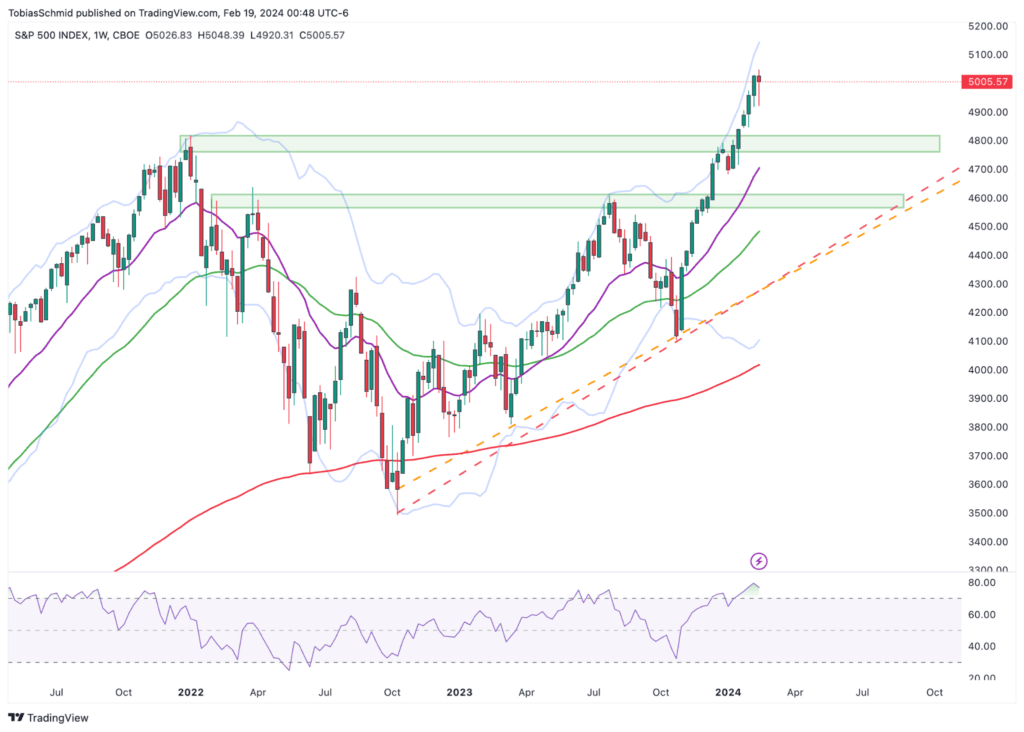
A candlestick chart of the S&P 500 Index provides a detailed analysis highlighting upward movement, resistance and support zones, Bollinger Bands, moving averages, trend lines and a rising RSI for forecasting insights.

Dear trader, dear stock market friends. In the past trading week we saw price movements in both directions in the S&P 500. The bottom line was that...

Street signs for Wall Street and Broad Street at an intersection, with an American flag and city buildings in the background - a reference to the pulse of the financial world amid bull comeback and S&P 500 analysis.

Dear trader, dear stock market friends. Just in time for the weekend, the S&P 500 broke out to a new high last Friday.

Street signs for Wall Street and Broad Street at an intersection, with an American flag and city buildings in the background - a reference to the pulse of the financial world amid bull comeback and S&P 500 analysis.

Dear trader, dear stock market friends. After the correction on the stock markets during the summer months, we have seen a brilliant price rally since the beginning of November...

Email:

info@captrader.com

Send e-mail

Phone:

Hotline (Germany)
0800-8723370

Hotline (International)
00800-08723370

Further contact options