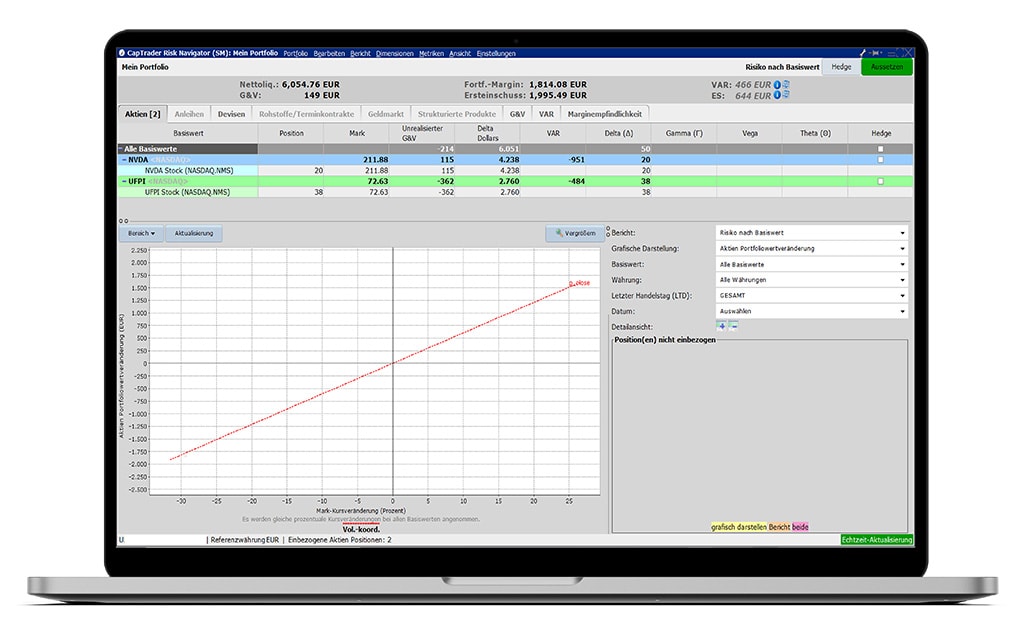
Option Strategy Lab offers traders the following Advantages
Option Strategy Lab allows you to enter your own price and volatility forecasts for an underlying and display a list of trading strategies based on them. Results can be filtered by premium, delta, strike price and/or maturity date.
Then you can adjust details of the strategy components and order parameters and then place the order directly from the Lab
For each strategy you can view the potential profit and loss, as well as the risk/return ratio in the scanner results
Functions of the Option Strategy Labs
The Option Strategy Lab allows you to enter either price or implied volatility assumptions over the selected expiration date of an equity option. It calculates strategies that you can evaluate and obtain a range of risk metrics. You can compare competing strategies and enter trades directly from the tool if required.
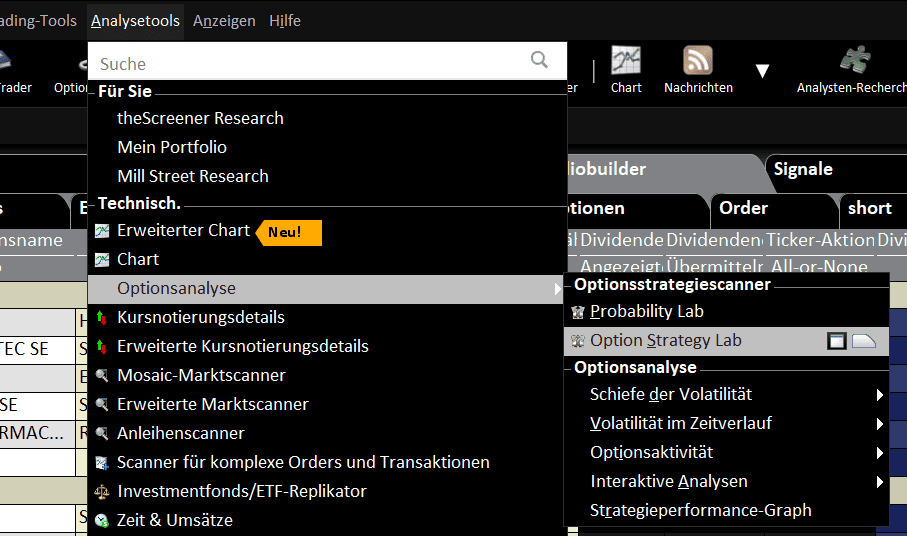
To access the Strategy Lab option, you can use the drop-down menu in the TWS under "Analysis tools", select "Option analysis" and then "Option Strategy Lab". The editing scanner is displayed when you open it.
Selection window
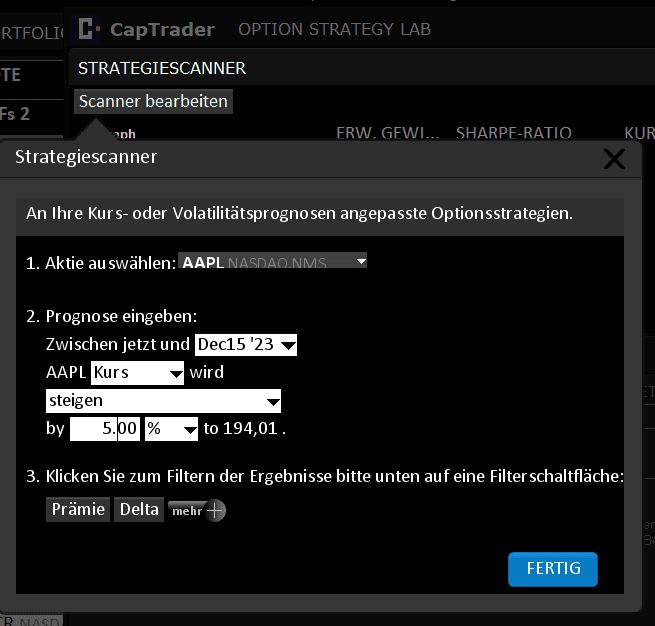
You can search for a recently used symbol in the "Select share" input field or enter one. Then select an option from the next drop-down menu to adjust it to the selected time horizon.
In the next input field, you can select either price or volatility as a variable parameter.
By selecting Price, you can enter an expectation of the underlying increase, decrease, sideways movement or minimum movement. If you select Rise or Fall, you must enter either a percentage or a dollar value associated with the expected movement.
If you opt for a lateral movement, you enter percentage or dollar values for both the upward and downward trend. If you opt for a minimum movement, you again enter the upward and downward extent of the current price of the underlying, either in dollars or as a percentage. You can then click on the "Done" button.
Additional filters
There are additional filter options that can limit the strategies generated by the software if desired. For example, if Delta is selected, the software can be set to return either only debit or only credit strategies.
It is also possible to select an expiration date over the selected time horizon or to ask the software to only work with certain exercise prices.
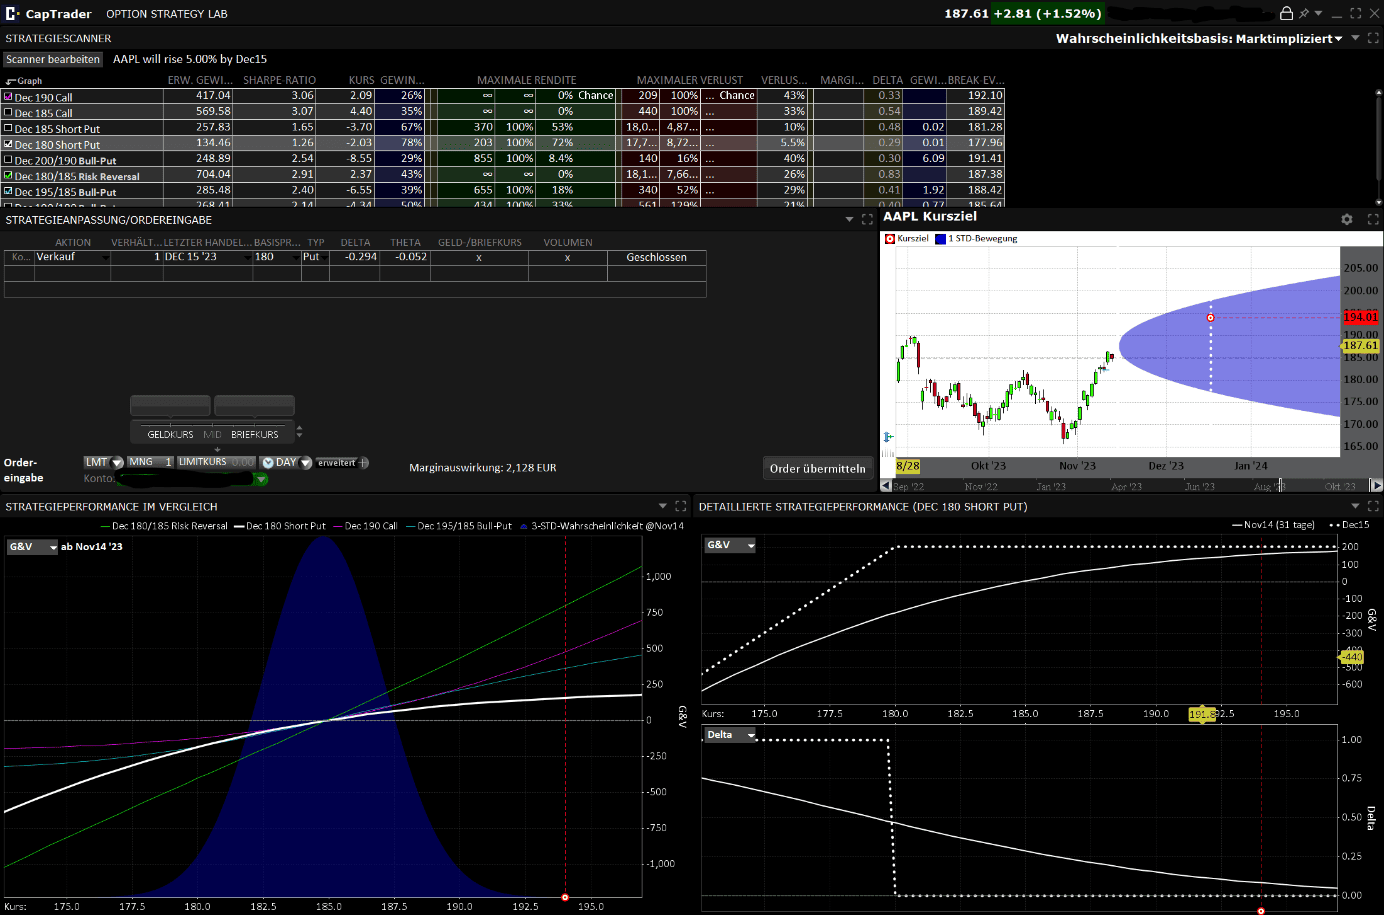
For this example we choose a price increase of 5% until Dec. 15, 2023 and click on 'Done'.
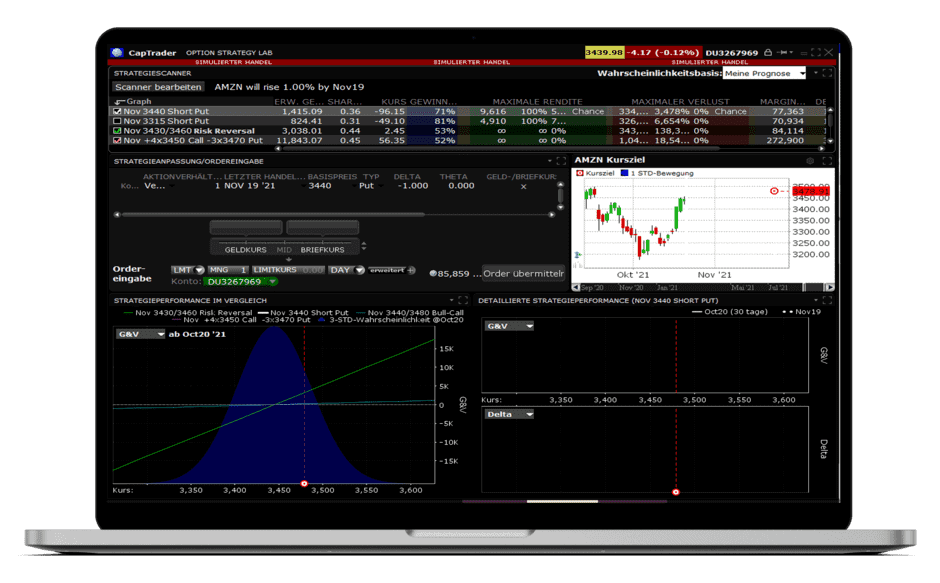
The strategy scanner at the top of the screen returns several combinations of options that can be evaluated and compared. There is a checkbox to the left of each strategy. You can have several strategies checked by the software. Each strategy is color coded and the checked ones are displayed in the Strategy Performance Comparison window below. It is important to note that one of the strategies is marked with a white checkmark by default. This strategy is displayed in the Strategy Customization/Order Entry section (here: 180 Short Put). When you click on a strategy, the check mark changes to white and it is displayed in the Strategy Customization/Order Entry section
At the top left is your price forecast, which you can change by clicking on the 'Edit scanner' button. Several potential strategies are listed in the strategy scanner display, but not all are highlighted. Reviewed strategies are displayed in the Strategy Performance Comparison window below. The Strategy Scanner presents a range of risk-related metrics, including potential returns and losses.
By comparing the implied market prices with your own estimates, the software allows you to see the probability of profit under the current market prices compared to your own prices. You can check the profit probability display from a drop-down menu, which is set to 'Market Implied' by default, and then see the difference in the display when it is changed to 'My Forecast'.
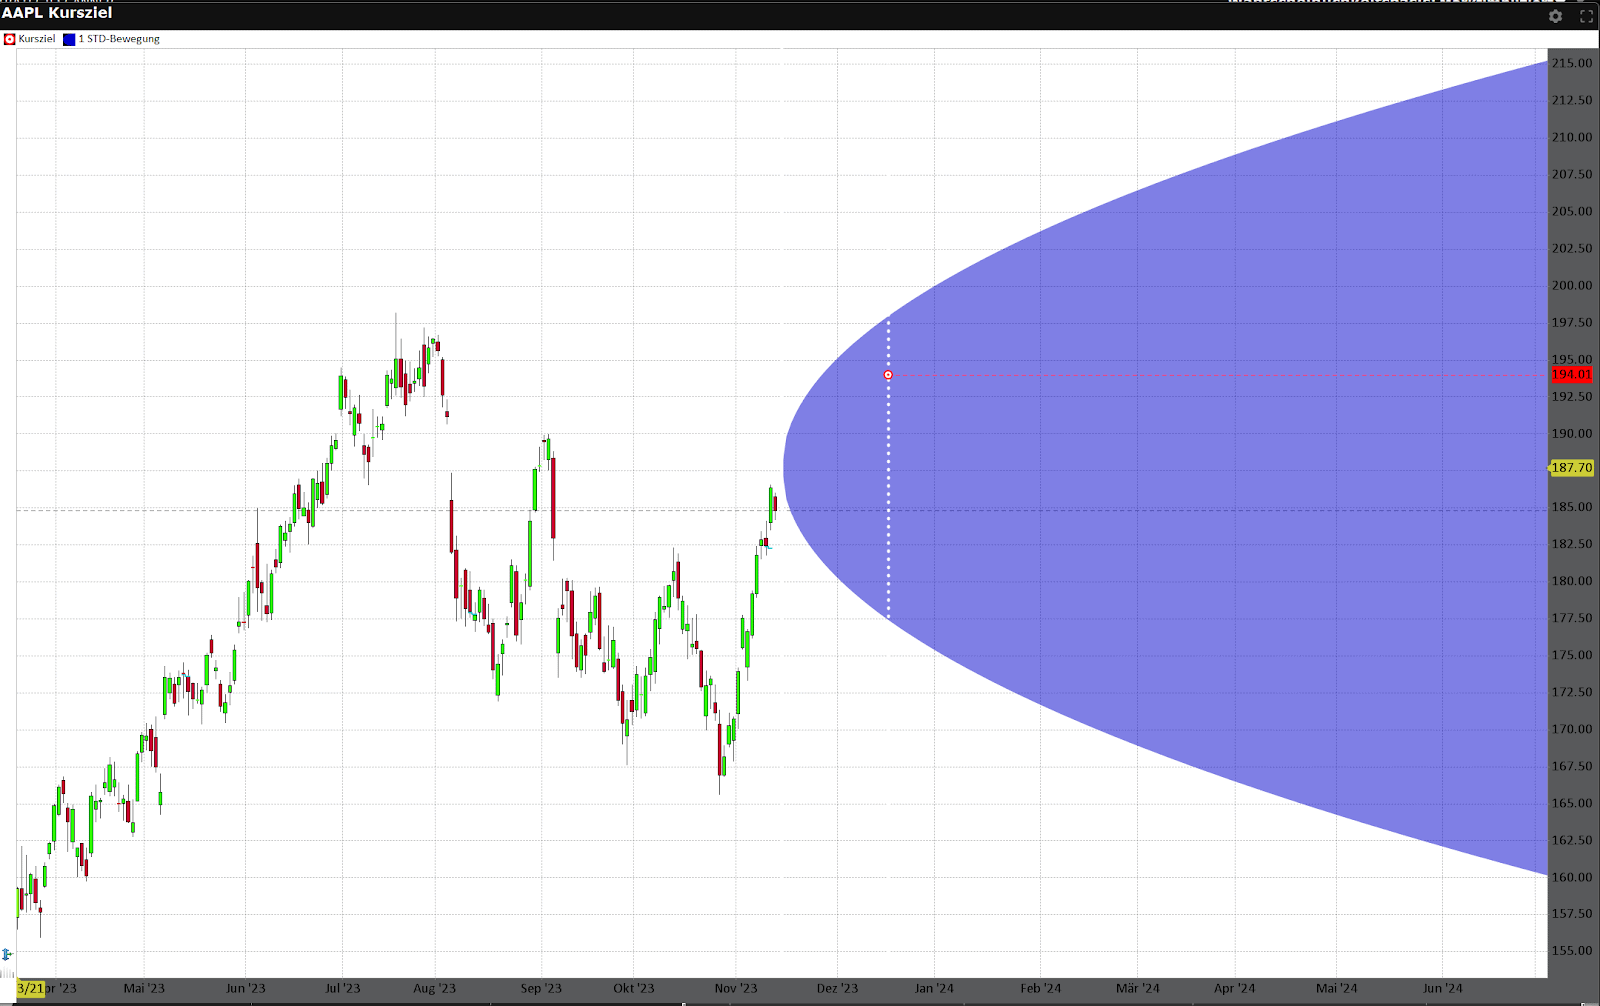
Probability of winning
The probability of profit from your perspective should appear much more certain than that of the live market. All other factors being equal, there is no probability of profit under current options market prices. Both call and Put options would expire worthless, and the premiums for out-of-the-money options represent only extrinsic or speculative value.
You can access a range of strategies by clicking on any column heading. Potentially promising trades are those with the highest Sharpe ratios or the highest ratio of expected profit to variance of outcomes.
Also pay attention to the last column here, which shows the break-even value or values associated with each strategy. The stock chart shows the current price development of the stock as well as the price target until the selected expiration date.
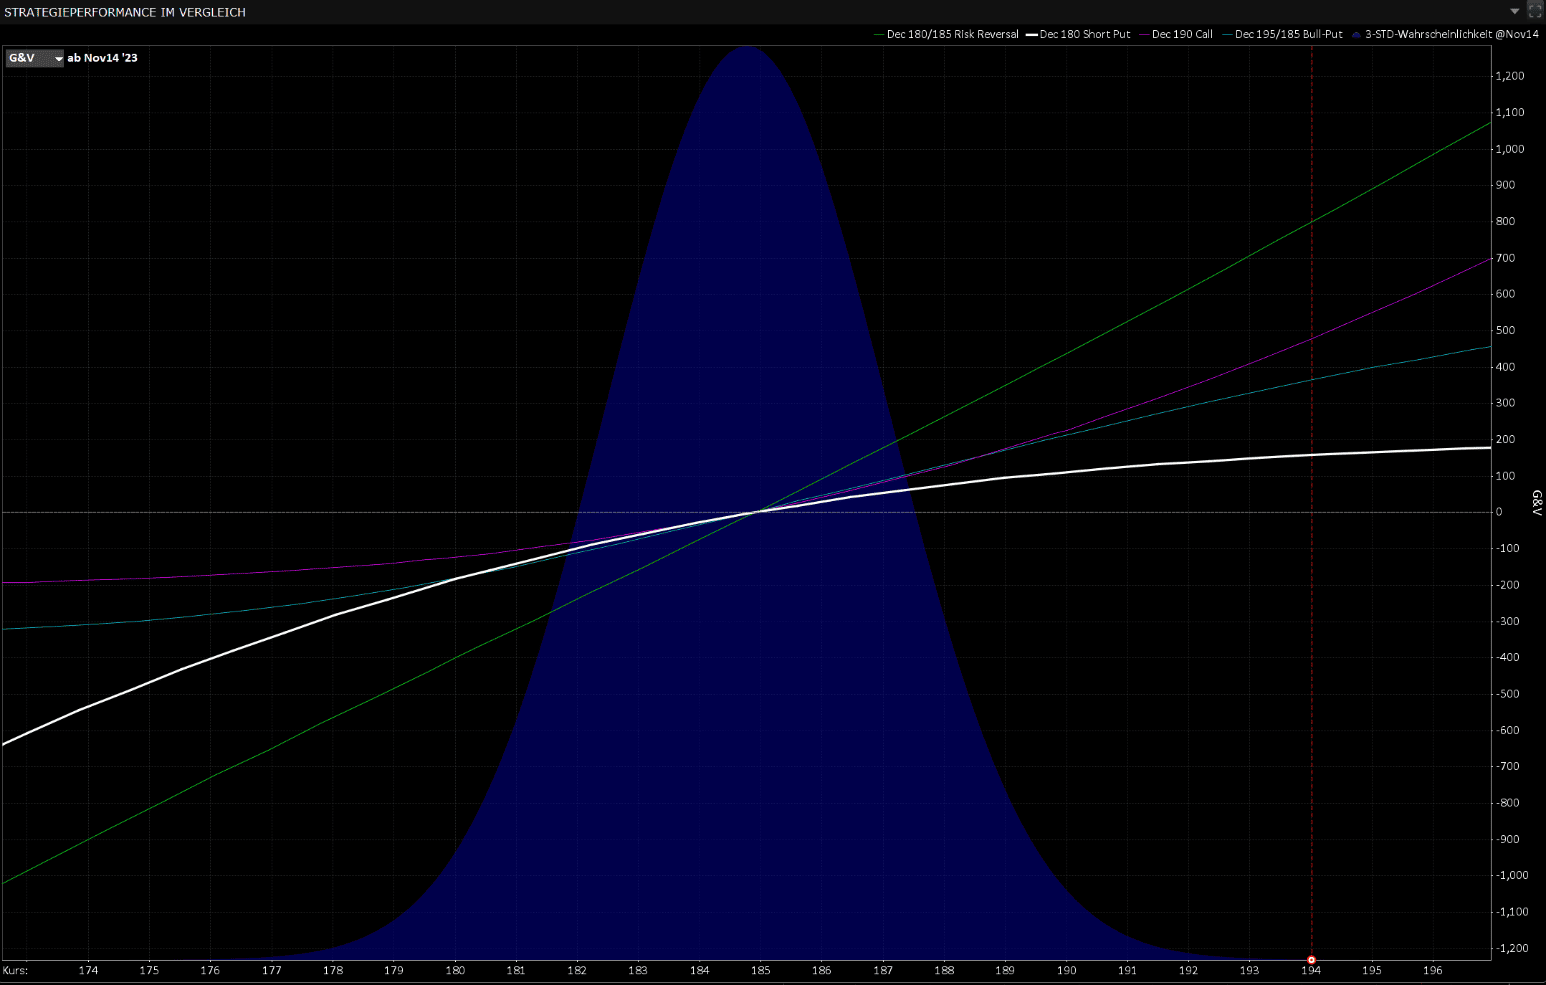
The strategy performance comparison chart at the bottom left shows the price range on the horizontal axis and in this case the price target (here: USD 194.00). You will also see a cone of price distribution based on three standard deviations. This shows the statistical probability of a price movement up to the expiry date based on the 30-day historical price volatility of the underlying. You can compare this movement, measured in standard deviations, with your own price forecast. Several color-coded lines represent the selected strategies and show the expected P&L (profit/loss) over the price range. In this example, the profits from Option strategiesif the price continues to rise.
At the top left of the chart there is a drop down menu. By default, it shows G&V with a specific date, but you can change the display to show the Greeks, such as Delta, Gamma, Vega, etc., or change the date to the expiration date. Click on the drop-down menu to display the Greek variables.
To change the date, you must select it in the price target chart at the top right.
Click and drag the vertical line with the mouse in the direction of the dashed line that represents the expiry time of the option. Release the mouse button at any point. This resets the date in the Strategy performance comparison window and in the two figures on the right.
These two show P&L (profit/loss) and delta separately. Now try dragging the solid line in the Price Target Chart window to the last date to see the expiration date view for the displayed option strategies. Move the cursor over any strategy in the chart to see the corresponding P&L at a specific price.
The Option Strategy Lab enables you to create price and volatility models for a specific underlying asset over a defined time horizon. You can use the Tool to evaluate potential outcomes if your assessment is equal to or better than the market.
Note that only one strategy - the one represented by the white line - can fill the Strategy Adjustment/Order Entry panel. There you can make changes to the ratio, strike, option type, etc. When you are ready to trade, specify the order size, price, order type and duration before submitting your order.
Conclusion on the Option Strategy Lab
The Option Strategy Lab enables you to create price and volatility models for a specific underlying asset over a defined time horizon. You can use the Tool to evaluate potential outcomes if your assessment is equal to or better than the market.
Note that only one strategy - the one represented by the white line - can fill the Strategy Adjustment/Order Entry panel. There you can make changes to the ratio, strike, option type, etc. When you are ready to trade, specify the order size, price, order type and duration before submitting your order.

Open a securities account now and get the StrategyLab use
Use the modern trading software with exclusive trading tools in your securities account at CapTrader.
Trade worldwide at best conditions with first class customer service.