


With the Chart analysis traders look at the graphs of exchange-traded products and the products derived from them. Indicatorsto Recognize patterns. Used correctly, trends can be identified and open lucrative positions.
We have summarized what you need for this, how to get started with the method and which points you should pay attention to in the following guide!

The most important in a nutshell
- Chart analysis is the visual examination of price movements with the aim of deriving patterns, trends and other helpful information
- The basic assumption is that the charts always follow typical, repetitive patterns. If traders succeed in predicting these developments, profitable trades are possible
- It is a cornerstone of investment analysis that investors should be familiar with
- You need suitable software for a meaningful representation of the graphs
Why chart analysis is so important
To trade successfully on the stock market, traders must know the Open the right trading position at the right time and close them again at a profit. To determine the ideal times, they use a variety of information sources, methods and Trading signals.
The probable most obvious optionto find out more about a share or other exchange-traded investment, the A look at the share price: chart analysis. Based on current and past trends, experienced traders can derive forecasts for future price developments.
This analysis method is therefore a mainly visual examination. In the simplest form, we look at the direction of the price graph, for example. By drawing in lines and other geometric shapes or comparing them with other values and calculations, we can obtain more, useful insights.
For example, trends can be identified at an early stage and position sizes and target ranges for price movements can be determined. Also for risk management chart analysis is essential, especially in order to detect potential risks and false signals in good time.
Some specialist knowledge is required for chart analysis, as it recognize numerous possible patterns applies. Even experts do not always succeed in predicting prices in this way.
Nevertheless, a look at the charts is a helpful tool! Especially in combination mit their counterpart, Fundamental analysis (consideration of basic key figures), this creates a solid basis for successful trading activities.
Good to know:
Fundamental analysis and chart analysis are often seen as opponents; in fact, however, both methods are indispensable for traders and are almost always used together!
One can therefore confidently say that every retailerwhether beginner or professional, should be proficient in chart analysis. We have therefore put together some useful tips and helpful samples for you below!
Basics: Chart presentation
The basis of chart analysis is of course the Chart itself. It always consists of at least one x- and y-axison which the prices of the product under consideration (e.g. a share, currency pair, Short-term bonds, raw material ...) are registered.

In almost all cases, the x-axis (horizontal line) the course of time represent. The y-axis (vertical) on the other hand, forms the Coursei.e. the price of the respective product. This creates a graph that develops from left (earliest value) to right (latest/latest value). Rather rarely, a chart with reversed axes is also possible, in which the price development is shown from top to bottom.
The simplest display method is the line chart, which shows a relationship between time and price in chart analysis. This form is already sufficient for many applications; alternatives such as bar charts or Candlestick charts however, can still additional information deliver.

Especially the Candlestick chart is popular with traders because it also Opening and closing prices, trading volumes and further information can be displayed. Ultimately, however, it is up to the trader to decide which form to use; modern trading programs offer a variety of possible views and personalization options.
CapTrader can do that:
A powerful price view is necessary for successful chart analysis. CapTrader gives you free access to professional trading tools such as TraderWorkstation, TradingView or our smartphone app, which has been beste Trading App was awarded.
In the chart analysis different time units available. This allows you to display graphs ranging from several years to just a few seconds. This also changes the focus and the level of detail accordingly. Pay attention to the correct time when displaying courses.
For example, the prices of a share from the last ten years may well be of interest to an investor with a long-term horizon, whereas those who are interested in the Shares for day trading can't do much with such a long period of time ...


How chart analysis works
With the Fundamental analysis traders examine the fundamental Data and figures to a share or other asset. This could include, for example, the PEG ratio, Debt-equity ratio oder das Profit growth count. In contrast, we only look at the price movements in the chart analysis.
The Acceptance The point here is that all important fundamental data are already priced in and are reflected in the chart. A separate look at the facts and figures would therefore not be necessary, as the graph already contains everything important. In practice, however, successful traders take both the share price performance and the fundamental key figures under the microscope.
In order to derive useful information from the courses, we can compare them with a series of well-known patterns and indicators. If there is a match, we can assume that prices will develop as they have done in such cases in the past.
There is no guarantee of this! It is also possible that the wrong patterns are recognized, for example because we are concentrating on the wrong time period. The Chart analysis is therefore not always an exact science and requires some experience.
We therefore recommend that you Application initially on a CapTrader Demo account to test. There you can make full use of CapTrader's huge range of products (more than 1.2 million shares, more than a million bonds, options, futures, 100 currency pairs ...) without jeopardizing your real capital.
Chart analysis is also not equally suitable for all assets! Especially the Liquidity plays an important role: it should be very high to allow "normal" chart analysis. Analyzing less liquid investments is possible, but more complicated and therefore less suitable for beginners.
Price influencessuch as those arising from share buyback programs, share splits or dividend payments, also make the analysis difficult. In this case, it is best to wait until prices have calmed down somewhat. This also applies to unexpected or extreme news.
CapTrader can do that:
Highly liquid foreign exchange or the rarest niche stocks? At CapTrader you have the choice! With more than 1.2 million securities including shares, bonds, currency pairs, options, futures and much more, you will find the right vehicle for your strategy!
The most important patterns and indicators for chart analysis
There are two ways to achieve success in chart analysis: through the correct Recognize the most important patterns and/or the Comparison with technical indicators. In principle, both methods can lead to success and offer reliable results, especially in combination.
Both beginners and professionals can use it to Very good results achieve, even if it No one hundred percent probability of success there are. In particular, good risk management and a suitable strategy that is pursued in a disciplined manner are essential prerequisites.
In the following, we would like to introduce you to some typical patterns that you may encounter again and again when analyzing charts.
Support and resistance lines
The prices of shares and other assets repeatedly reach limits in their upward and downward movements, at which they seem to magically reverse. At these points, one speaks of Support lines if the price does not fall lowerand Resistance lines if a further increase fails despite several attempts.
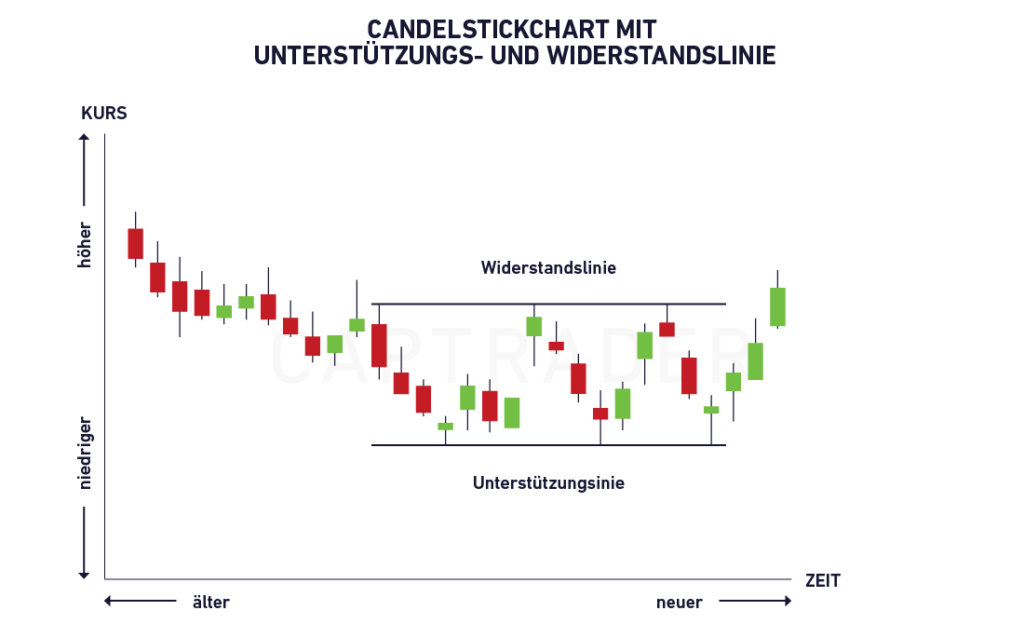
The term "Trend line" has become established, as it is a very good way of indicating the direction of prices, i.e. the prevailing trend.
Recognizing such lines is one of the most obvious aspects of chart analysis. The resistance and support lines form a Important information for future developments! Correctly identified, they allow us to predict reversal movements.
Traders can speculate on the fact that the respective line continues to be adhered to and, for example, a Swing-Trading-Strategie apply. The Break out The first move out of the corset of lines can occur at any time and is a worthwhile target: some traders wait for this moment to open a position.
To create such a to detect the outbreak in good time, offers the Combination of trend lines with other methods of chart analysis. However, beginners in particular often tend to put all their eggs in one basket (= one chart analysis pattern), which can quickly lead to failure!
Simple and weighted moving average (SMA and EMA)
A series of moving averages are important for chart analysis. They form the Average price over a fixed period and come with further "extras".
The "Simple Moving Average"SMA or "simple moving average" is the basic form. It is obtained by adding the prices over a period of time and dividing by the number of intervals.
Also popular is the weighted moving average (EMA - exponential moving average). He attaches greater importance to current values than those that took place longer ago. The results vary depending on the period under review.
Traders can do this in various ways and thus derive trading signals. Both forms of the moving average (and many other variants!) are also the starting point for other chart analysis indicators and are therefore of multiple importance.
Momentum
Trend lines indicate the direction of a price movement, but do not say too much about the Power of such a movement out. Various indicators can be used to determine momentum. One of the best known is the MACD.

Developed by Gerald Appel in the late seventies, the Moving Average Convergence/Divergence Oscillator is both simple and effective, which has quickly made it very popular. The MACD transforms two moving averages into a momentum oscillatorby subtracting the longer moving average from the shorter one.
It fluctuates above and below the zero line depending on whether the moving averages are converging, crossing or diverging. Traders can look for Signal line crossings, center line crossings and divergences Keep an eye out
Bollinger Bands
A simple gleitender Durchschnitt becomes supplemented with the standard deviation (volatility). This creates two lines that move above and below the SMA. Shifts between the three lines provide interesting impulses for chart analysis - especially if we link them to the respective prices.

For example, bands drifting apart can indicate a stronger trend. Such a movement is particularly exciting if the price is also at the edge or outside the bands!
Here you can interesting opportunities for lucrative trades. The Bollinger Bands themselves can also be used to calculate other indicators.
Relative Strength Index (RSI)
An important goal of chart analysis is to find out, when an existing trend reverses. This allows traders to determine the right time to close their positions and take profits. The Relative Strength Index can help you do just that!
It is created from the Purchase and sale data of an asset generated and with a Value between 0 and 100 is indicated. High figures (70 or more) indicate an overbought state, while figures below 30 are generally considered oversold.

These deflections of the realtive strength oscillator can be point to an imminent trend reversal. The RSI is particularly popular for confirming assumptions and preparing for a change in direction. Of course, there is no guarantee that the forecast will be correct!
Further indicators
The following are available for chart analysis Hundreds of possible indicators are availablewhich can be particularly intimidating for beginners. However, it is It is not necessary to know and apply all the values!
The well-known principle "a lot helps a lot" does not apply to chart analysis! As a rule a handful of indicators is already sufficient, and the correct combination and execution are more important than the number.
The indicators and patterns listed here form the Basis for successful chart analysis and therefore equally important for beginners and professionals. You can supplement this basis with numerous other methods and thus develop your own personal strategy for technical analysis.


Practical application: How to use chart analysis
RSI, momentum and co. are all well and good, but How do you actually apply these analysis methods? The procedure is quite simple. First select the assetthat you want to take a closer look at.
In general, all exchange-traded products are suitable for this. Due to their high profile and good liquidity, blue chip stocks are particularly suitable for beginners who want to learn chart analysis.
Your broker has sent you a professional trading software provided? Then you can open the selected share (or other product) in the corresponding program. Especially the program TradingView is very popular with beginners, but offers a range of functions that can also satisfy professionals.
If the current price is called up, we recommend that you first Customization of the view. You usually have the choice between candlesticks, bars, lines and other display methods. A Candlestick graph is generally regarded as most meaningful variant, but the choice is up to you.
Also make sure that the suitable period was selected. There can be big differences here: For example, would you like Shares for day trading short intervals of up to one month are common. For long-term investors, on the other hand, significantly longer phases would make sense.
Display indicators
In your trading program you will find a more or less Extensive selection of analysis tools. For example, TradingView provides an "Indicators" field when you are in the price view of a share or other product.

Depending on the software, you can now Display single or multiple key figures for chart analysis can be used. A useful start for beginners is a simple moving average, weighted moving average or Bollinger bands (period: 20 days), for example.
You can also Draw trend lines or other geometric figureswhich can help you with the analysis. Depending on the software, adjustments to the view, colors, etc. are also possible.
We initially recommend to start with a few analysis methods. Familiarize yourself with the meaning of these key figures at the beginning: What is the signal and how should you react to it?
Test your hypotheses in the process on a CapTrader Demo account, to save expensive learning costs: With a demo account, you can trade CapTrader's extensive product range with "play money" and thus gain experience in a realistic environment.
Once you have reliably achieved success with chart analysis on the demo account for some time, the Clear the way for "real" investments. The usual Tips and hintswhich have proven themselves in all types of stock exchange transactions:
- Pay attention to the fees charged by your broker, as these can quickly add up - especially with active trading
- Pursue your strategy in a disciplined manner and with as little emotion as possible. Greed, fear, resignation and the like have no place on the stock market!
- Strategy changes should be carefully considered. Give your current approach enough time to develop its full effect. If you are concerned about its effectiveness, you should go back to the Demo account change.
- Record your results in a trading diary, spreadsheet program or similar method. This allows you to quickly see which key figures have actually led to success.
CapTrader can do that:
CapTrader is the strong partner for active traders thanks to its huge selection and low costs! For example, you can trade US shares from as little as $ 0.01 per share (order minimum: $ 2.00) or European shares from as little as 0.1 percent (order minimum: € 2.00)!
Conclusion: Chart analysis as an essential component of stock market success
Under the Chart analysis (also: "technical analysis") is understood as the Optical examination of coursesto discover lucrative trading opportunities. In doing so, traders place a Series of patterns and indicators to interpret the price trend.
The methods range from simple lines that are used to trace trends to highly complex calculations that are themselves based on other formulas.
For beginners are particularly suitable for Trend lines, moving averages, Bollinger Bands and the Relative Strength Index. It is advisable to understand these key figures and concepts and to derive trading signals from them. This is best achieved using historical data or on a CapTrader Demo account.
Once this foundation has been laid, you can add further formulas and patterns. The following applies: It is It is not necessary to master every single variant of technical analysis! At the same time, you should not rely on just one single indicator.
The "golden mean" is created when you have a few Key figures for chart analysis and others Trading signals combine. Your own strategy, your risk appetite and the asset to be traded also play a decisive role.
Are you still looking for a lucrative approach? We have the best Day trading strategies summarized for you!
