


The VVIX gives the Volatility of the VIX volatility index again. As a pure indicator, it is not tradable, but can be an important tool for traders. We explain how to read the "volatility of volatility" correctly and show practical areas of application.

The most important in a nutshell
- The VVIX is an index that measures the volatility of the VIX. It therefore provides an insight into the mood of the markets and can be used for forecasts.
- You cannot trade the VVIX directly.
- We show you what different values of the index can tell you and when caution is advised.
- You will also find some practical examples of trades that are suitable for specific VVIX levels.
The VVIX: structure and function
The list of most important volatility indices for options traders is long and is led by the VIX. This index already provides useful insights into market sentiment and can warn us of impending crashes, for example.
However, as always in the financial markets, a single indicator alone is hardly sufficient to make reliable forecasts. An exciting way to gain further insight is to use the Volatility of the volatility index to determine.
This VVIX This index not only reflects market sentiment, but also how traders rate this sentiment. Among other things, it shows us the The speed with which market changes occur or are expected to occur.
The structure of this "double volatility index" is as follows:
- The S&P 500 is one of the most important US indices and share indices in the world.
- If investors expect share prices to fall, they want to reduce their positions and Hedging shares. They buy options. The higher demand causes option prices to rise.
- The VIX records the prices of options and expresses them as a percentage.
- Retailers can VIX options (contracts with the VIX as the underlying) and thus profit directly from volatility.
- The demand for such VIX options is also recorded in a separate indicator, the VVIX.
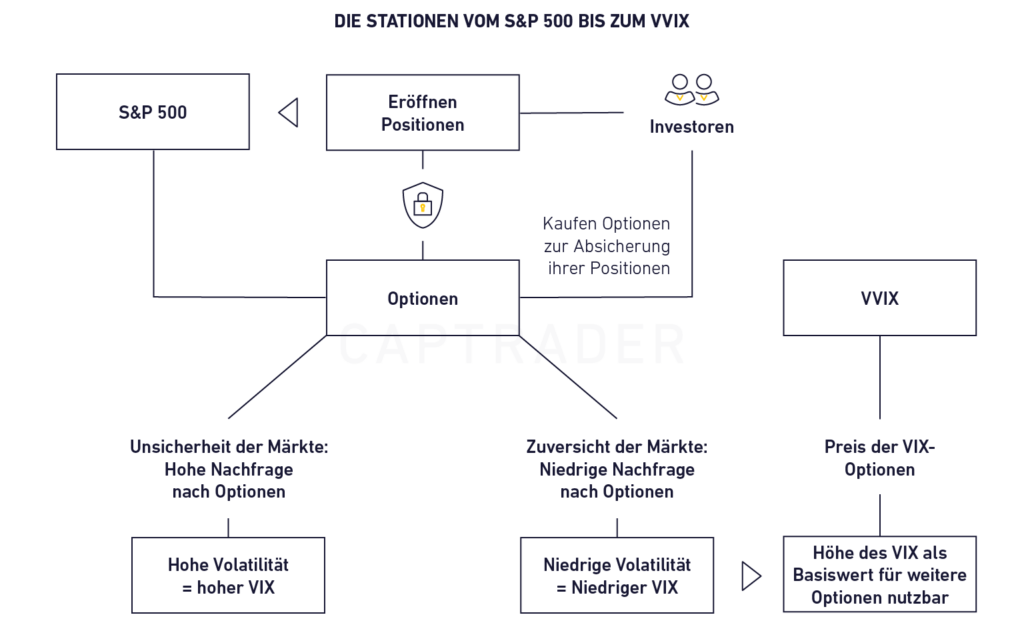
The VVIX uses the same calculation methods as the VIX, only the calculation basis is different:
- The VIX calculates the prices of options on the S&P 500.
- The VVIX calculates the prices of options on the VIX.
Due to this special structure, numerous alternative names have become established for the VVIX, such as "double VIX", "double volatility", "volatility of volatility" or "Vola-Vola".


High and low VVIX explained
The VVIX is a very volatile index. Given its structure, this is hardly surprising:
- Changes in market sentiment lead to higher demand for options for hedging purposes.
- Option prices are rising in line with demand. The VIX is now also rising.
- Traders want to profit from the expected changes and are increasingly trading options on the VIX.
- The prices of VIX options are now rising even more sharply, which in turn has a direct impact on the VVIX level.
Each of the steps therefore results in a natural amplification, which in total leads to strong swings in the double volatility index.
In quiet market phases, the Normal value usually between 75 and 100. According to the options exchange, the average is CBOE, 86 points. In turbulent markets, a Increase up to 200 points possible. Even higher values are extremely rare, but occurred during the COVID crash in 2020, for example.
Due to its structure, especially Very rapid, intensive price slumps in the S&P 500 a guarantee for VVIX highs. A slow decline in the course of a bear market, on the other hand, would hardly affect the VVIX.
Like the VIX, the VVIX does not initially allow any statements to be made about the direction of a trend. Both price rallies and crashes can theoretically result in high values. In practice, a high double volatility, however, very often for a recovery after a weak market phase or a major slump, while the reverse scenario (falling prices after a longer upward phase) is very rare.
Good to know:
The VVIX does not indicate the direction in which the markets are moving or the mood of market participants; however, it does show the intensity of the current trend and is therefore a very useful indicator!
Why can't I trade the VVIX?
The VIX volatility index was introduced back in 1994 by the Chicago Options Exchange (CBOE). In 2004, it became possible to use the VIX itself as an underlying for options and Future Trading to use.
The VVIX is calculated from the prices of such VIX options. So it would be technically possible to also offer the VVIX as an underlying value and to trade options and/or futures on the double volatility index.
However, such products do not currently exist and are unlikely to be introduced in the foreseeable future, even if the most recent new VIX options were offered. The main reason for this is the large distance between the calculation basis and the respective derivative (option or future).
- A VVIX option would refer to the option prices of the VIX, which in turn tracks the volatility of the S&P 500.
- So many intermediate stages would be necessary that VVIX options would form a rather absurd financial product.
- The pricing of the contracts would also be associated with difficulties.
- Changes in the VIX would lead to strong fluctuations in the VVIX options. The influence on the Option Greeks would be just as enormous as the volatility of such a product.
Good to know:
The VVIX is not tradable as an underlying asset and is unlikely to become so. It can therefore only be used as an indicator, but plays an important role for traders in this function!
Using VVIX as an indicator
The VVIX cannot be traded directly, but as a excellent indicator use! It can provide traders with additional information that they do not get from the regular VIX volatility index, for example.
As with all Trading signals and indicators also apply here: A A single key figure has only limited informative value. Reliable forecasts can only be made in conjunction with other signals.
A special feature of the VVIX is the fact that only high stands have a real signal effect. Low points, on the other hand, are less interesting for traders and provide only limited information.


VVIX in combination with the VIX
It makes particular sense to use the two indicators VIX and VVIX, which build on each other, together. This is a particularly good way of Recognizing the turning points of a trend movement and lucrative trading. Such a turnaround is heralded by a high in the double volatility index:
| VVIX stand | Signal |
| Over 130 | The end of the current movement is in sight. |
| Approaching 200 | Very strong sign that the trend is about to reverse |
| 200 and more | Extremely strong sign of a reversal. A further increase is almost impossible. |
Using the VIX or VIX options as the basis for calculation, the VVIX has a natural maximum at around 200 pointswhich is only exceeded in absolutely exceptional cases. However, you do not have to wait for such highs.
Already From a level of around 130, a reversal is normally on the cards. If this is confirmed by a falling VIX, a turnaround is likely and experienced traders are preparing corresponding positions for the opposite direction.
VVIX with other indicators
You can also use the double volatility index in combination with other indicators to obtain an even broader picture of the current market situation. For example, it works very well with:
- Turnaround Tuesday. Between the close of trading on Monday evening and Tuesday, there is an above-average frequency of trend reversals, which are known as Turnaround Tuesdays. If a high VVIX occurs on such a day, this reinforces the impression that a trend reversal is imminent.
The phenomenon can be proven beyond doubt by backtesting. It is particularly evident after "weak Mondays", when the markets close below the values of the previous Friday.
- Moving Average Convergence Divergence (MACD). The MACD is an important component of the Chart analysis and should not be missing from any trader's toolbox. A line is created by subtracting an exponentially weighted moving average over 26 periods from an average over 12 periods. In addition, another exponentially weighted moving average over 9 periods is added as a signal line
Don't worry: you don't have to carry out these complex calculations yourself! Modern trading programs provide these and other indicators as standard.
Here you could include a screenshot of the MACD in a trading program. You could also superimpose the VVIX (but only if the picture is not too confusing!).
The MACD is mainly used to determine the strength of a trend and a possible trend reversal. The latter task can be combined very well with the VVIX to reliably predict a turnaround. To do this, look out for times when the double volatility index shows high values and the MACD line crosses the signal line.
CapTrader can do that:
The right tools are essential for active traders. At CapTrader you get free access to professional trading software such as the Trader Workstation and the beste Trading App.
- Classic chart analysis methods such as support lines or resistance lines can also be used very well in conjunction with the VVIX. They are quite easy to draw, but can only be used to a limited extent as there are no exact coordinates - the trader sets them mainly by feel.

Nevertheless, they can help to confirm trends or announce changes. The breakthrough of such a line is Chart analysis as a sign of a change in sentiment and is often eagerly awaited by traders. In combination with a high VVIX and a change in the VIX, this creates a very strong signal.
Trading ideas: How you can profit from the VVIX
There is no question that the VVIX is an important indicator. But How can traders benefit from the double volatility index in practice? There are several possibilities here. We would like to present some ideas to you.
1. high VVIX, low S&P 500: good opportunity for short puts
A high VVIX indicates an imminent trend reversal. If the S&P 500 has recently lost value, a price recovery is likely. This situation is very suitable for trading Short puts on the S&P 500 or individual shares from the index!
A short put is an option where you undertake to buy an asset for an agreed price. Your trading partner can decide whether the contract should be executed, but you have no such right of choice. You receive a premium for subscribing to such an option, which you may keep in any case.
Was the forecast (high VVIX = imminent trend reversal) correct and the prices rise, you profit:
- The other party can sell the shares on the stock exchange for a high price.
- The price you have guaranteed in the option contract is lower.
- The counterparty will allow the option to expire worthless and sell the assets on the stock exchange.
- You may keep the option premium and recognize it (less broker fees and any taxes) as profit.
CapTrader can do that:
Trading options and other particularly lucrative financial instruments is only possible with specialized brokers such as CapTrader. Here you get particularly favorable access to such tools and can, for example, trade options for as little as €2.00 per contract!
Please note: A single short put (also called "naked put") involves considerable risks! If, contrary to expectations, prices fall, there is a risk of high losses. Ideally, such contracts should therefore be combined with other options to offset these risks. Alternatively, the use of a cash-secured put is also possible.
You can find out more about correct hedging and the ideal way to enter the world of options in our article "Trade options".
Whether you want to buy such a short put on shares from the S&P 500 or the index itself is a strategic question. Individual stocks have a higher risk as they do not automatically follow the direction of the S&P 500. In return, however, they can yield higher premiums. The index itself, on the other hand, is easier to predict in many cases, but may yield lower profits.
2. high VVIX, high VIX: profit from the trend reversal with VIX options
The VIX (unlike the VVIX) can be used as an underlying for options and futures and can therefore be traded directly. A very High VVIX may indicate an imminent trend reversal and in many cases heralds a falling volatility index.
Retailers can benefit from this change, for example through VIX options. If the VIX reaches a very high level and the VVIX also approaches the 200 mark, volatility is likely to fall soon. You can profit from this with a short call:
- A short call is a type of option in which you promise the counterparty to sell an asset (in this case the equivalent value of the VIX) at an agreed price.
- You will receive a bonus for this transaction, which you may keep in any case.
- With this contract, too, the counterparty can decide whether or not to exercise the option - but you have no right of choice.
- If the volatility index falls, the counterparty lets the option expire and you can book the premium (less costs and taxes) as a profit
- However, if the VIX rises contrary to your assumption, the counterparty will exercise the contract and demand cash settlement. In this case, there is a risk of considerable, theoretically even unlimited losses!
A Short calls should not be used without a suitable hedge! If the VIX rises very sharply instead of falling as announced by the VVIX, there is a risk of major losses. The difference between the price and the price agreed in the option represents the potential loss.
We therefore strongly recommend hedging such contracts. A long call, for example, is an option here: this increases in value if your short call should generate losses in the worst case scenario, thus limiting the damage.
CapTrader can do that:
With us, you can profit from trading volatility in different ways! In addition to the VVIX as an indicator, you can also use options, futures and even ETFs that replicate volatility options!
Conclusion: The VVIX is not tradable, but it is an important indicator!
Volatility, the fluctuation range of an asset's price, is an important part of our financial world. It can even be traded directly in the form of the VIX volatility index. This index is the basis for the VVIX: It describes the volatility of volatility and serves as an important indicator of market sentiment.
It is particularly well suited for estimating the strength of a current trend on the stock market. A high VVIX, with more than 130 points, can herald an imminent trend change. It reaches its natural peak at around 200.
If we look at its structure, this is not surprising: the VIX measures the prices of options on the S&P 500 share index. As such contracts are mainly used for hedging purposes, it can be used to gauge the fear or confidence of the markets. However, this volatility index can also be used as an underlying value for other options!
The VVIX in turn reflects the prices for such VIX options. This gives us an insight into the mood of traders and their opinion on a current movement. Especially in combination with other indicators, this provides a very good picture of the market situation!
We cannot trade the double volatility index directly. Nevertheless, it is possible to profit from your investment: In the event of a high VVIX and low S&P 500, for example, short puts on the index (or stocks included in it) are suitable for generating an attractive additional income in the event of a possible trend reversal.
With a short put, on the other hand, profits are possible with a high volatility index and high VVIX. This scenario suggests falling volatility; the sold option then expires worthless and you can keep the premium.
Overall, this makes the double volatility index a important tool for all those who Trade options would like to. Unlike the VIX or the VSTOXX, it is not one of the central indices that are indispensable for estimating market developments, but it does provide important insights into the strength and possible duration of trend movements!
