Your Broker for worldwide trading

DGI SAMPLE PORTFOLIO: THE MICROSOFT SHARE

  • With its software product range, Microsoft offers its customers a consistent, closely networked offering as an ecosystem that is difficult to replace. This moat is flanked by a historically grown monopoly thanks to the Windows operating system.
  • The sales model based on licenses and subscriptions provides Microsoft with recurring revenue while at the same time ensuring high customer loyalty and high barriers to market entry. Microsoft increased its operating margin from 24 % in 2016 to 45 % today.
  • Microsoft is rated by Standard & Poor's with the highest investment grade AAA (the only company in the world besides Johnson & Johnson). The healthy balance sheet with extremely low debt and a moderate goodwill position forms a solid foundation.
  • The top management around CEO Satya Nadella has established a diversified product and service portfolio in which different product divisions within the three business segments ensure growing sales. The cloud division has made a lasting impression as a growth driver.
  • Click here for the DGI model portfolio and here to the overview of this series The dividend custody account
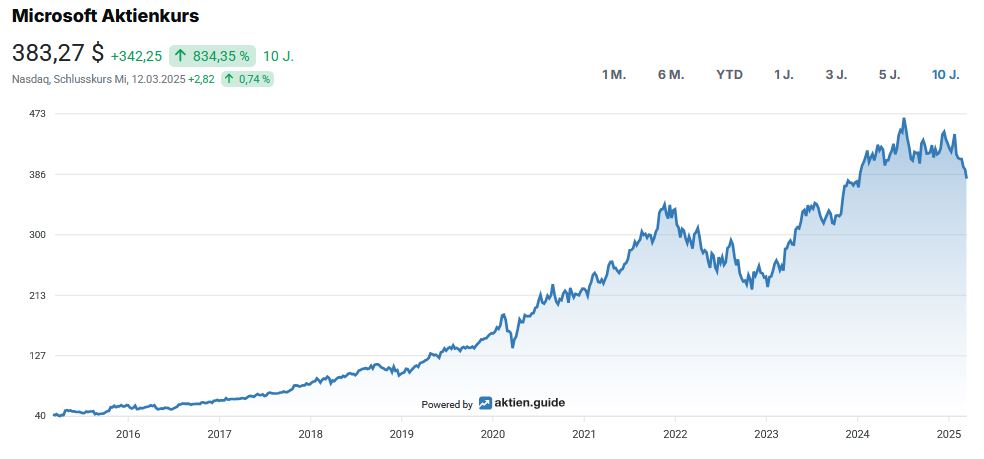
Line chart showing the rise in Microsoft's share price from below USD 50 in 2016 to over USD 380 in 2025, with a peak in early 2025 and a slight decline thereafter.
Microsoft share chart (source: aktien.guide)

Company profile and business model: Who is Microsoft and what does it do?

It is no exaggeration to say that Microsoft is a company of superlatives. Founded in 1975 by Bill Gates and Paul Allen founded in Albuquerque, developed into the dominant market leader for PC operating systems (Windows) and Application software for productive work (Office package consisting of Word, Excel, PowerPoint, Outlook, etc.) has become a major player in the Cloud area, social media and in the Gaming division.

In the almost 50 years of the company's history, Microsoft had only three CEOs. According to the founding father Bill Gates, with Steve Ballmer and Satya Nadella two equally charismatic personalities have been shaping the fortunes of the IT group in their own special way. However, the second most valuable company in the world after Apple is by no means an uncontroversial company. Numerous debates about tax optimization and avoidance as well as high-profile legal disputes about Microsoft's dominant competitive position have accompanied the company based in Redmond, Washington, for decades. This has been accompanied by a large number of AcquisitionsMicrosoft's business model in its current form
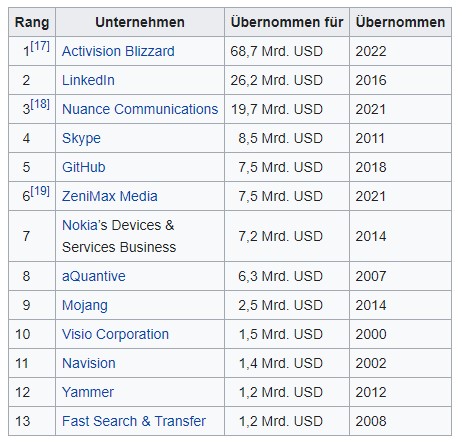
Table with companies, acquisition sums in billions of US dollars and acquisition years. Example: Activision Blizzard, 68.7 billion US dollars, 2022. 13 entries in total.
Largest acquisitions by Microsoft (Source: Wikipedia)

The business model from Microsoft is divided into three central segments:
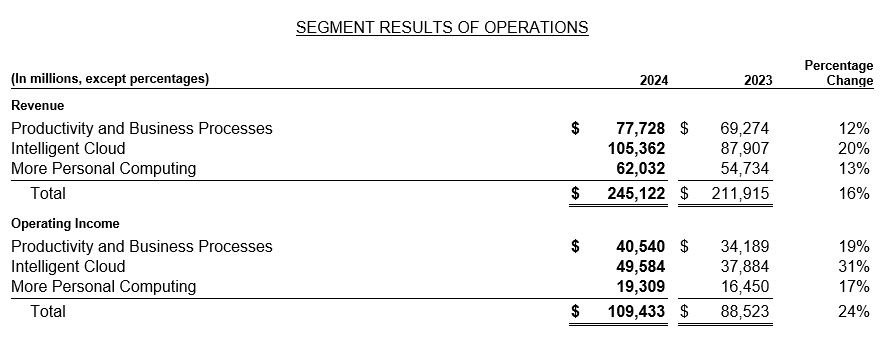
Table with segment results for 2024 and 2023. Revenue: USD 245,122 million (2024), USD 211,915 million (2023). Operating result: USD 109,433 million (2024), USD 88,523 million (2023).
The three business segments of Microsoft (Annual Report 2024, p. 31)

The segment Productivity and business processes consists of Office Commercial (Office 365 subscriptions, individual solutions such as Exchange, SharePoint, Microsoft Teams, Office 365 Security and Compliance) and Office Consumer (Microsoft 365 Consumer subscriptions, OneDrive, Skype) as well as the career platform LinkedIn and Business Intelligence/Customer Relationship Management tools (combined under Dynamics Business Solutions).

Under the segment Intelligent Cloud the server products and cloud services, including the well-known Azure Cloud or the platform popular in the software engineering community GitHub for version management and better collaborative work. Microsoft Azure is the second-largest service provider in the growing cloud computing market behind Amazon Web Services and before Google Cloud.
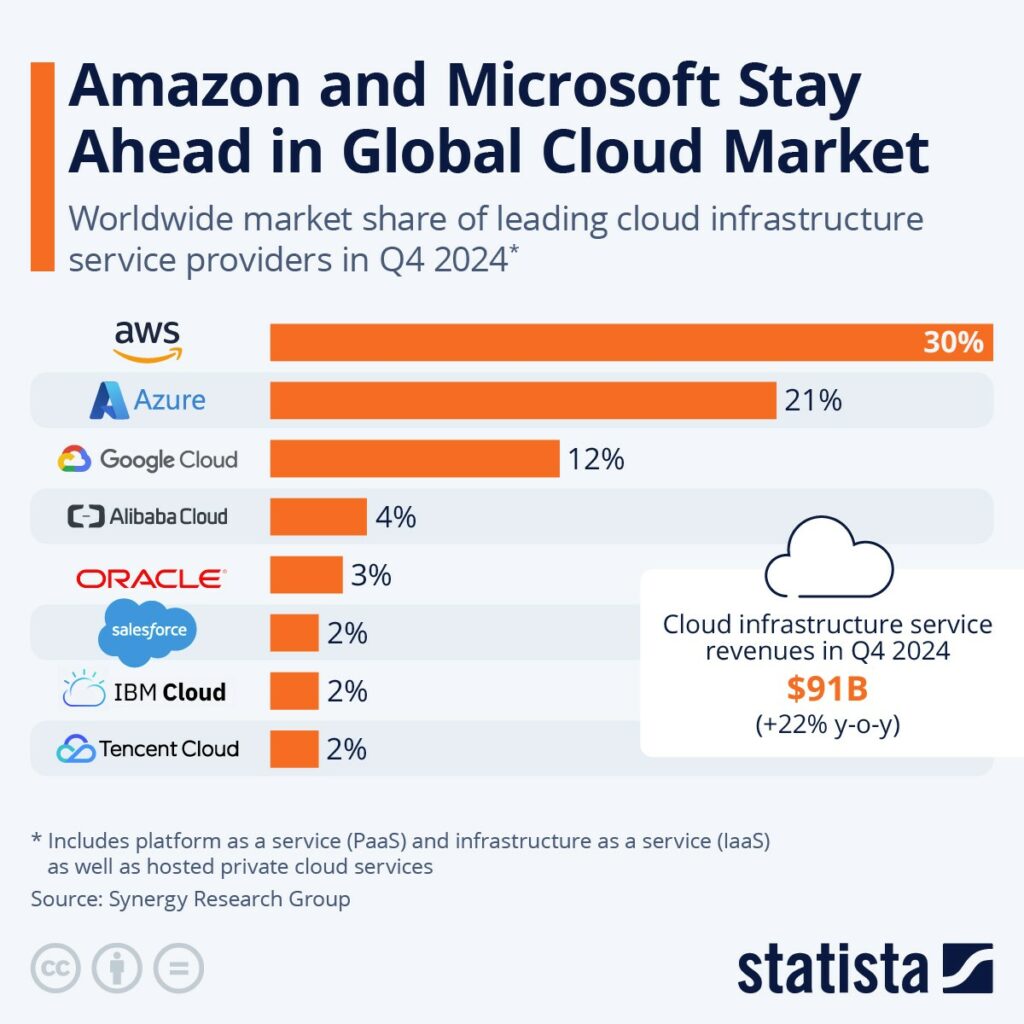
The bar chart shows that AWS has a market share of 30 %, Azure of 21 % and Google Cloud of 12 % for cloud services in the fourth quarter of 2024. Total revenue amounts to USD 91 billion, an increase of USD 22 % compared to the previous year. Data from the Synergy Research Group.
Largest cloud service providers (source: Statista)

The third and therefore last business division called More Personal Computing consists of the nucleus of the company's success in the late 20th century, namely the Windows operating system and all associated license models. In addition, devices such as Surface and other PC accessories, gaming with the Xbox game console, Xbox Game Pass and other subscriptions, video games as well as third-party video game license fees and advertising revenue generated by the search engine Bing recognized in this segment.

Microsoft has a strong position in the gaming sector with the Xbox. With this video game console, they are competing with the other two major players Sony (Playstation) and Nintendo (Switch). Microsoft strengthened this division with the acquisition of Activision Blizzard around imposing USD 68.7 billion.

At the ownership structure from Microsoft, the extremely high proportion of Institutional investors of the market. This amounts to just under 75 percent and is usually fed by the "usual suspects" of asset managers.

About the turnaround story since the CEO position was taken over by Satya Nadella a lot has already been reported in the media. The most striking was certainly the establishment of the cloud business under the leadership of the Indian-born CEO, who celebrated his 30th anniversary at Microsoft in 2022. Hardly surprising, as Nadella was responsible for the cloud business before moving to the top of the Group. Cloud area responsible.

A table listing the investors, the value of shares held in millions, the percentage of shares outstanding and the number of shares held, including companies such as Vanguard Group and BlackRock.
Microsoft's ownership structure (Source: tikr.com)

Industry profile and competitive situation

The characteristics of Microsoft's business model shape the Comparison with listed competitors at the overall Group level is not very useful. The peer group is made up of different competitors in the various business segments. Without claiming to be exhaustive, these include Amazon, Alphabet, Apple, Crowdstrike, ServiceNow, Nintendo, Sony, etc. In any case, you can form your own opinion based on the evaluated fundamental data of Microsoft and possibly a segment-by-segment comparison with the leading companies in each business segment.
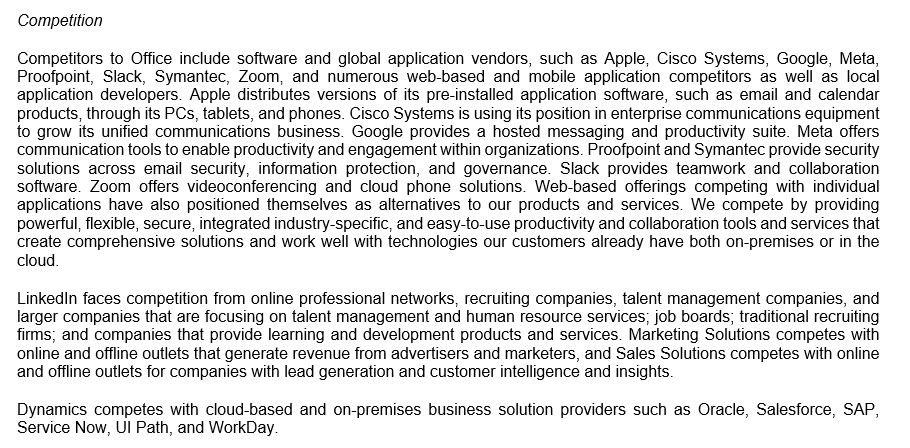
Text detailing Office's competitors, mentioning companies such as Apple, Cisco Systems and Google and their communication tools, web conferencing, collaboration software and business solutions.
The various competitors of Microsoft (Annual Report 2024, p. 16)

The financial situation at Microsoft

After gaining an overview of the industry in general and taking a closer look at the company, its management and competition, we take a look at Microsoft's balance sheet and the key financial figures derived from it. The focus here is on the following aspects Growth, profitability and the Financing.

To analyze the financial situation, the first step is to look at the development of sales, profit and free cash flow. I have already discussed the internal distribution of turnover by segment in the chapter on the business model above. On average, the top line has grown over the last five years by 14.3 percent p.a. which is attributable in particular to the impressive growth rates in the booming cloud business.
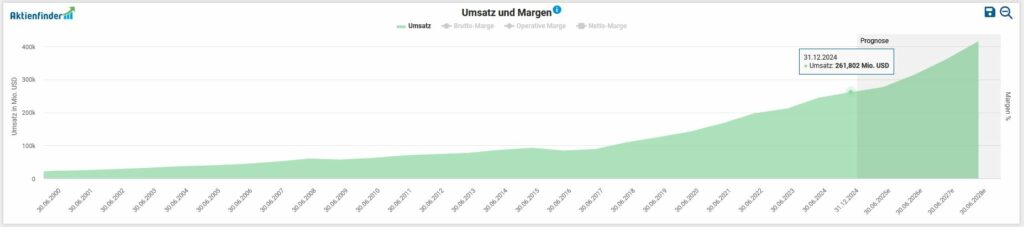
Line chart showing the steady increase in sales and net margin from 2013 to 2022, with progress marked annually.
Development of Microsoft's turnover (source: Aktienfinder)

The (adjusted) Earnings per share we have seen an extremely dynamic upward trend for ten years. If we look at the past financial year 2024, the Adjusted earnings per share at 29 percent (USD 12.62 vs. USD 9.81). In the past financial year, Microsoft generated a Net profit from over 88 billion USDif the special effects are deducted from the annual result.
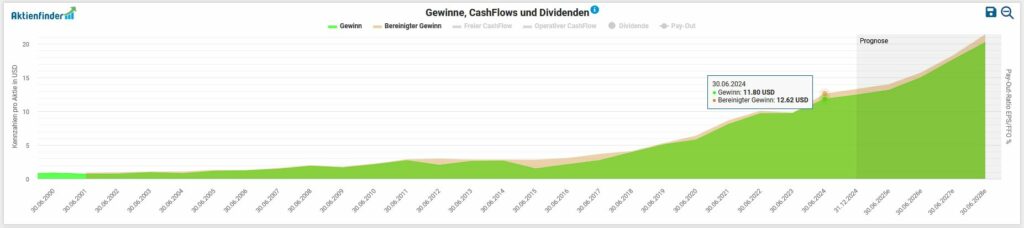
A line chart showing an upward trend in earnings, cash flows and dividends from 2003 to 2022, with data points and a highlighted section for the average value over the last few years.
Development of Microsoft's earnings per share (source: Aktienfinder)

The amount available to the company Free Cash-Flow can be used for capital investments in organic growth, research and development, repayment of debt, expansion via company acquisitions, distributions of (increasing) dividends or share buybacks. In absolute figures - which I primarily like to use - the picture of operating and free cash flow as well as capital investments (CapEx) for the period 2016 to 2024 is as follows:
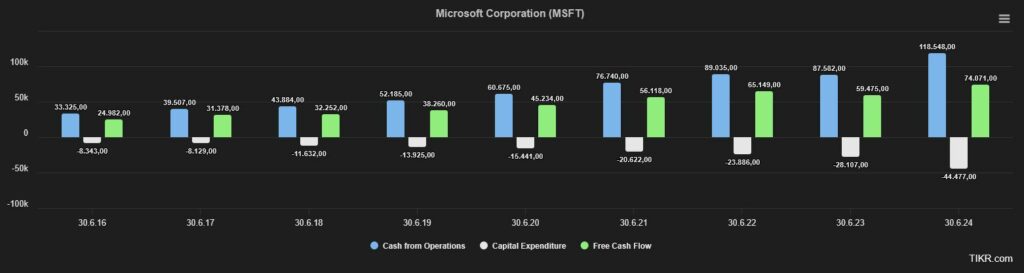
Bar chart showing the cash flow from operating activities, capital expenditure and free cash flow of Microsoft Corporation from March 2016 to March 2023. The bars represent various rising and falling values.
Development of Microsoft's free cash flow (source: tikr.com)

A look at the Debt situation tells us that, based on the last financial year, Microsoft has a share of interest-bearing financial liabilities of USD 97.8 billion, which in turn is offset by cash and cash equivalents and securities totaling USD 75.5 billion. If we now divide the remaining net debt of USD 22.3 billion by the most recent EBITDA of USD 129.4 billion, the result is 0.2. This result is miles below the threshold value of 3, which is considered critical. I will therefore spare myself an in-depth examination of the maturity structure of the long-term liabilities and their interest conditions.
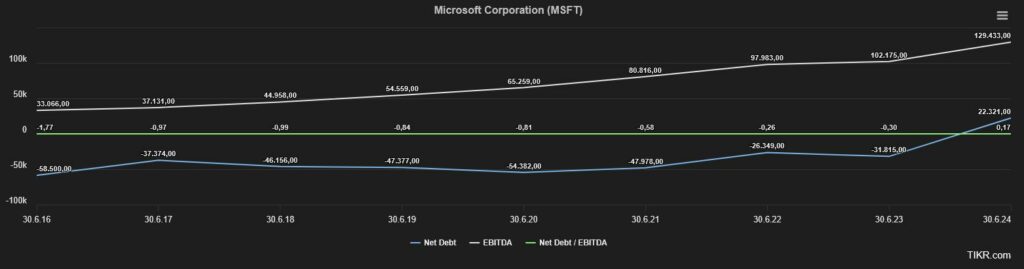
Line chart of Microsoft Corporation (MSFT) financial data: net debt, EBITDA and net debt/EBITDA from Q3 2016 to Q3 2023. EBITDA is gradually increasing, net debt is decreasing and net debt/EBITDA is fluctuating.
Development of Microsoft's net debt and EBITDA (source: tikr.com)

Finally, we look at the Profitability of Microsoft based on the development of gross, operating and net margins. In addition to the impressive net margin of around 35%, the stability of the margins over the years should be emphasized positively. This is an adequate indicator of the IT group's robust business model.
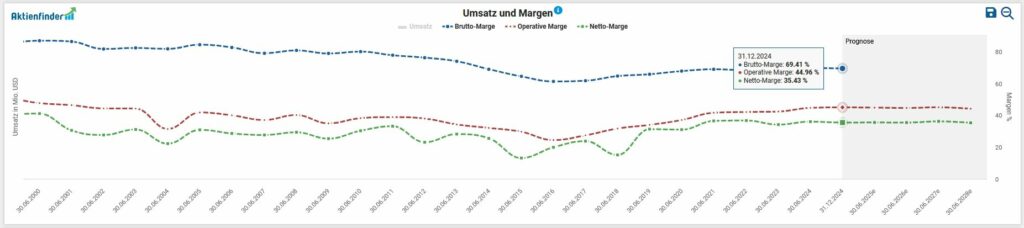
A line chart shows the development of the gross, operating and net margins from June 2023 to April 2024. The gross margin is at its highest and the net margin at its lowest. A forecast is shown from March 2024.
Development of Microsoft's margins (source: Aktienfinder)

Opportunities & risks

Microsoft's monopoly-like position in the Windows and Office sector based on a highly profitable licensing model provides a certain amount of leeway when it comes to pricing in addition to recurring revenues. In the operating system and application software product segments, alternative applications from the competition or open source have a niche existence. An end to the status quo is not foreseeable in the medium term.

Although the competition in cloud computing with the two largest competitors Alphabet and AWS is fierce, once a decision has been made in favor of a cloud service provider, there is a lock-in effect. Due to the costs associated with switching, the willingness to do so is correspondingly low. Microsoft is represented in all three business segments with high-growth products and services. The increasing focus in the areas of IT security and gaming is benefiting from ongoing investments by business and private customers in these two domains.

Thanks to long-term growth in sales and cash flow, coupled with billions in investment costs in the field of AI, the company has kept its net debt close to zero for years. The highest rating awarded by S&P Credit rating with AAA confirms Microsoft's excellent credit rating.

Microsoft's monopolistic position, which is partly established today, required a number of antitrust court decisions in the past. A good 20 years ago, the Group was faced with the prospect of being split into two separate companies in the first instance, which was ultimately averted. The planned takeover of Activision Blizzard also occupied the Competition authorities inside and outside the United States. The regulatory environment for AI applications is becoming increasingly complex in the European Union and North America.

One of the biggest risks associated with Microsoft is the "priced for perfection" argument. Microsoft's notoriously high valuation can be presented as a risk by weaker growth forecasts in the future, depending on the individual timing of the share purchase.

Finally, the dynamic development of the various attack vectors and the increased intensity of targeted cyber attacks by criminal, professional groups pose a risk to Microsoft's diverse software portfolio that is difficult to assess. Due to its scaling, the technology group is exposed to Cyber attacks considerably exposed.

Current valuation of the Microsoft share

For the valuation of companies, I use the so-called Enterprise Value (EV) is used. In the case of a takeover, the EV indicates the amount required to purchase the assets required for operations and excludes the non-operating assets. I relate this key figure to operating profitability (before interest, taxes and investments (CAPEX)), expressed as EBITDA. The prevailing opinion is that a value of less than 10 indicates a „healthy valuation“ - as is always the case with generic Rules of thumb the company-specific context must be considered in the analysis by the careful investor himself. In the case of Microsoft, we have to consider a similar Valuation result of 20.1 almost exactly two years ago:
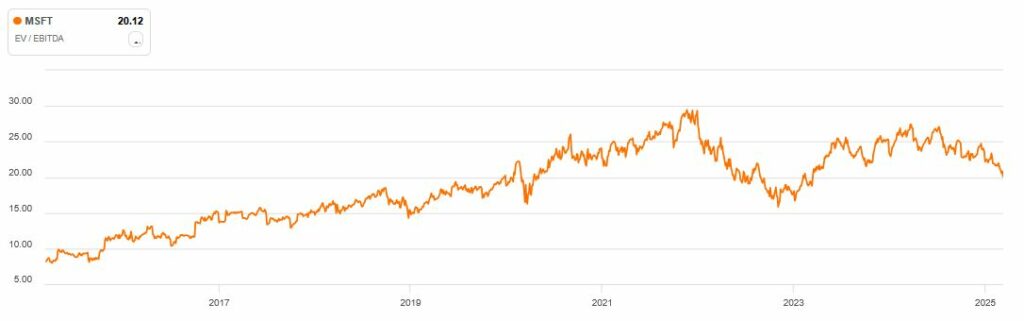
Line chart showing MSFT's EV/EBITDA ratio from 2015 to 2025, with fluctuations peaking around 2021-2022 before declining in 2023.
Enterprise Value to EBITDA from Microsoft (Source: Seeking Alpha)

The Maximum decrease in the last six years amounted to approx. 36 percent in the bear market year 2022:
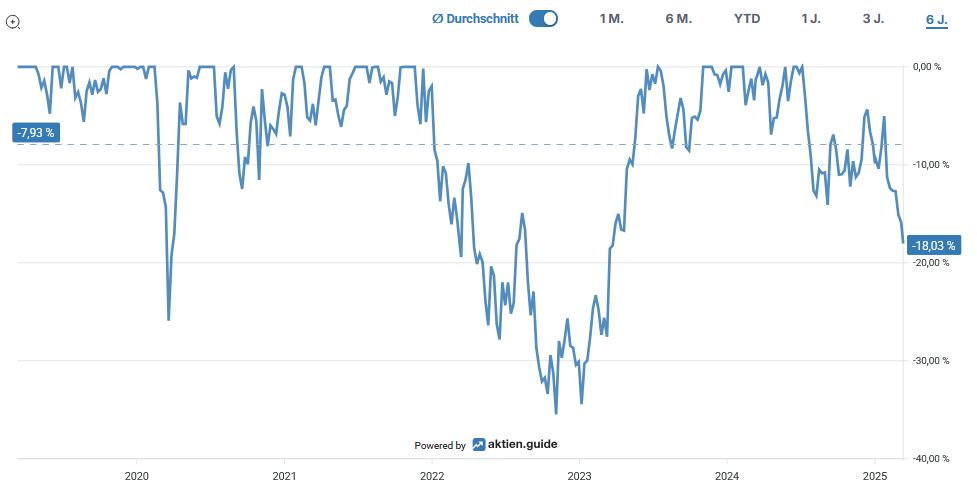
Line chart showing the percentage change over time from 2020 to 2025, with significant drops around 2022 and early 2023. Marked points at around -7.93 % and -18.13 %.
Underwater chart of Microsoft (source: aktien.guide)

Over the past six years, an investment in Microsoft has yielded Total Return, including dividends received, a Overall performance from 256 percent for the investor:
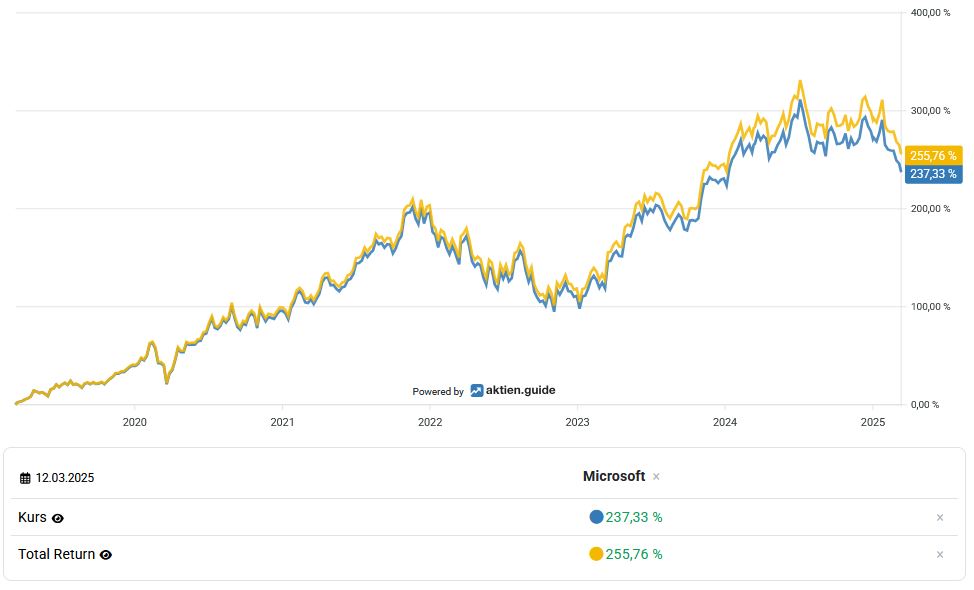
A line chart comparing the performance of Microsoft Price (237.33 %) and Total Return (255.76 %) from 2020 to 2025, showing that both are increasing over time with some fluctuations.
Total return of Microsoft (source: aktien.guide)

Capital allocation of Microsoft

Since meanwhile 23 years Microsoft has been paying its shareholders a higher dividend every year. With this impressive series of dividend increases, the IT giant is well on its way to soon becoming the Dividend aristocrat to be able to boast.

The bar chart shows Microsoft's annual dividend from 2003 to 2023 in US dollars. The dividend starts at USD 0.30 in 2003 and rises to USD 4.33 by 2023, with steady growth over the years.
Microsoft's dividend history (source: aktien.guide)

At the current share price of USD 383.27, this results in a Dividend yield from 0.87 percent. The Five-year dividend growth rate amounts to 10.3 percent p.a. or 10.4 percent p.a. in the Ten-year period. The company last increased its dividend by 10.7% in September 2024. To round things off, here is an overview of the last five dividend increases:

  • 2023: +10,3 %
  • 2022: +9,7 %
  • 2021: +10,7 %
  • 2020: +9,8 %
  • 2019: +10,9 %

The quartalsweise ausgeschüttete Dividende currently amounts to USD 0.83 per share and is paid out at the end of each quarter (March, June, September, December).

If we take the average value of the Free Cash Flow of the last three years as the basis for determining the Payout ratio we end up with an extremely comfortable result of 29.9 percent for the payout ratio of Microsoft.

Over the past six years, the Number of shares outstanding added together by 3.2 percent reduction:
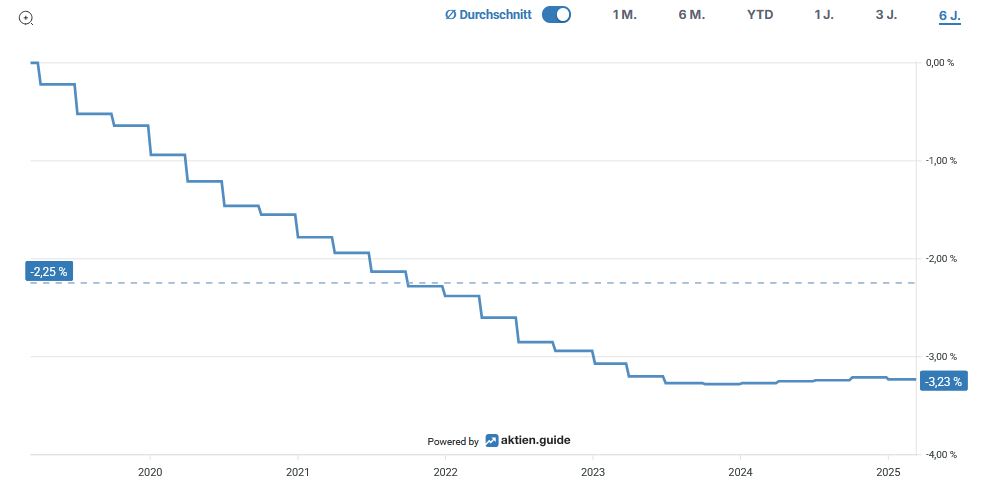
Line graph showing a percentage decrease from -0.25 % in 2020 to -3.2 % in 2025, with a steady downward trend.
Share buybacks by Microsoft (source: aktien.guide)

Most recently, the management bought back almost USD 12 billion of its own shares in the 2024 financial year:
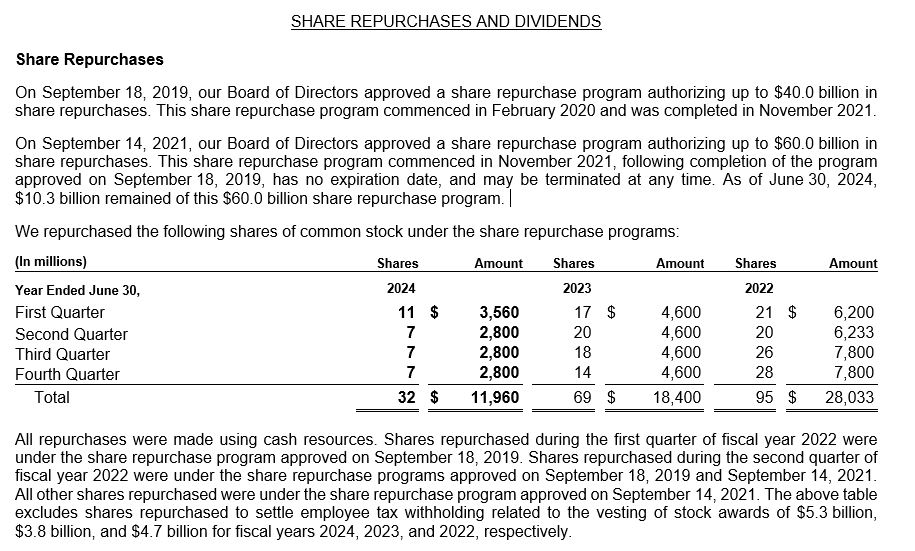
Text excerpt with detailed information on share buyback programs and financial figures from 2019 to 2024.
Microsoft share buyback program (source: Annual Report 2024, p. 8)

Conclusion: Considerations for my decision to invest in Microsoft

In my analysis of Johnson & Johnson I have tried to characterize the investment by analogy with the basic line-up of a soccer team. While the pharmaceutical stock represents the heart of a strong and reliable defense, Microsoft is a reliable mainstay for the portfolio's offense. Long-term growth, a flawless balance sheet and the US group's strategic focus on growing markets in conjunction with the integration of artificial intelligence solutions into the cloud division speak in favor of the IT giant. There is hardly a company in the technology sector that is currently as broadly positioned in the market as Microsoft.

The management team led by charismatic CEO Satya Nadella has established a diversified product and service portfolio in which different revenue streams are managed highly profitably within the three business segments. Although the cloud division is preparing to overshadow the other two segments, there is no danger of critical dependency on a single growth driver. To conclude in soccer jargon: even the best defense needs an accurate offense to win the championship. Microsoft undoubtedly fulfills the quality criteria for an investment in the DGI model portfolio.


THE NEXT WEBINARS WITH CLEMENS FAUSTENHAMMER AT CAPTRADER

Ein professionelles Porträt eines lächelnden Mannes namens Clemens Faustenhammer in dunkler Jacke und blauem Hemd vor unscharfem Hintergrund.
Clemens Faustenhammer

The private investor from Austria Clemens Faustenhammer with a focus on dividend growth stocks and total return, lives with his family near Vienna. As a graduate in business administration with a strong passion for economic history, he has held various management positions in the financial sector for over a decade. The stock market plays an important role both professionally and privately. He has been investing in the capital market since 2005, with a particular focus on individual stocks for the past ten years.

View all posts
Mandatory information and disclaimer

This is a marketing communication within the meaning of Section 63 (6) of the German Securities Trading Act and does not contain investment strategy recommendations, investment recommendations or financial analyses in accordance with Section 85 of the German Securities Trading Act and Article 20 of the Market Abuse Regulation. It therefore does not fulfill the legal requirements to guarantee the objectivity of investment strategy recommendations/investment recommendations/financial analyses. CapTrader GmbH or its employees are therefore not legally prohibited from trading or providing services in the securities products mentioned therein prior to publication of the information.

Past performance, simulations or forecasts are not a reliable indicator of future performance. Mandatory information and limitation of liability for CapTrader and any third-party content providers can be found at https://www.captrader.com/marketingmitteilung/angaben
Please note that investing in financial instruments involves high risks and take note of our disclaimer and the mandatory legal information at the locations indicated.

  1. Mandatory information

Responsible: CapTrader GmbH, Elberfelder Straße 2, 40213 Düsseldorf; Commercial Register Number: HRB 86537 Düsseldorf Local Court; VAT ID DE323771603; Managing Directors Andreas Weiß, Christian Weiß, Michael Heyder; Tel: +49 211-740786-00, Fax: +49 211-740786-90.

Zuständige Aufsichtsbehörde: Bundesanstalt für Finanzdienstleistungsaufsicht, Graurheindorfer Straße 108, D – 53117 Bonn und Marie-Curie-Str. 24-28 D – 60439 Frankfurt am Main, Tel: 0228 4108 – 0 Fax: 0228 4108 1550 E-Mail: poststelle@bafin.de; Institutsnummer 10156708

Conflicts of interest CapTrader in marketing communications: CapTrader GmbH confirms that it does not hold any positions in the mentioned financial instruments beyond the positions mentioned in the marketing communication itself, if applicable. There are also no other conflicts of interest within the meaning of CapTrader GmbH's Financial Analysis and Marketing Communication Policy.

Conflicts of interest and mandatory disclosures by the third-party content provider for marketing communications with financial instrument recommendations: See under https://www.captrader.com/marketingmitteilung/angaben  to creators of third-party content

The copyright to the marketing communication is reserved. Reprinting and distribution is only permitted with our consent.

  1. Disclaimer

By accepting the content, the recipient accepts the binding nature of the limitation of liability.

a) Disclaimer for third-party content

CapTrader GmbH offers authors - such as editors, guest commentators, agencies and companies - the opportunity to publish comments, analyses, news and company announcements. Their opinions do not necessarily reflect the opinions and views of CapTrader GmbH and its employees. CapTrader GmbH assumes neither liability nor guarantee for this content. This applies in particular to incomplete or incorrectly reproduced reports, incorrect price information and editorial errors. Liability claims relating to material or immaterial damage caused by the use or non-use of the published information or by the use of incorrect or incomplete information are fundamentally excluded.

b) Exclusion of liability for CapTrader's own content

CapTrader has taken its own information in this marketing communication from sources believed to be reliable, but has not verified all such information itself. Accordingly, CapTrader makes no warranties or representations as to the accuracy, completeness or correctness of the information or opinions contained herein. Subsequent changes cannot be taken into account. The marketing communication does not constitute an offer or solicitation to buy shares of the issuer and is in no way a substitute for advice appropriate to the investor and the property. We cannot verify whether the information in the marketing communication is in line with your personal investment strategies and objectives. We recommend that you consult an investment advisor for advice that is appropriate to the investor and the property. The marketing communication cannot and should not replace a securities prospectus and/or expert investment advice required for an investment. It can therefore never be the sole basis for an investment decision. By accepting the marketing communication, the recipient accepts the binding nature of the above limitation of liability.

CapTrader provides the information despite careful procurement and provision only without guarantee for the correctness / completeness, timeliness or accuracy and availability of the stock exchange and economic information, prices, rates, indices, general market data, valuations, assessments and other accessible content held and displayed for retrieval. This also applies to third-party content. Historical observations and forecasts are not a reliable indicator of future developments. The facts presented in particular in connection with product information are for illustrative purposes only and do not permit any statements to be made about future profits or losses. Any conditions stated are to be understood as non-binding indications and are dependent on market developments on the day of conclusion.

CapTrader accepts no liability for any direct or indirect damage caused by and/or related to the distribution and/or use of this marketing communication.

The information, opinions and statements correspond to the status at the time of preparation of the marketing communication. They may be outdated due to future developments without the publication being changed.

CapTrader is not obliged to update, amend or supplement the information in this marketing communication if a circumstance mentioned in this publication or a statement, estimate or forecast contained therein changes or becomes inaccurate. The presentation of the performance of financial instruments over previous periods does not provide a reliable indication of their future performance. No guarantee can therefore be given for the future price, value or income of any financial instrument mentioned in this publication.

Despite careful control of the content, we assume no liability for the content of external links. The operators of the linked pages are solely responsible for their content.

Distribution: This publication may only be distributed in accordance with the laws of the respective countries, and persons in possession of this publication should inform themselves about the applicable local regulations. The information contained herein is not intended for natural or legal persons who, due to their place of residence or business, are subject to a foreign legal system that imposes restrictions on the distribution of such information. The contents are therefore exclusively in German. In particular, this publication contains neither an offer nor an invitation to purchase securities to citizens of the USA, Great Britain and Australia.

Taxes: The tax treatment of financial instruments depends on the personal circumstances of the respective investor and may be subject to future changes, which may also have a retroactive effect.

Historical observations and forecasts are not a reliable indicator of future developments. The facts presented in particular in connection with product information are for illustrative purposes only and do not permit any statements to be made about future profits or losses. Any conditions stated are to be understood as non-binding indications and are dependent on market developments on the day of conclusion.

CapTrader accepts no liability for direct or indirect damage caused by and/or in connection with the distribution and/or use.

The information, opinions and statements correspond to the status at the time of preparation of the marketing communication. They may be outdated due to future developments without the publication being changed.

CapTrader is not obliged to update, amend or supplement the information if a circumstance mentioned in this publication or a statement, estimate or forecast contained therein changes or becomes inaccurate. The presentation of the performance of financial instruments over previous periods does not provide a reliable indication of their future performance. No guarantee can therefore be given for the future price, value or income of any financial instrument mentioned in this publication.

Despite careful control of the content, we assume no liability for the content of external links. The operators of the linked pages are solely responsible for their content.

Distribution: This publication may only be distributed in accordance with the laws of the respective countries, and persons in possession of this publication should inform themselves about the applicable local regulations. The information contained herein is not intended for natural or legal persons who, due to their place of residence or business, are subject to a foreign legal system that imposes restrictions on the distribution of such information. The contents are therefore exclusively in German. In particular, this publication contains neither an offer nor an invitation to purchase securities to citizens of the USA, Great Britain and Australia.

Taxes: The tax treatment of financial instruments depends on the personal circumstances of the respective investor and may be subject to future changes, which may also have a retroactive effect.

Email:

info@captrader.com

Send e-mail

Phone:

Hotline (Germany)
0800-8723370

Hotline (International)
00800-08723370

Further contact options