



The most important facts in brief
- Verbund is Austria's largest electricity utility company and one of Europe's leading hydropower producers, covering around 40-50 percent of Austria's electricity demand.
- Thanks to its very low debt, the company is investing a total of up to €15 billion by 2030 for the energy transition.
- In the long term, the utility wants to position itself as a European hydrogen player for the decarbonization of energy-intensive industries.
- Unlike regional utility companies (EVN, Wien Energie, etc.), Verbund primarily operates as a large-scale producer and wholesaler.
- If you want to read more from Clemens Faustenhammer, then click here DGI model portfolio
Who is Verbund AG?
The history of the Austrian energy provider dates back to the post-World War II reconstruction period. Verbund AG was founded in 1947 with the 2nd Nationalization Act as „Österreichische Elektrizitätswirtschafts-AG." The central task was to rebuild Austria's electricity system, which had been destroyed by the war. With the help of Marshall Plan funds, the Kaprun hydropower plant was completed in 1952. In 1955, Austria's electricity demand could once again be met exclusively from domestic sources for the first time.
In the 1960s and 1970s, the company further expanded its position through investments in hydropower. A decisive event was the 1978 referendum against the Zwentendorf nuclear power plant, which subsequently led to an increased focus on hydropower. During this phase, significant facilities such as the Danube power plants Altenwörth and Malta were built.
In 1988, a fundamental change of course took place with the partial privatization as part of an IPO, in which 49 percent of the shares were sold and 51 percent remained in the hands of the Republic of Austria. At the same time, Verbund AG took over the federal government's shares in numerous special companies, i.e. regional utilities such as Ennskraftwerke AG. The most significant turning point came in 1995 with Austria's accession to the EU, which initiated the liberalization of the electricity market. In response to the changed market conditions, the company restructured itself. In 1999, Verbund AG was the first company to comply with the EU regulations on the unbundling of electricity generation and transmission under company law by spinning off Austrian Power Grid AG (APG), which is still a wholly-owned subsidiary of Verbund today and is the operator of Austria's largest high-voltage grid. Verbund also holds a 51 percent stake in Gas Connect Austria GmbH. The company's core business is the marketing of cross-border transport capacities and the provision of capacities for natural gas required domestically. As the operator of a high-pressure natural gas pipeline network with a length of around 900 kilometers, Gas Connect Austria is also responsible for its safe operation.
The following years after the liberalization of the European electricity market were characterized by internationalization and further portfolio adjustments by Verbund. Today, the Vienna-based group is Austria's largest electricity utility company and one of Europe's leading hydropower producers, with over 90 percent of its electricity generation coming from renewable hydropower.
Business Model and Strategy of Verbund
At the core of the business model, the company acts as an integrated energy provider along the entire value chain, meaning from electricity generation through transmission to trading and distribution.
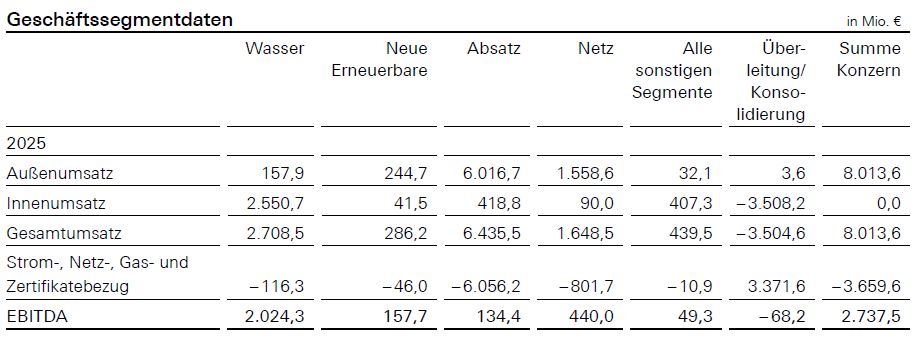
The organizational structure comprises five business segments: Hydropower, New Renewables (Wind and Photovoltaics), Sales (trading and distribution activities), Grid (APG's activities), and All Other Segments (which combines thermal generation, services, and investments).
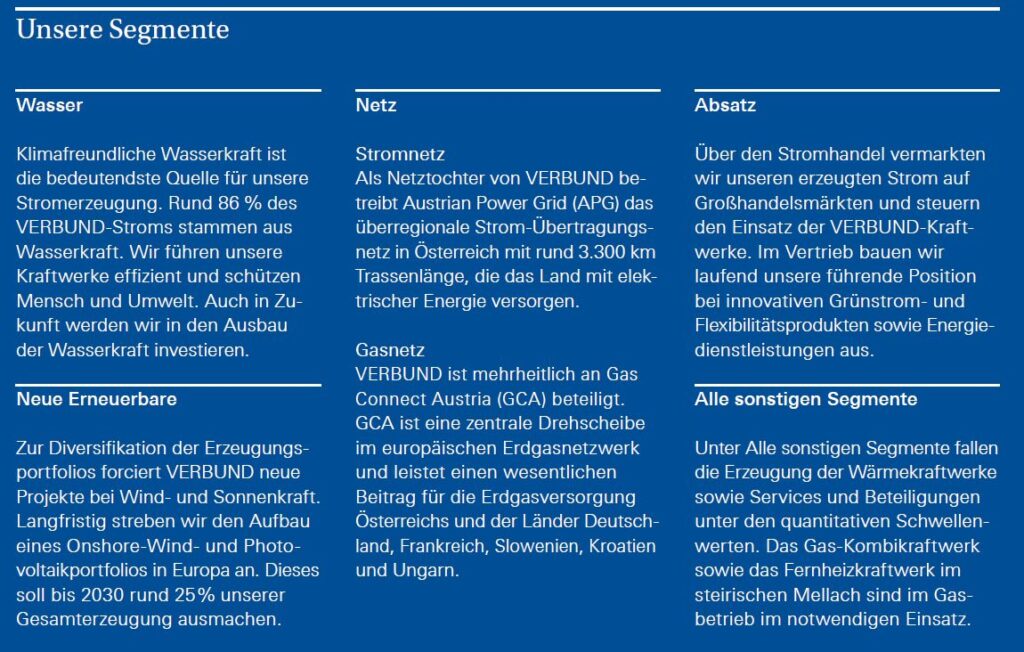
The core business is based on electricity generation from renewable sources, with over 90 percent coming from hydropower. The portfolio includes run-of-river and storage power plants in Austria and Bavaria, as well as an increasing number of wind and solar farms in selected European markets. Sales are made to large customers, resellers, and end consumers in Austria and Germany.
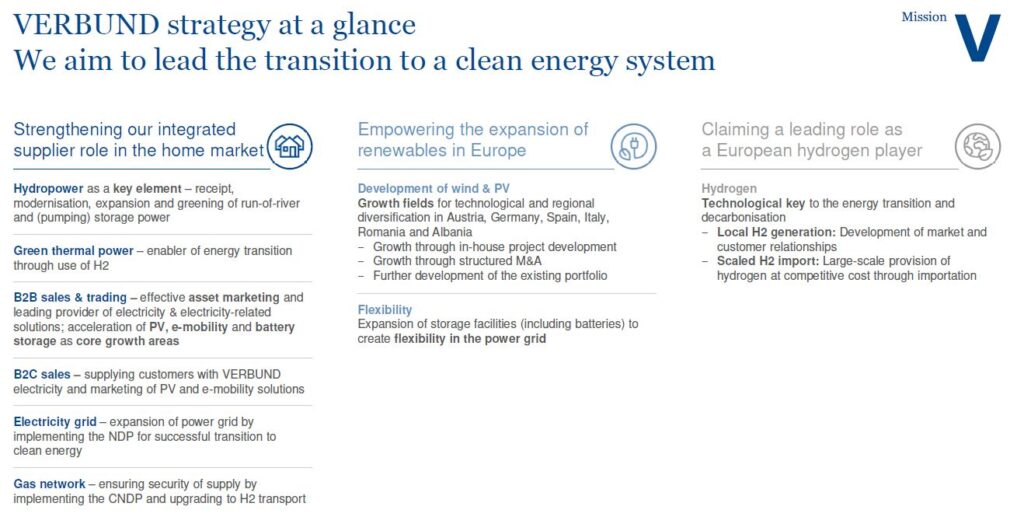
The Consolidation Strategy 2030, operationalized through the Strategy Program Mission V, is based on three strategic pillars, each making a significant contribution to the decarbonization of the energy system:
- Strengthening the integrated domestic market (Austria/Germany): In its domestic market, Verbund aims to strengthen its position as an integrated energy provider, further expand hydropower, increase pumped storage capacity, and support industry and end customers in the energy transition with green electricity and decarbonization solutions. The necessary expansion of grid infrastructure is taking place in parallel.
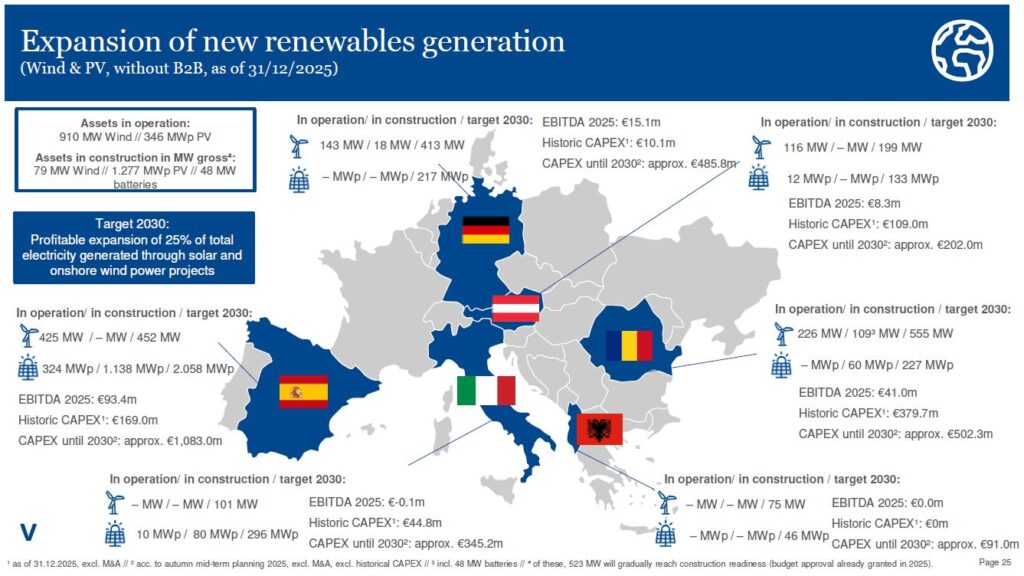
- Expansion of renewable energies in Europe: Through the expansion of new renewable power generation facilities in wind and photovoltaics in selected target markets in Europe, Verbund aims to generate around 25 percent of its total electricity production from these energy sources by 2030. This will be achieved through in-house development in Austria, Germany, and Southeastern Europe, as well as through structured M&A activities and partnerships in markets such as Spain and Italy.
- Positioning as a European hydrogen player: Verbund positions itself as a partner for green hydrogen to decarbonize energy-intensive industries. The company is involved in large-scale projects such as hydrogen imports from North Africa via the South H2 Corridor or the construction of electrolysis plants.
Accordingly, the consortium plans extensive investments in new renewable energies as part of Mission V, with the previously outlined focus on wind, solar, and hydrogen.
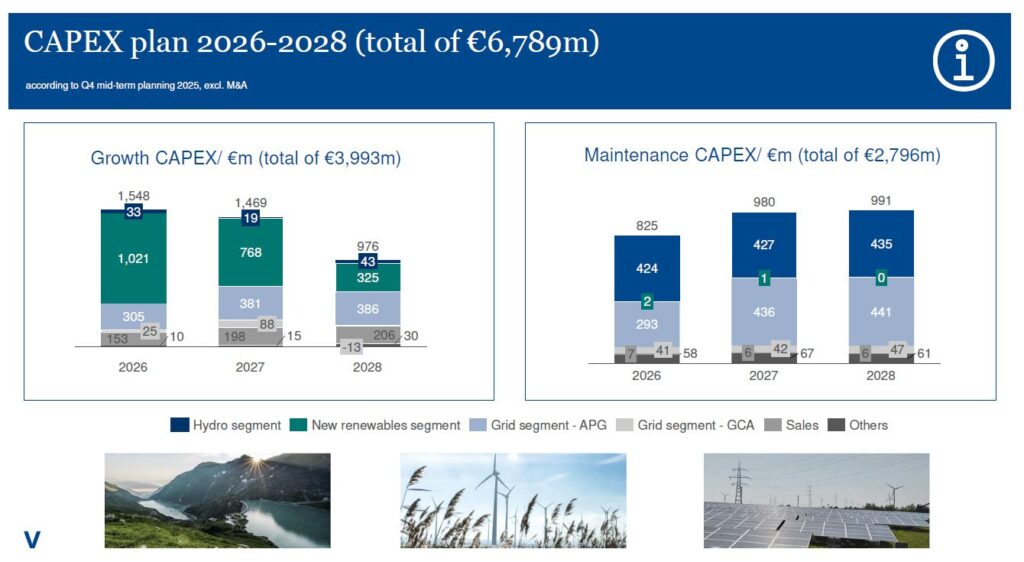
The investment plan (CapEx plan) allocates a total of 6.8 billion euros for the period 2026–2028. Of this, 2.1 billion euros will go into wind and photovoltaics, 1.35 billion euros into hydropower expansion, and 2.2 billion euros into power line infrastructure. By 2030, Verbund plans investments of approximately 15 billion euros in the energy transition, which are expected to result in 8 TWh of additional green electricity generation.
Owners and Management of Verbund
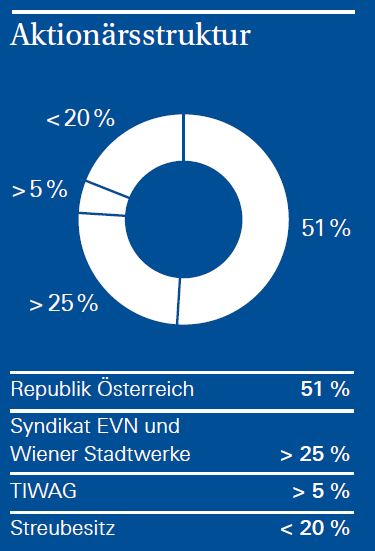
The ownership structure of Verbund AG has been characterized by stable majority ownership by the public sector since its partial privatization in 1988. Constitutionally, 51 percent of the shares are owned by the Republic of Austria, while the remaining 49 percent have been traded on the Vienna Stock Exchange since the IPO. The largest shareholders are EVN AG and Wiener Stadtwerke (City of Vienna) with approximately 25 percent, and the state of Tyrol with 5 percent. Free float comprises less than 20 percent and is dominated by institutional investors such as Vanguard or BlackRock. This structure, on the one hand, ensures the state's strategic influence over the company, which is central to Austria's energy supply, but on the other hand, allows access to capital through its stock market listing and subjects it to capital market discipline.
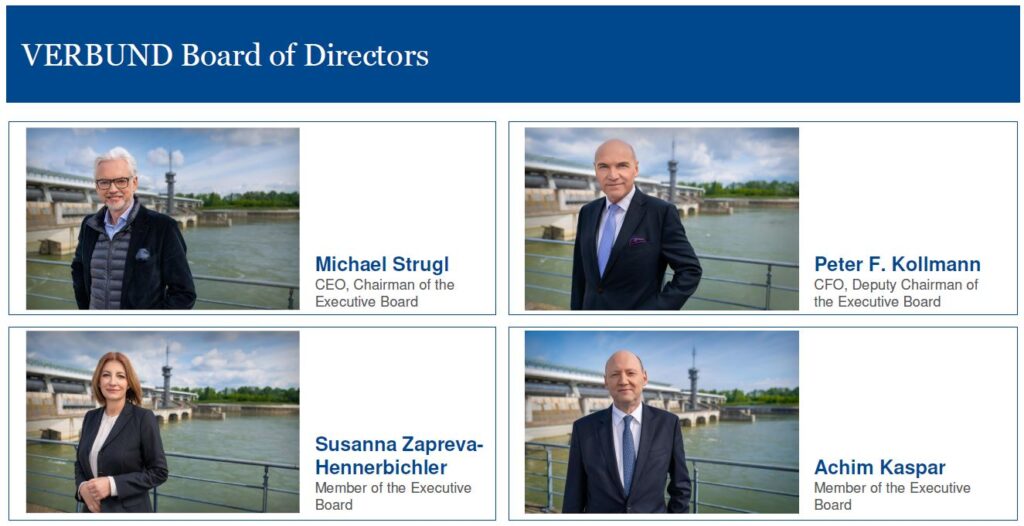
As of January 2024, the Executive Board of Verbund AG consists of four members. Michael Strugl has been confirmed as CEO and reappointed for another five years. Strugl has been a member of Verbund AG's Executive Board since 2019, serving as Chairman of the Executive Board since 2021. Prior to his work at Verbund, Strugl was a state councillor and deputy governor in Upper Austrian state politics. Peter F. Kollmann has been reappointed as Chief Financial Officer for four years with an option for extension and has simultaneously been appointed Deputy CEO. Achim Kaspar has been a member of Verbund AG's Executive Board since 2019 and is responsible for the hydropower generation sector as well as digitalization and occupational safety. Susanna Zapreva-Hennerbichler joined the Executive Board as the fourth member in January 2024. Her departmental responsibilities include energy generation from wind and solar power, as well as the hydrogen sector.
Industry profile and competitive situation
The Austrian energy supply sector presents itself as a highly fragmented structure, yet simultaneously concentrated among a few major players. In Austria, there are around 140 different electricity providers and about 40 different gas suppliers serving households, with some offers available nationwide while others are regionally limited.
Austria plays a significant role in international energy trade within Europe as a transit country. A large portion of Western Europe's imports from the Middle East, the Caucasus region, and Russia pass through Austria. The structure of Austrian energy suppliers follows a federal pattern. In addition to the supra-regional Verbund, there are nine energy suppliers in Austria, mostly majority or wholly owned by the federal states. These include Wien Energie, EVN, Burgenland Energie, Energie Steiermark, Energie AG Oberösterreich, Salzburg AG, KELAG Kärnten, TIWAG (Tyrol), and illwerke vkw (Vorarlberg). These regional suppliers often operate as multi-utility companies, engaging not only in energy supply but also in other areas such as water supply, waste management, transportation, or telecommunications.
A direct comparison of Verbund AG with other Austrian energy suppliers based on key figures is problematic for several structural reasons. The fundamental difference lies in the business model and strategic orientation. Verbund AG covers over 40 percent of Austria's electricity demand and generates 90 percent of its output from hydropower. Additionally, the group owns and operates the supra-regional electricity grid in Austria through APG. Verbund AG is primarily positioned as a major producer and wholesaler. In Austria, Verbund holds only a 7 percent market share in the small customer segment for electricity with its approximately 375,000 customers, while in the large customer segment, it holds around 20 percent. In Germany, Verbund is the leading green electricity provider for resellers and large customers. This clearly shows that Verbund focuses on the wholesale level and not primarily on end-customer supply.
In contrast, regional energy suppliers such as EVN, Wien Energie, or Energie AG Oberösterreich are structured as integrated regional suppliers that specialize in the widespread supply of end customers within their respective federal states. The also stock-exchange-listed EVN AG focuses on energy supply in Lower Austria, providing electricity, gas, and heat to businesses and households. Additionally, it is active in water, waste management, Kabelplus, technical services, and telecommunications. This multi-utility structure makes regional suppliers diversified infrastructure service providers, while Verbund is a specialized energy producer and grid operator.
The magnitudes are also fundamentally different. In 2025, Verbund AG achieved a net revenue of around 8 billion euros, while the largest regional utilities generate revenues between two and four billion euros. These differences in size are reflected in all key figures and make direct comparisons difficult.
Finally, the value-added stages also differ significantly. Verbund AG is active along the entire value chain, from generation to regional transport and wholesale, while regional utility companies are more focused on distribution networks, end-customer sales, and regional services. A comparison of margins, capital intensity, or returns would therefore compare different business models, not relative performance.
Opportunities & risks
From an investor's perspective, Verbund AG presents itself as an ambivalent investment with substantial opportunities within the framework of the energy transition, but also with specific, sometimes significant risks that require a differentiated approach.
The fundamental investment thesis for Verbund is based on its privileged position within the context of the European energy transition. As Europe's largest hydropower producer, Verbund covers around 50 percent of Austria's electricity demand and benefits from the green energy transition, which creates stable growth drivers and stimulates demand for green electricity through regulatory support. Hydropower generation offers a structural competitive advantage, as its variable costs are significantly lower than those of fossil fuel power plants and no CO₂ certificates are required. This creates a robust profit margin, especially during periods of high electricity prices.
A key growth driver is strategic diversification into new renewable energies. The goal of generating around 25 percent of electricity from wind and photovoltaics by 2030 opens up a significant field for growth. This expansion is taking place through in-house development in Austria and Germany, as well as through targeted M&A activities and partnerships in attractive European markets such as Spain and Italy. Geographical diversification reduces concentration risk in the Austrian home market and opens up regions with higher solar and wind yields.
The strategic positioning in the hydrogen sector could prove particularly promising. The Group is driving the production, transport, and use of green hydrogen, addressing the entire value chain, with a focus on „hard-to-abate emissions“ in sectors such as steel, chemicals, and fertilizer production. The company has already initiated several concrete projects, including partnerships with Borealis, voestalpine, and Westfalen, as well as the ambitious H2 Notos Project in Tunisia, which is set to gain access to the European market via the „SoutH2 Corridor.“ These projects position Verbund as an integral partner for the decarbonization of European industry and open up a potentially highly profitable new business area.
Another strategic advantage lies in the grid infrastructure. The wholly-owned subsidiary APG operates the Austrian high-voltage grid and generates regulated earnings that are largely independent of electricity prices. Unlike hydropower, the grid is independent of electricity prices and regulated, thus reacting differently to price and drought risks. This diversification creates a stabilizing earnings component that balances the volatile generation business.
However, substantial opportunities are counterbalanced by significant risks, making Verbund AG's investment profile more complex than that of many comparable energy providers. The most fundamental risk is dependence on water flow. According to Board Member Kollmann 2025 was the fourth driest year since 1926, with water levels 30 percent below the previous year. In 2025, the generation coefficient for run-of-river power plants was 0.79, which was 0.30 below the previous year's value and 0.21 below the long-term average, resulting in a 24.2 percent decrease in hydropower generation. This hydrological volatility is not a temporary phenomenon but is structurally exacerbated by climate change. For a company whose earnings structure is significantly dependent on hydropower, this represents an immediate earnings and planning risk that can only be gradually mitigated through diversification.
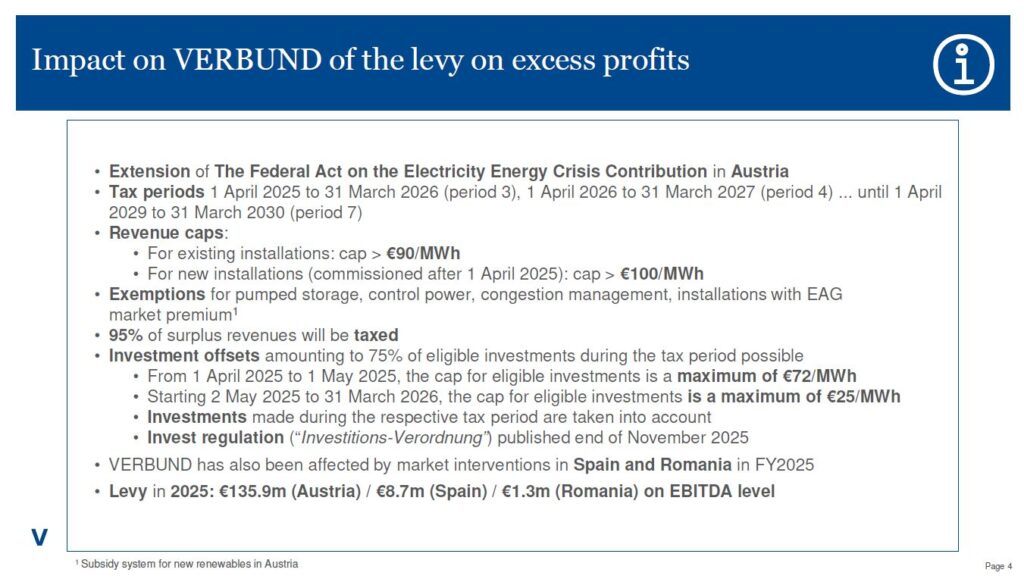
A second significant risk is regulatory intervention in the form of profit levies. The expenses for the Profit confiscation in the reporting period 2025 amounted to a total of 136 million euros and further burdened the result. These politically motivated levies directly reduce the company's profitability and create regulatory uncertainty. Investors must factor in the risk that such measures will be implemented again during future electricity price peaks, which significantly impairs the predictability of cash flows.
A third significant risk arises from legal disputes over pricing. Higher Regional Court of Vienna has legally declared the price change clause of Verbund AG inadmissible, leading to repayment obligations. Approximately 320,000 Verbund AG electricity customers will receive money back, with an average household consuming 3,300 kWh receiving 90 Euros. These judgments not only create direct financial burdens but also reputational risks and uncertainty regarding future pricing possibilities in the end-customer business.
Finally, there are significant execution risks associated with the ambitious investment programs. The planned pumped-storage projects and the expansion of new renewable energies are associated with high capital expenditures and are subject to approval, construction, and time risks. Delays in approval processes, lack of social acceptance and rising construction costs can significantly impact the profitability of these projects.
The finances of Verbund
After an overview of the industry in general, as well as a closer look at the company, management, and competition, I will now turn to the balance sheet and the resulting financial ratios of Verbund AG. The focus here will be on the aspects Growth, profitability and - particularly important for utilities - the Financing.
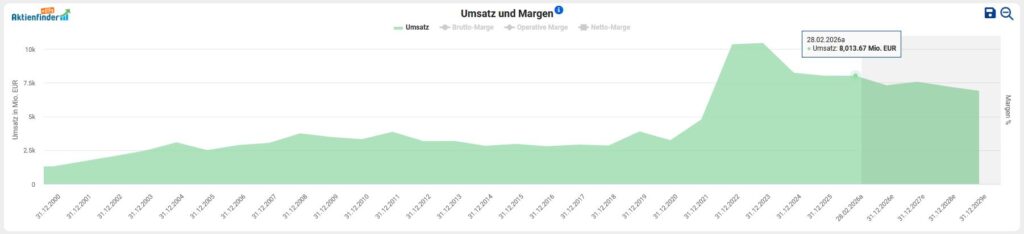
To analyze the financial situation, I first look at the development of revenue, profit, and free cash flow. The top line has grown by an average of 13.2 percent per annum.
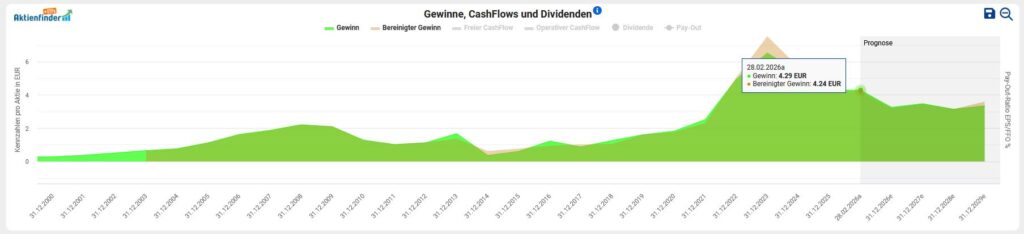
At Earnings per share we have seen a dynamic upward trend for ten years. However, if we look at the past fiscal year 2025, the Adjusted earnings per share 25.5 percent (4.24 vs. 5.69 Euro), due to the significantly reduced hydropower production and the negative effects from the extended profit cap in Austria. In the past fiscal year, Verbund achieved a Net profit from 1.49 billion euros (2024: €1.88 billion).
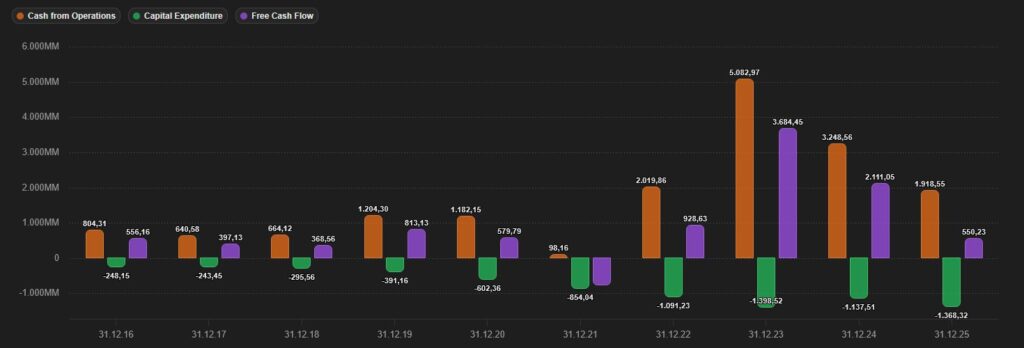
The amount available to the company Free Cashflow can be used for capital investments in organic growth, research and development, debt repayment, expansion through acquisitions, distribution of (increasing) dividends, or share buybacks. In absolute terms, the interplay between operating cash flow and free cash flow, along with the minimal capital expenditures (CapEx), from 2016 to 2025 is as follows. At first glance, this picture looks concerning. However, it should be noted that for capital-intensive business models with high maintenance costs, free cash flow is not a meaningful indicator.
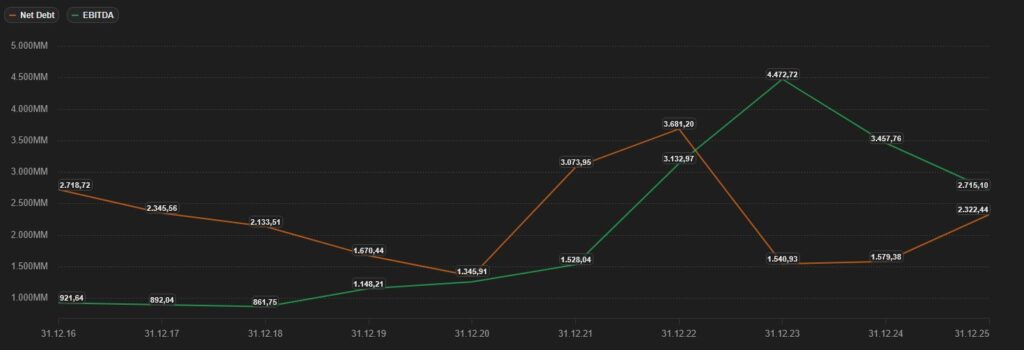
A look at the Debt situation shows that, based on the last fiscal year, Verbund has interest-bearing financial liabilities of EUR 2.56 billion, offset by liquid assets and securities totaling EUR 0.75 billion. If we then divide the remaining net debt of EUR 2.32 billion by the most recently generated EBITDA of EUR 2.72 billion, we get a value of 0.9. This result is significantly below the threshold of 3, which is considered critical. If we consider the relevant for this specific investment case Industry context values in double the standard height (≥6) are not uncommon for the utility sector.
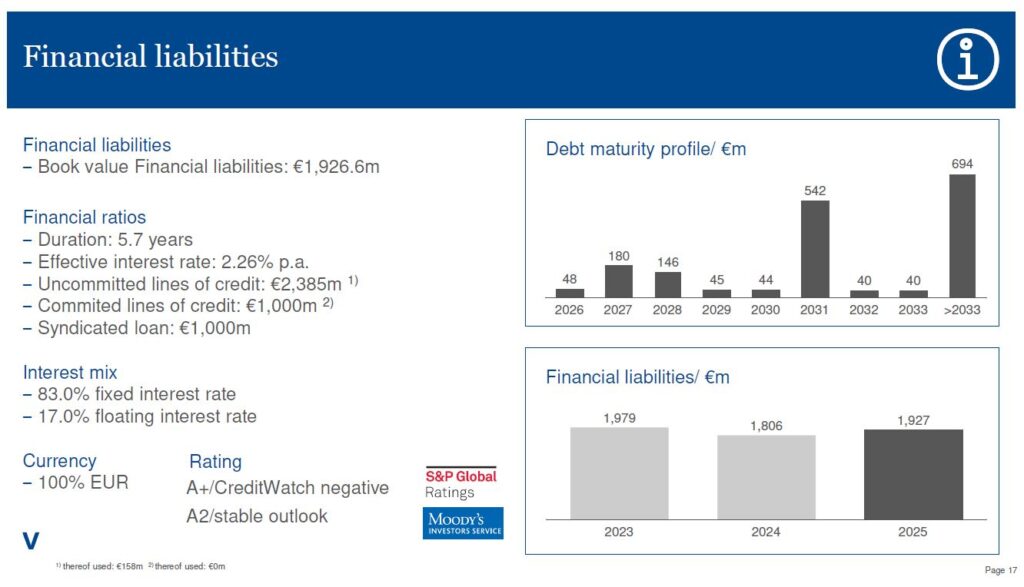
Around the topic Indebtedness and External financing to conclude, I'll take a look at the Interest profile and the Maturity structure the current liabilities. Finally, it is important to assess how vulnerable the company appears to the persistently high – and possibly again rising – key interest rates and to what extent new financing or refinancing of existing debts are due in the near future. Until End of 2030 of the long-term liabilities, only 460 million euros are due. The average interest rate on debt is a low 2.3 percent.
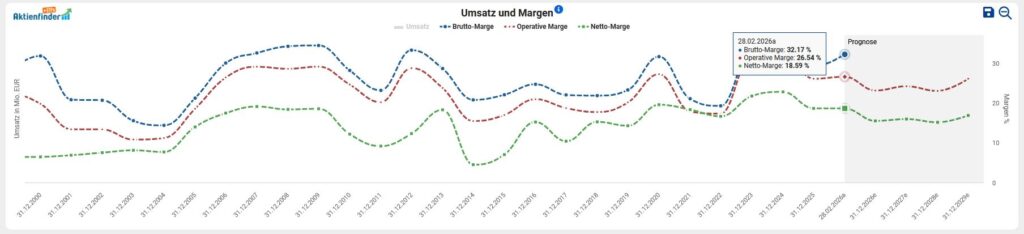
Finally, I am considering Profitability from the Group based on the development of gross, operating, and net margins. The upward trend in recent years follows a volatile pattern, which is directly related to significant fluctuations in electricity prices.
Current valuation of Verbund stock
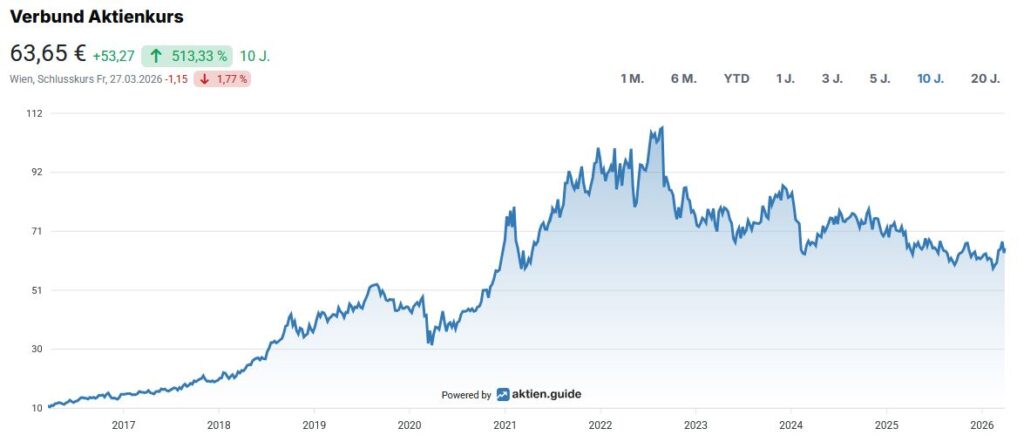
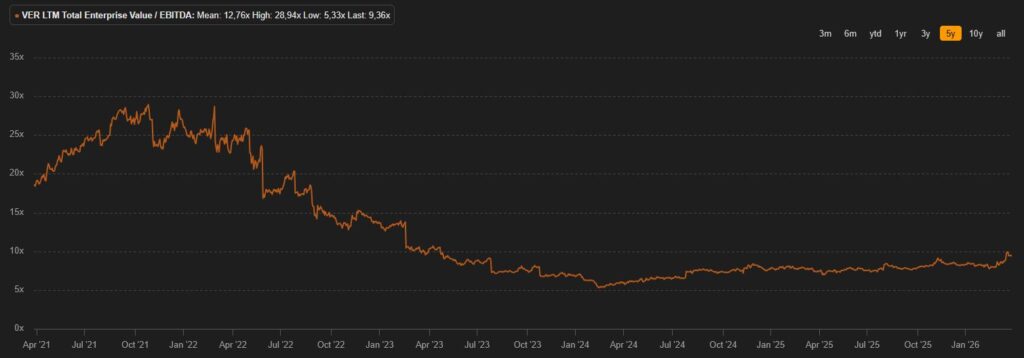
For the valuation of companies, I use the so-called Enterprise Value (EV) is used. In the case of a takeover, the EV indicates the amount required to purchase the assets required for operations and excludes the non-operating assets. I relate this key figure to operating profitability (before taxes, interest and investments (CapEx)), expressed as EBITDA. The prevailing opinion is that a value of less than 10 indicates a „healthy“ valuation - as is always the case with generic Rules of thumb must the company-specific context be considered in the analysis by a diligent investor. In the case of Verbund, we see that a EV/EBITDA of 9.4 represents a decent buying opportunity in the context of the last five years:
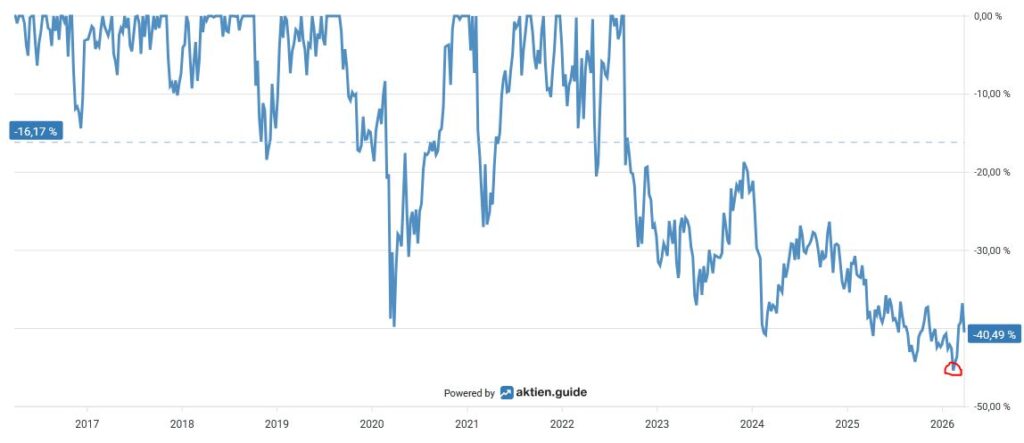
The Maximum decrease in the last ten years amounted to approx. 45 percent at the beginning of this year:
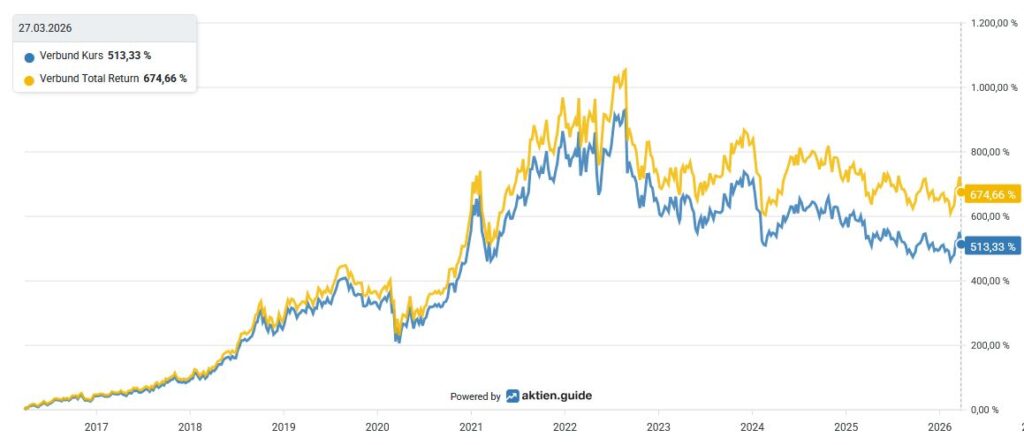
Over the ten-year period, an investment in Verbund stock, measured by Total Return including accrued dividends, a Overall performance from around 675 percent for the investor:
The capital allocation of conglomerates
Despite the massive investment offensive, Verbund is pursuing a shareholder-friendly dividend policy. When considering the Dividendenhistorie it is noted that the group distributes a dividend that fluctuates in line with business success.
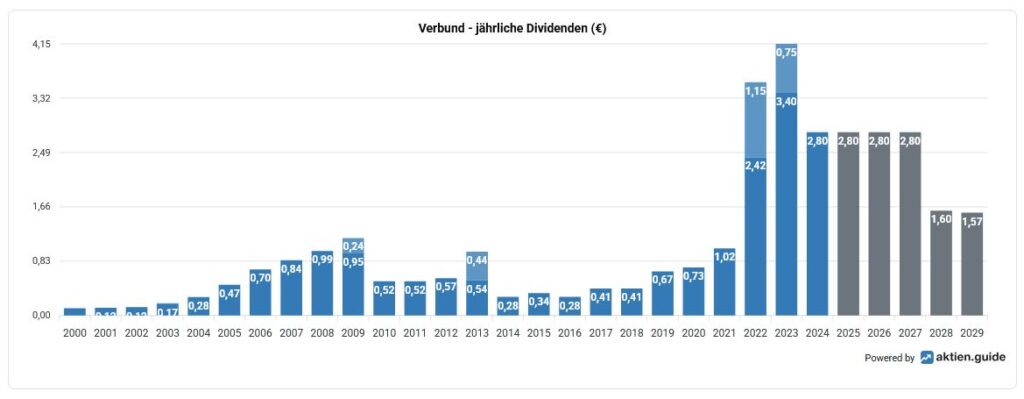
Particularly noteworthy is the recent decision regarding a Special dividend. The majority state-owned electricity company Verbund intends to distribute a special dividend of around 400 million euros. The Management Board will propose to the ordinary general meeting in April to distribute a special dividend of 1.15 euros per share in addition to the regular dividend (2.80 euros per share) for the financial year 2025. This decision is made against the backdrop of political debates and pressure from the state owner regarding the relief of electricity customers.
At a current exchange rate of 66.35 Euros, the calculation results in a Dividend yield from 4.2 percent. Finally, a summary of the last five years of dividend payments:
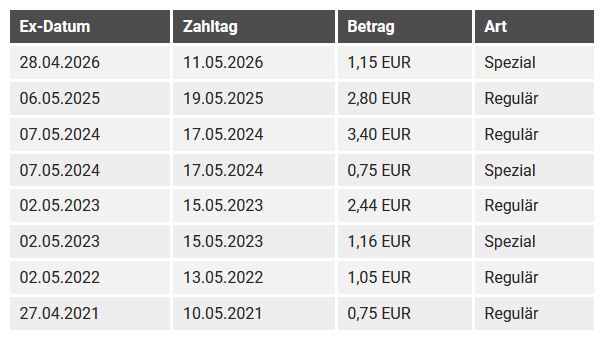
The annual dividend beträgt aktuell 2.80 Euros per share and will be paid out in May. If we use the average free cash flow of the last three years as the basis for determining the payout ratio, we arrive at a result of 100 percent for the Payout ratio. On the profit level, we see a payout ratio of approximately 66 percent. For utility companies, this benchmark is the relevant measure, as, apart from capital investments, the entire cash flow is generally distributed to shareholders.
In the last 15 years, there has been no share buyback program, which is generally not surprising for utilities, especially given the significant public ownership. Current reports and investor relations documents (e.g., 2025 annual results, interim reports) do not mention any ongoing or new programs; the focus is on capital investments within the framework of the corporate strategy described above and dividend distributions.

