



The most important facts in brief
- OMV is the dominant energy group in Central Europe and has a clear competitive advantage in its core market.
- The company is characterized by strong cash flow generation.
- This forms the foundation for a shareholder-friendly distribution policy, which is particularly relevant for income-oriented investors.
- OMV is undergoing a profound strategic transformation from a classic oil and gas producer to an integrated provider of sustainable chemicals, fuels, and energy.
- If you want to read more from Clemens Faustenhammer, then click here DGI model portfolio
Who is OMV?
The first documented crude oil production in Austria took place in the Vienna Basin as early as 1860, at a time when crude oil was only slowly gaining economic importance worldwide. A milestone for the Austrian oil industry followed in the 1930s when one of the largest domestic oil reserves was discovered in Zistersdorf, Lower Austria. This oil field made the Vienna Basin a key region for Austrian oil production.
During World War II, oil production for the German armaments industry was massively expanded, making Austria a significant oil producer. By the end of the war, Austria was the most important oil-producing country in Europe after the Soviet Union and Romania. In 1945, the mineral oil company was incorporated as the „Soviet Mineral Oil Administration“ (SMV) by the Soviet occupation forces, who controlled it until 1955/56. The SMV confiscated Austrian oil operations as „German property abroad“ and effectively used oil production as reparations for war damages suffered. In 1949, the largest contiguous oil field in Europe up to that time was also discovered in Matzen.
This period only ended with the Austrian State Treaty of 1955, which restored Austria's independence. After the State Treaty, SMV was transferred to the Republic of Austria for compensation payments. On July 3, 1956, „Österreichische Mineralölverwaltung Aktiengesellschaft“ (ÖMV AG) was entered into the commercial register, marking the official founding date of today's OMV.
The most important acquired facilities were the Lobau refinery with the associated Zistersdorf-Lobau oil pipeline, as well as the oil fields of Rohöl-Aufsuchungs AG. The company assumed responsibility for the production, processing, and distribution of crude oil and natural gas in Austria. In 1960, the Schwechat refinery southeast of Vienna was put into operation, and in 1968, the first natural gas supply contract with the USSR was concluded. In November 1987, with the privatization of 15 percent of ÖMV, the first stock market listing of a nationalized Austrian company took place. By 2004, the company was majority privately owned, but more details on this will follow in the course of the article.
The systematic expansion began in the 1990s with the establishment of a service station network in Central and Eastern Europe. OMV became the market leader in the region in 2004 by acquiring 51 percent of the Romanian oil and gas company Petrom. Further significant steps included acquiring a 34 percent stake in the Turkish petroleum company Petrol Ofisi in 2006 and various exploration and production activities worldwide. In 1998, OMV contributed its petrochemical division PCD to the Northern European company Borealis, and in 2005, Borealis was fully acquired together with IPIC. OMV currently holds 75 percent of Borealis.
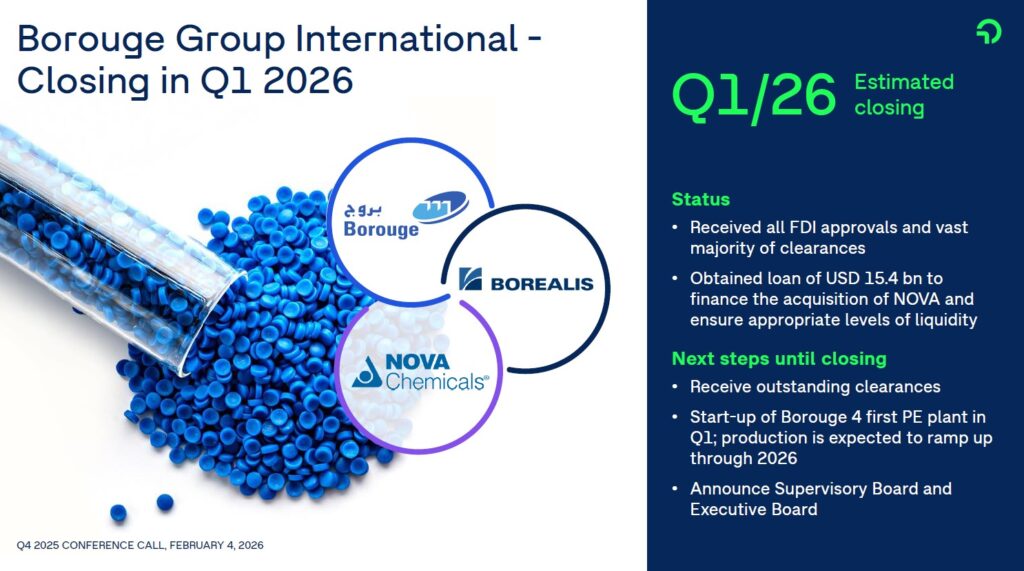
In the March 2025 agreed to merge Borealis and Borouge under a new joint venture company named „Borouge Group International", in which both partners hold 46.94 percent each. This strategic realiAgnment marks a fundamental shift: the chemicals business is increasingly developing into the group's anchor of stability in a volatile energy market. With the merger of Borouge and Borealis and the acquisition of NOVA Chemicals a global polyolefins market leader was created.
In 2026, OMV AG is an integrated Austrian energy, fuel, and chemicals company headquartered in Vienna, strategically transforming towards sustainable energy sources, renewable fuels, and circular economy-based chemical solutions. The company operates in over 30 countries and employs approximately 22,000 people worldwide.
Business Model and Strategy of OMV
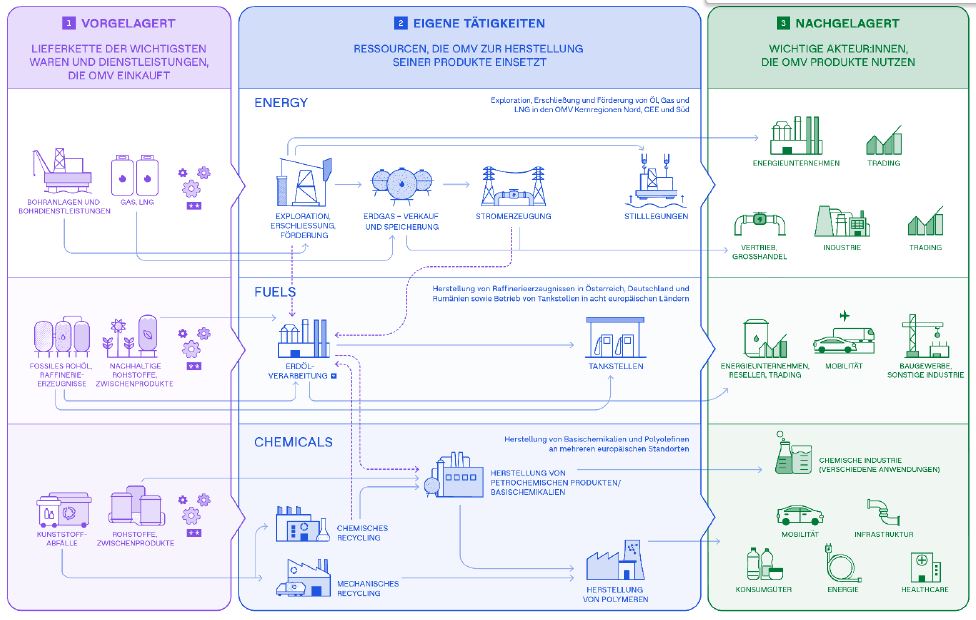
OMV's business model is based on an integrated approach along the entire value chain, from exploration and production to refining and marketing. In line with OMV Strategy 2030, three business areas Established: Chemicals, Fuels, and Energy.
In the business segment Fuels & Feedstock OMV aims to become a leading European provider of sustainable fuels and chemical feedstocks. Production capacity for renewable fuels and chemical feedstocks is to increase to around 1.5 million tons by 2030, while crude oil processing will be reduced by approximately 2.5 million tons. The three European refineries will increase their petrochemical yields to strengthen integration with the growing chemicals business.
In the Chemistry sector OMV is pursuing an ambitious growth strategy. The focus is on polyolefin specialty solutions, with an emphasis on the increased use of renewable raw materials, bioplastics, and the development of circular economy solutions. The global demand for recycled polyolefins is expected to grow approximately three times faster than that for virgin polymers by 2030. Strategically important is the expansion of business in attractive markets such as North America and Asia, as well as the establishment of production in the area of sustainable polyolefins, which is intended to account for up to 40 percent of total European production.
The Strategic alignment The OMV represents a fundamental shift in the company's history. The group plans to evolve into a leading integrated company for sustainable fuels, chemicals, and materials with a strong focus on circular economy solutions, aiming to become climate-neutral by 2050 at the latest. The Chemicals & Materials business area will act as a central growth driver, and it is to be significantly strengthened, expanded, and diversified in its product portfolio.
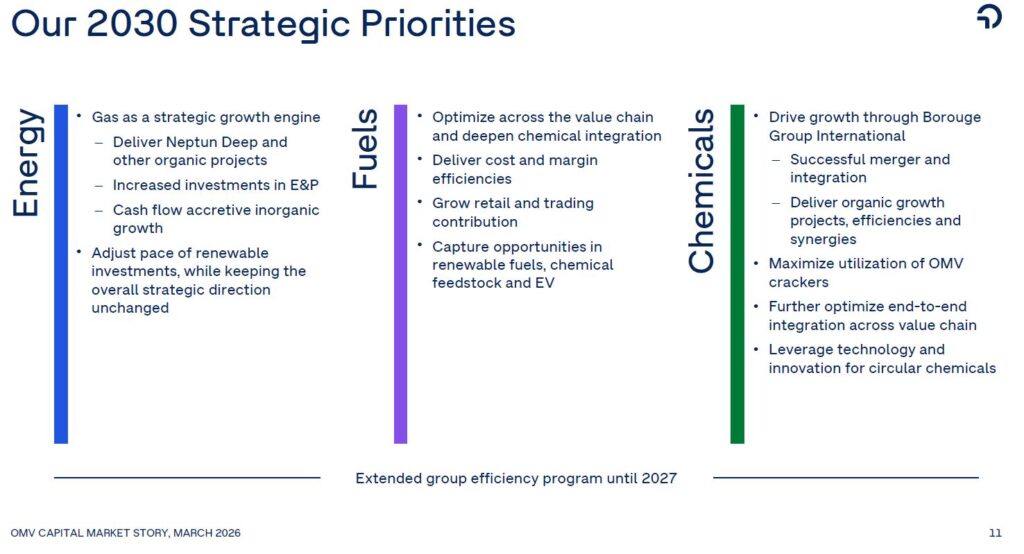
An essential element of the strategy is the targeted transformation of the Energy business. In line with the net-zero target, OMV will reduce its oil and gas production by around 20 percent by 2030 and completely cease oil and gas production for energy use by 2050. At the same time, OMV is positioning natural gas as a bridge technology for the energy transition, aiming to increase the share of gas in production to over 60 percent. In the field of renewable energies, OMV aims for 3 to 4 TWh of renewable energy and approximately 4 TWh of geothermal energy by 2030 through projects across Europe. Furthermore, a CO2 capture and storage capacity of 3 million tons per year is to be achieved.
Owners and Management of OMV
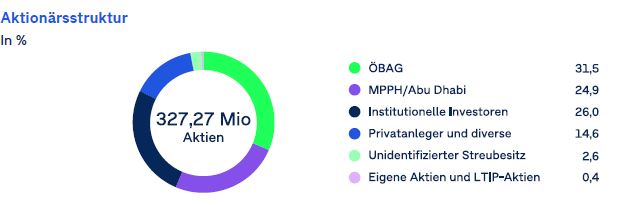
The OMV shows a special ownership structure that unites both state and international strategic interests. 31.5 percent of the shares are held by ÖBAG (Österreichische Beteiligungs AG), the Austrian state holding company which manages the holdings of the Republic of Austria. This makes the state of Austria the largest individual shareholder and secures a strong position in the strategically important energy sector. The Abu Dhabi National Oil Company (ADNOC) holds 24.9 percent of the shares in OMV, making it the second-largest shareholder. This stake was acquired in February 2024 when ADNOC took over the stake from Mubadala Petroleum and Petrochemicals Holding Company. The remaining 43.4 percent are in free float, comprising both institutional investors and private investors.
A special significance is attributed to the syndicate agreement between ÖBAG and ADNOC, which provides for joint conduct and certain transfer restrictions regarding the shares held. This agreement ensures that the two main shareholders act in a coordinated manner on strategic decisions.
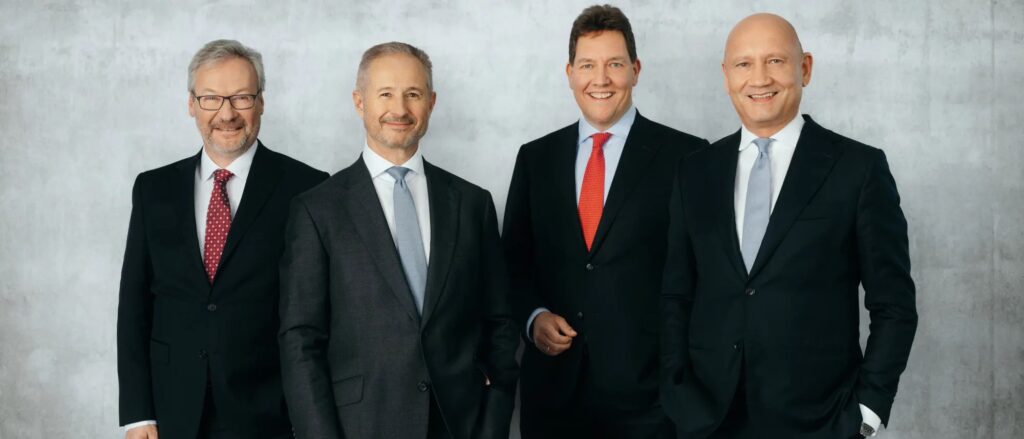
Alfred Stern has been at the helm of management as Chairman of the Executive Board and CEO since September 2021. Under his leadership, OMV initiated the largest transformation in the company's history, achieved key milestones such as the establishment of Borouge Group International with ADNOC, and ended business relations with Russia. Alfred Stern will leave OMV at the end of August 2026. His Successor should Emma Delaney The native Irishwoman is considered an acclaimed energy expert and can look back on many years of experience in top management at BP. In her current role as Executive Vice President of one of BP's three global business divisions, she leads an organization with over 50,000 employees in approximately 50 countries and is responsible for areas including fuels and biofuels, industrial and automotive lubricants production, as well as aviation fuels and e-mobility.
Industry profile and competitive situation
The European oil and gas corporate sector is characterized by an integrated value chain, ranging from exploration and production (upstream) through refining (downstream) to petrochemicals and distribution. This integration allows companies to diversify risks across different business segments. At the same time, it makes companies quite complex entities, whose transformation entails significant strategic and operational challenges. On the list of the top 20 global oil and gas corporations are the European fossil giants Shell, BP, Eni, Equinor, and TotalEnergies.
A comparison of OMV with other European energy companies based on key figures is useful for several reasons, as these companies operate in the same industry with similar business models. Shell, BP, TotalEnergies, Eni, Equinor, and Repsol form the central peer group for OMV, as they all face the same structural challenges: volatile commodity prices, geopolitical risks, transformation pressure, and the need to generate returns in the short term while building sustainable business models in the long term.
The comparison is particularly relevant in the context of transformation: while OMV, with its Strategy 2030, is heavily investing in the chemicals business as a growth driver and has declared the management of Borealis/Borouge as a central pillar, other corporations are pursuing different paths. TotalEnergies is focusing more on renewable energies, while BP and partly Shell are returning to fossil fuels. The aforementioned companies are reacting differently to similar challenges. The comparison shows how resilient business models are to external shocks such as fluctuations in oil and gas prices, shifts in energy demand, and the growing importance of LNG and petrochemicals, and which diversification strategies are most effective in cushioning volatility. OMV, with its strong emphasis on the chemicals business, is structurally different from competitors like BP or Shell, which remain more rooted in the traditional oil and gas business.
For a meaningful peer analysis of OMV, European energy companies that are comparable in terms of size, business model, and strategic orientation are relevant. The selection of the most suitable comparison companies should consider several criteria: market capitalization, integration along the value chain, geographic presence, and the importance of the chemical business. Therefore, I decided to consider the Italian company Eni and its French counterpart, TotalEnergies, for the competitive comparison.
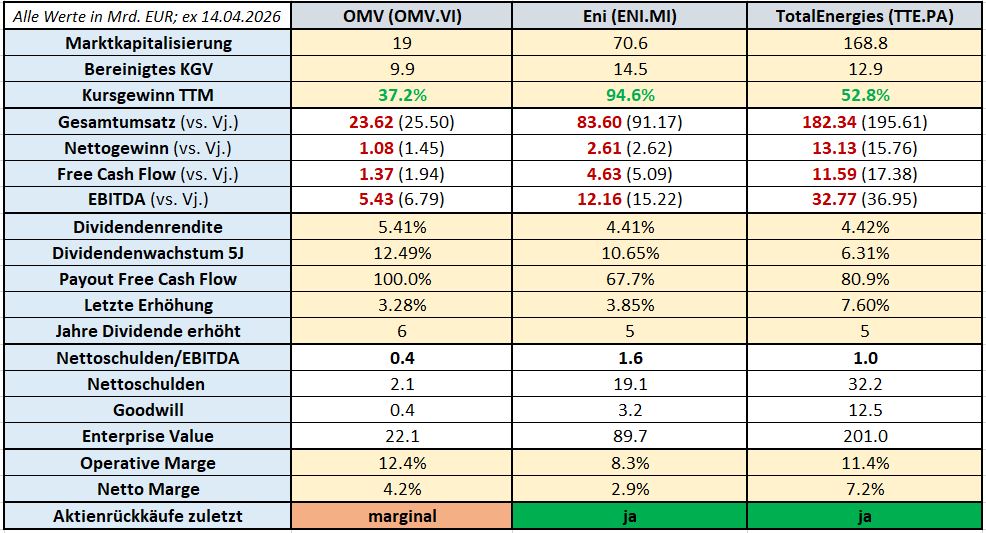
Notes on the values contained in the table:
- Green or red color coding of figures indicates a year-over-year increase or decrease.
- All values are stated in euros
Opportunities & risks
OMV is exposed to a wide range of risks as an integrated energy and chemicals company, but at the same time, it has significant opportunities arising from its strategic transformation. The Chemicals & Materials business segment is being prioritized as the company's growth driver and is intended to be significantly strengthened, expanded, and diversified with the goal of achieving a leading global position in circular economy solutions. Strategic guidelines include expanding the business in North America and Asia, as well as building production in the area of sustainable polyolefins, which is expected to account for up to 40 percent of total European production.
The combination of Borealis and Borouge under the new Borouge Group International opens up new growth markets and brings together innovative technologies under one roof. The acquisition of Nova Chemicals further strengthens the presence in the Americas and expands the position in cost-effective raw materials. This transaction creates one of the world's leading polyolefin producers and generates significant economies of scale.
Additionally, OMV aims to supply around 2 million tons of sustainable products in Chemicals & Materials by 2030, with 80 percent of these volumes to be produced in Europe. The proprietary ReOil technology for chemical recycling offers significant potential. This technological leadership positions OMV advantageously in the growing market for circular solutions. The production capacity for renewable fuels and chemical feedstocks is expected to increase to around 1.5 million tons by 2030. Refineries are to increase their petrochemical yield from the current 17 percent to around 25 percent, which strengthens integration with the growing chemicals business and enables higher-value products.
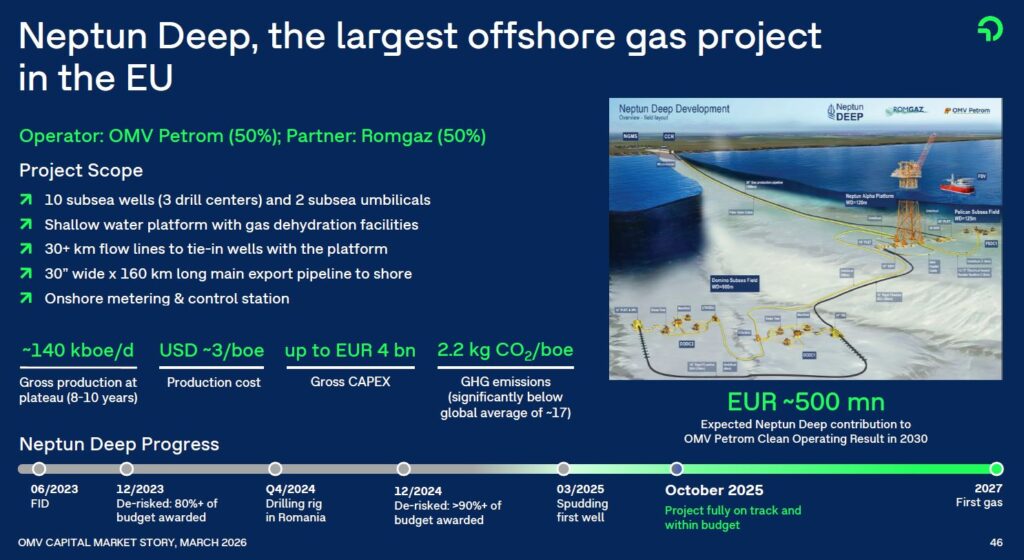
Gas plays a central role as a bridging technology for the energy transition, with the share of gas in production set to rise to over 60 percent. The Neptun Deep project in the Romanian part of the Black Sea represents a significant growth opportunity and strengthens European energy supply. The successful diversification of gas sources away from Russia towards domestic production in Norway, **external** gas producers, and LNG deliveries reduces dependencies and increases security of supply.
As an oil, gas, and chemical company, OMV is significantly exposed to the price fluctuations of the corresponding raw materials. The volatility of commodity prices, exchange rates, and interest rates represents a substantial financial risk. Additionally, credit risks arise from the potential inability of counterparties to meet payment or delivery obligations. Current developments clearly demonstrate this volatility: while the chemical business saw strong growth in 2024, results in the energy segment declined due to lower gas and oil prices.
The company is preparing for an increasingly unstable geopolitical environment. A specific example was the long-standing dependence on Russian gas. In November 2024, OMV announced the termination of its long-term natural gas supply contract with Gazprom Export due to several fundamental breaches of contract by the Russian company, meaning OMV has no supply contracts and no business activities in Russia. This termination significantly reduces the potential risk profile, with supply volumes already having been fully diversified through alternative gas sources in the last three years.
The transformation to a climate-neutral company by 2050 entails considerable investment requirements and regulatory uncertainties. Stricter climate protection requirements, CO2 pricing and stricter environmental regulations could have a significant impact on the profitability of the traditional business. The company must invest around EUR 5 billion in the development of low-carbon business areas, while at the same time reducing oil and gas production by 20 percent by 2030. The fundamental strategic shift from a linear to a circular business model harbors inherent implementation risks. The planned reduction in oil and gas production combined with a massive expansion of the chemicals business requires considerable investment and technological innovation. The dependence on the success of new technologies such as the ReOil recycling technology and the development of sustainable business models in areas with still uncertain market conditions represent significant risks.
The finances of OMV
After gaining an overview of the industry in general and taking a closer look at the company, management, and competition, I will turn my attention to OMV's balance sheet and the resulting financial ratios. The focus here will be on the aspects Growth, profitability and - particularly important for utilities - the Financing.
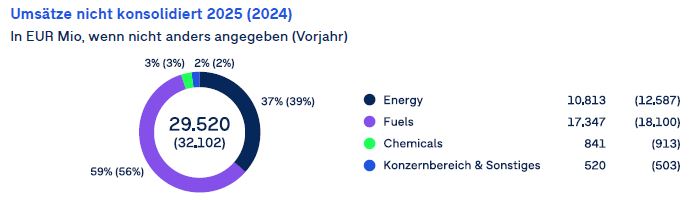
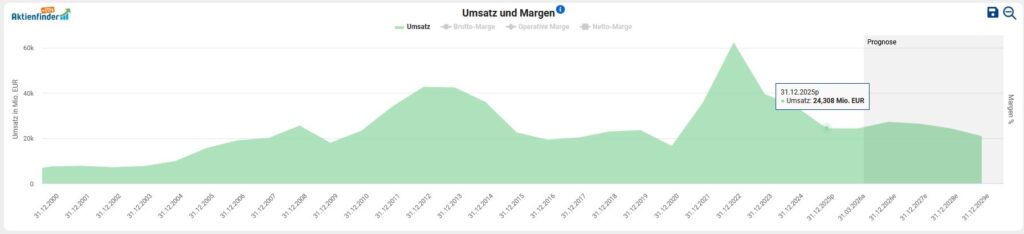
To analyze the financial situation, I first look at the development of revenue, profit, and free cash flow. On average, the top line has stagnated over the past five years.
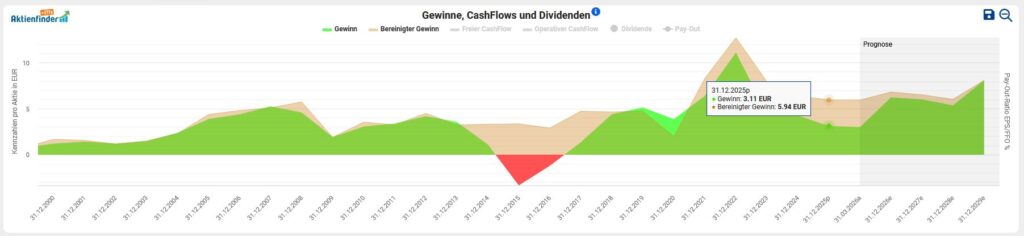
At Earnings per share for five years, we've seen very dynamic upward development. However, if we consider the past fiscal year 2025, this declined Adjusted earnings per share at 7 percent (5.94 vs. 6.39 Euros). OMV achieved in the past fiscal year a Net profit from 1.08 billion Euros (2024: 1.45 billion euros).
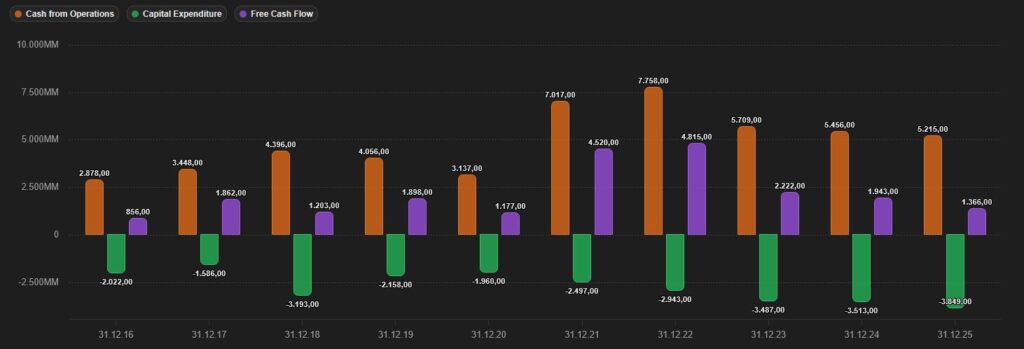
The amount available to the company Free Cashflow can be used for capital investments in organic growth, research and development, debt repayment, expansion through acquisitions, distributions of (increasing) dividends, or share buybacks. In absolute terms, the interplay of operating, free cash flow, and minimal capital expenditures (CapEx) from 2016 to 2025 is as follows. At first glance, this picture appears concerning.
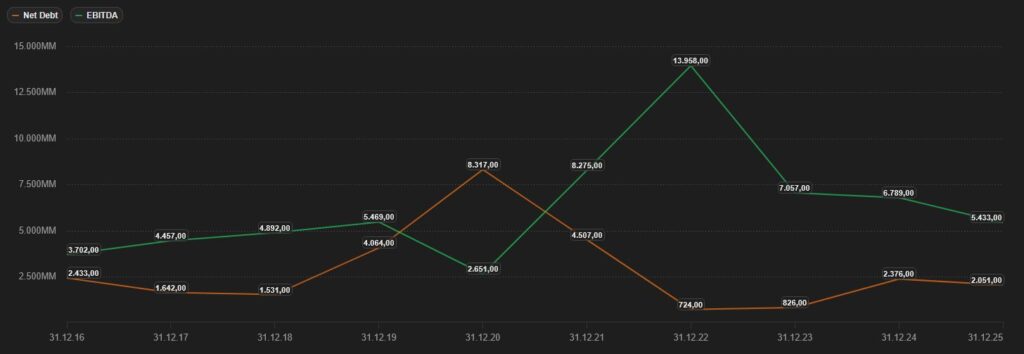
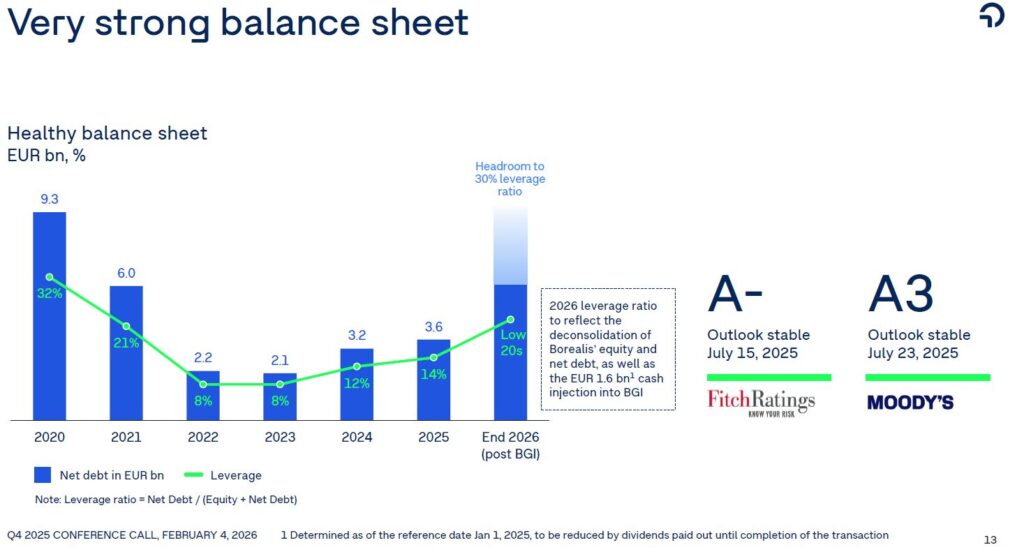
A look at the Debt situation shows that, based on the last fiscal year, OMV has interest-bearing financial liabilities of €8 billion, offset by cash and securities totaling €5.95 billion. If we now divide the remaining net debt of €2.05 billion by the last reported EBITDA of €5.43 billion, we get a figure of 0.4. This result is well below the threshold of 3, which is considered critical. Considering this low level of debt, I will refrain from a more in-depth examination of the maturity structure of the long-term liabilities and their interest terms.
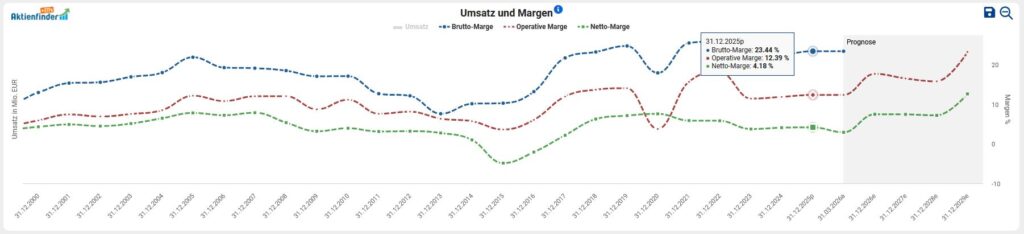
Finally, I am considering Profitability OMV's performance based on the development of gross, operating, and net margins. The upward trend in recent years follows a volatile pattern, consistent with the cyclical business model and fluctuating higher or lower depending on price levels in the commodity markets.
Current valuation of OMV stock
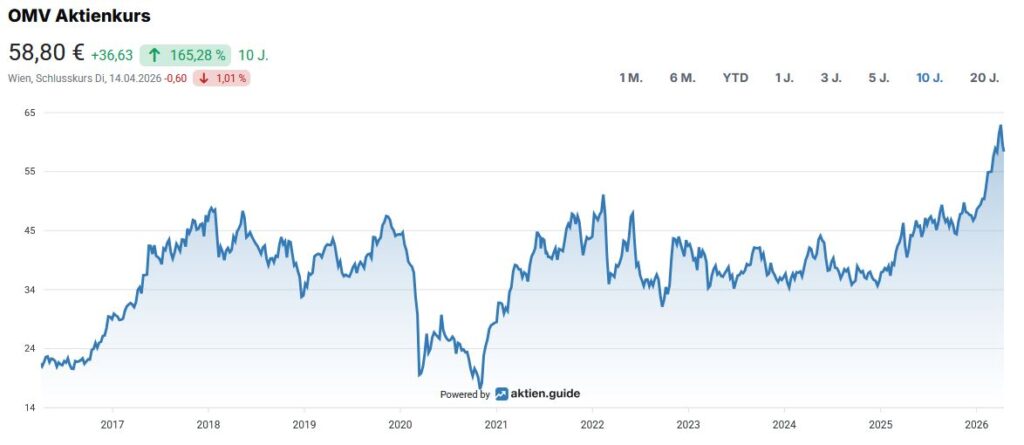
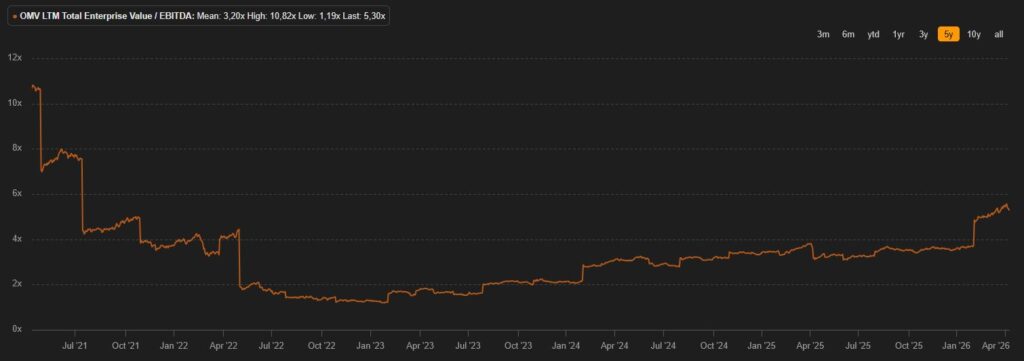
For the valuation of companies, I use the so-called Enterprise Value (EV) is used. In the case of a takeover, the EV indicates the amount required to purchase the assets required for operations and excludes the non-operating assets. I relate this key figure to operating profitability (before taxes, interest and investments (CapEx)), expressed as EBITDA. The prevailing opinion is that a value of less than 10 indicates a „healthy“ valuation - as is always the case with generic Rules of thumb must the company-specific context be considered in the analysis by the careful investor. In the case of OMV, we see that a EV/EBITDA of 5.3 represents a decent buying opportunity in the context of the last five years, even though the OMV share was available at a lower price in recent months:
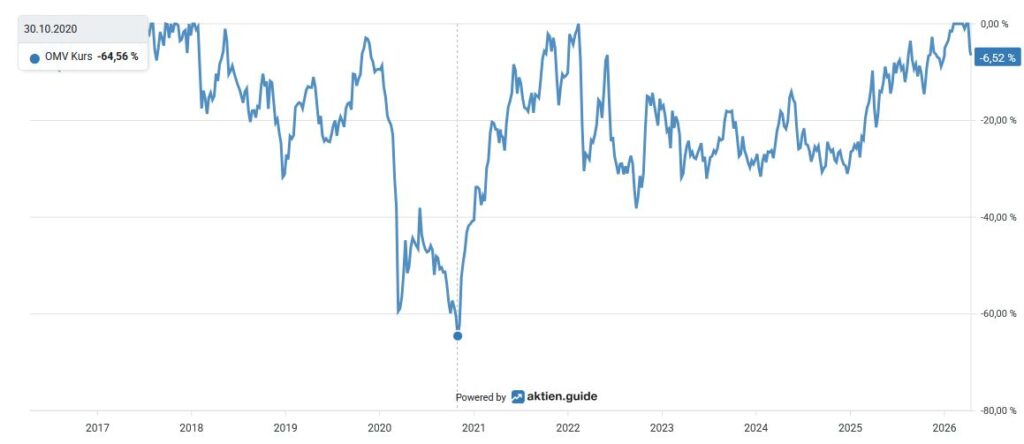
The Maximum decrease in the last ten years amounted to approx. 65 percent in the year 2020:
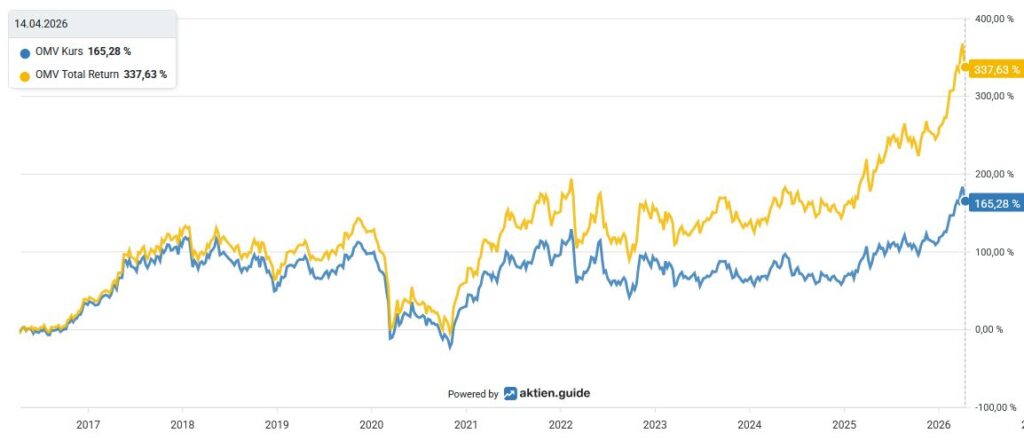
In the ten-year period, an investment in OMV stock, measured by Total Return including accrued dividends, a Overall performance from around 338 percent for the investor:
OMV's Capital Allocation
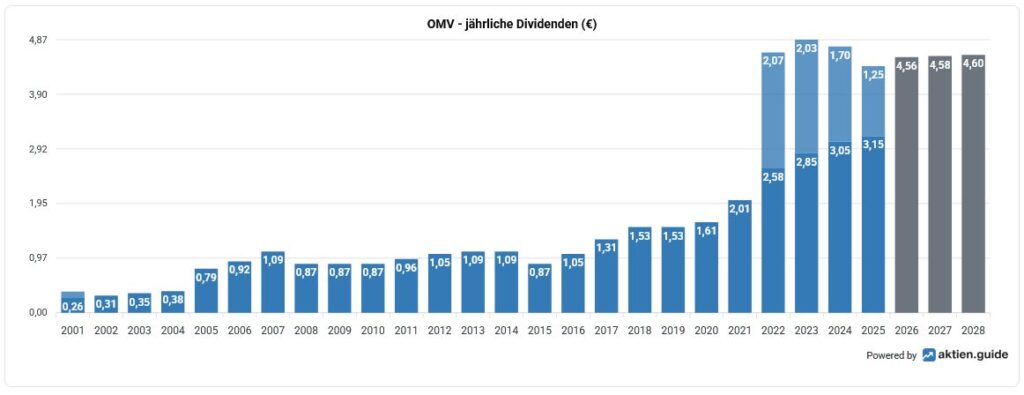
Despite the massive investment offensive, OMV is pursuing a shareholder-friendly dividend policy. When considering the Dividendenhistorie is striking that the OMV has a fluctuating [performance/result] corresponding to business success Special dividend pours out.
Looking at capital allocation, OMV aims for an operating result before special items of at least EUR 6 billion and an operating cash flow of at least EUR 7 billion by 2030. The new dividend policy reflects the strategic reorientation: from 2026 onwards, 50 percent of Borealis dividends and 20 to 30 percent of the Group's operating cash flow will be distributed to shareholders, making the chemicals business the central driver of the distribution policy.
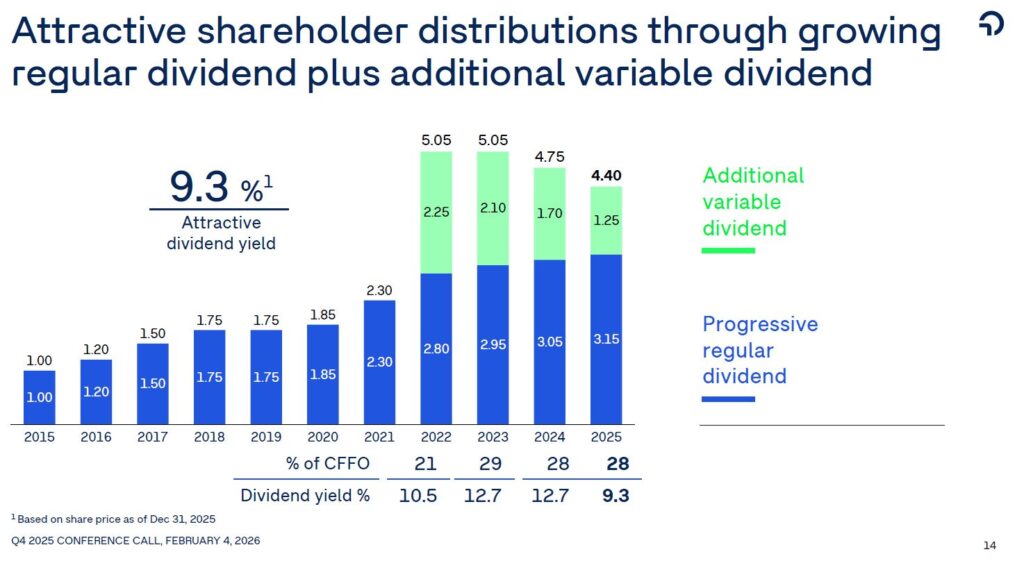
At a current price of 58.80 Euros, this results in a Dividend yield from 5.4 percent based on the regular dividend. Finally, an overview of the dividend payouts for the last five years:
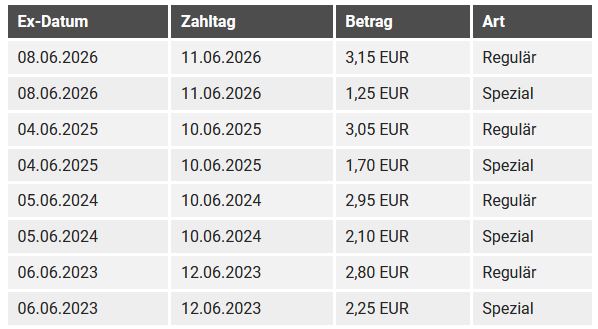
The annual dividend beträgt aktuell 3.15 Euro per share and will be paid out in June. If we take the average free cash flow from the last three years as the basis for calculating the payout ratio, we arrive at a result of 95 percent for Payout ratio, which is particularly due to the special dividends.
In recent years, there has been no share buyback program, which is hardly surprising given the high public stake. The current annual report does not mention a new program. The focus is on capital investments within the scope of the corporate strategy described above and dividend distributions.

