The most important in a nutshell
- Visa is the clear market leader in the Visa-Mastercard duopoly, which controls approximately 85 to 90 percent of the global credit card market outside of China. This dominant market position grants it significant pricing power.
- Thanks to its capital-light business model with exceptional profitability, Visa achieves a net profit margin of over 50 percent and an ROIC of over 30 to 40 percent – a level that few companies worldwide can reach.
- Global diversification across mature, growing, and frontier markets, as well as expansion into value-added services, create enormous organic growth potential driven by the megatrend of cashless payments.
- Visa places a high value on shareholder returns. The company generates enormous free cash flows annually and has an AA– rating. In the last ten years, the number of shares has been reduced by 20 percent, and the dividend has quintupled, having been continuously increased for 18 years.
- Click here for the DGI model portfolio and here to the overview of this series The dividend custody account
Company Profile and Business Model: Who is Visa and What Does Visa Do
Visa's roots trace back to 1958 when Bank of America launched the first large-scale credit card program in the United States with the "BankAmericard" in Fresno, California, mailing out 65,000 cards with a $300 credit limit. Despite significant initial difficulties – the delinquency rate alone stood at 22 percent instead of the expected 4 percent – the concept quickly established itself. As early as 1966, Bank of America licensed its system to other institutions, leading competing banks to form the Interbank Card Association, the predecessor to Mastercard. In 1970, the program was spun off into National BankAmericard Inc. (NBI), whose CEO Dee Hock drove the transformation towards a cooperative network of independent banks. The move into international business followed in 1974 with IBANCO, before the strategically decisive rebranding to "Visa" in 1976 – a name that was easy to pronounce in all languages and underscored the company's global ambition.
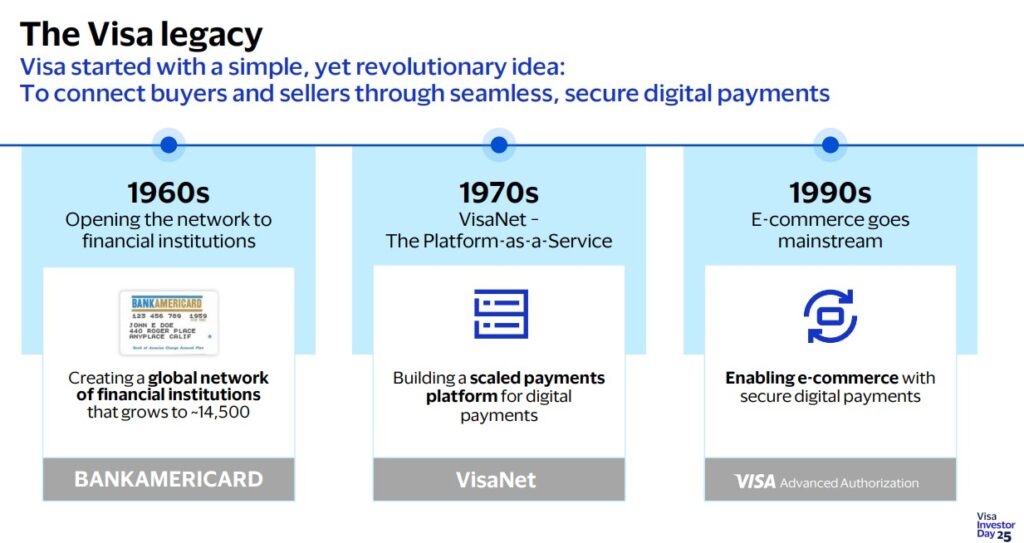
In the 1980s and 1990s, Visa expanded globally, built one of the world's largest payment infrastructures with VisaNet, introduced debit cards as its second product category, and established itself as a global brand through sports sponsorships, such as its partnership with the Olympics. In March 2008, the company finally undertook what was then the largest IPO in US history, raising approximately $17.9 billion on a valuation of about $44 billion. With the acquisition of Visa Europe in 2016 for around 21.2 billion euros, the previously separate European organization was fully integrated. In the following years, Visa consistently evolved from a pure credit card provider to a comprehensive payment technology platform, integrating mobile wallets like Apple Pay and Google Pay, focusing on tokenization and fintech partnerships, and today processes transactions in over 200 countries with annual payment volumes in the double-digit trillions.
At its core, Visa operates a global four-party payment network that functions as a technology platform: VisaNet forms the technical backbone through which issuing and acquiring banks process card payments, as well as clearing and settlement. Visa itself acts merely as an intermediary, meaning it neither issues its own cards nor assumes direct credit risk.
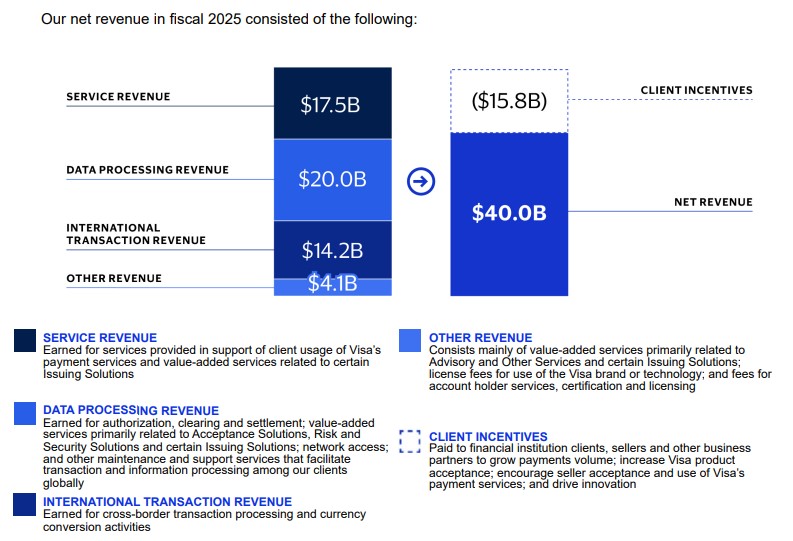
Although Visa formally only reports one segment, the company nevertheless provides detailed breakdowns of four central revenue streams for better transparency for investors:
- Data Processing Revenues (Revenue share: 35.8 percent)In the largest area, revenue is generated through the actual processing of transactions – Visa receives fees for every transaction authorized, cleared, and settled through the VisaNet network. The average daily transaction count reached over 700 million last year.
- Service Revenues (Revenue share: 31.2 percentThese revenues are based on the issued credit volume and are typically calculated as a percentage of that volume. Issuing banks pay Visa fees based on the total volume of transactions their cardholders make with Visa cards. This revenue stream is less transaction-dependent and more driven by the overall volume of card spending.
- International Transaction Revenues (Revenue share: 25.5 percentThis concerns transactions that cross borders, either when a cardholder shops abroad or when an online transaction is processed internationally. Visa charges fees for currency conversion and international processing. The segment benefits disproportionately from the recovery of international travel after the COVID-19 pandemic and the growth of e-commerce.
- Other Revenues (Revenue share: 7.3 percent): The smallest, but fastest-growing revenue stream. This segment mainly includes Value-Added Services (VAS). VAS includes services such as fraud prevention, risk management, tokenization, advisory services, issuing solutions (including PISMO for core banking infrastructure), and acceptance solutions. This business segment is strategically particularly important as it offers higher margins and strengthens Visa's differentiation from competitors. In the fourth quarter of 2025 alone, VAS grew by 25 percent.
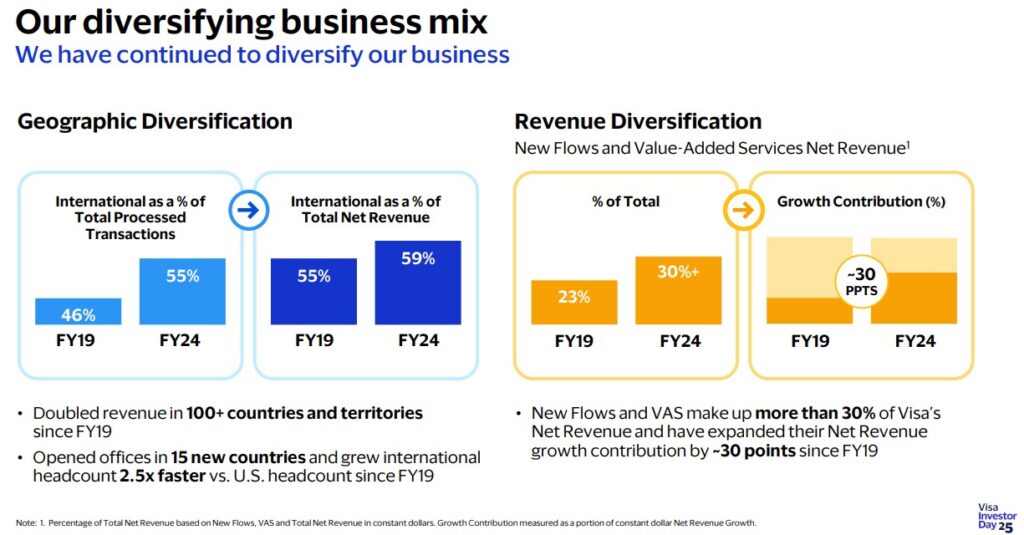
In the geographic distribution of Visa's revenue, the relative loss – despite increasing revenues in absolute terms – of USA-Segments into perspective. Currently, the lion's share is generated in the United States with 39 percent, while the international business contributes the remaining 59 percent. According to the company, no other country contributes more than ten percent to revenue share besides the USA. Visa offers its services in over 200 different countries here and processes payments in over 160 currencies.

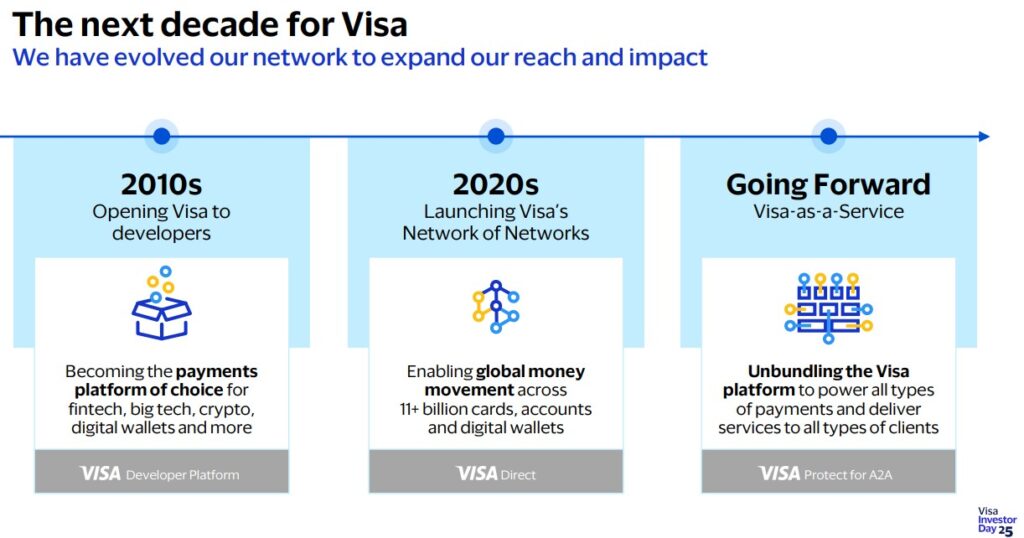
Based on the presentations and statements at the Visa Investor Day in February 2025 Corporate strategy as a conscious diversification and transformation from a pure card network to a comprehensive payment infrastructure platform, which CEO Ryan McInerney characterizes as an "infinite growth runway.".
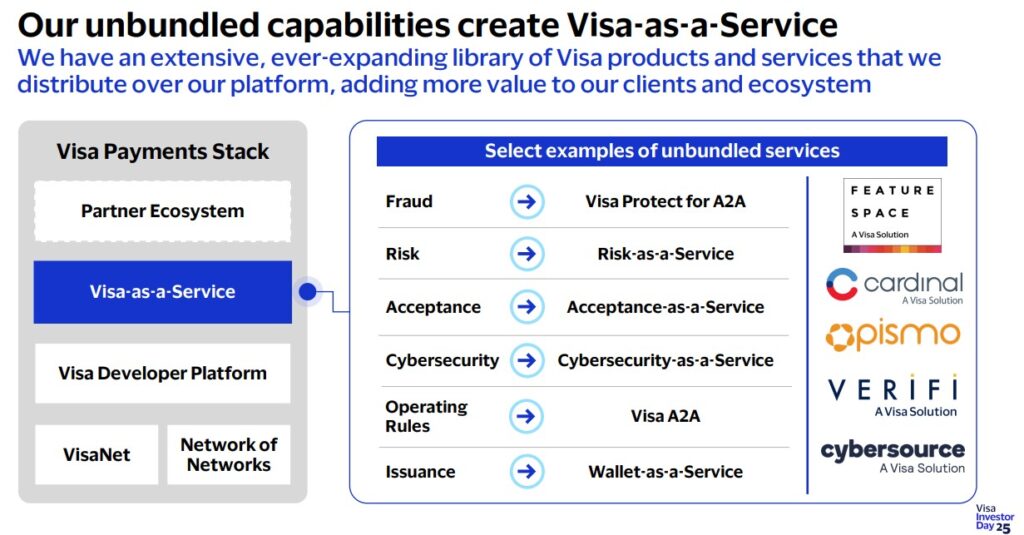
The central strategic vision is the development of "Visa-as-a-Service"– a de-bundling of the technological infrastructure, allowing a much broader spectrum of customers to leverage Visa components for their own payment solutions. This opening of the network began in 2016 with the Visa Developer Platform and has evolved into the "Network of Networks" strategy, enabling interoperability with other payment systems. Visa is thus no longer positioning itself solely as a card network, but as a global payment infrastructure that supports card-based and cardless payments, account-to-account transactions, real-time payments, and even stablecoin settlements.
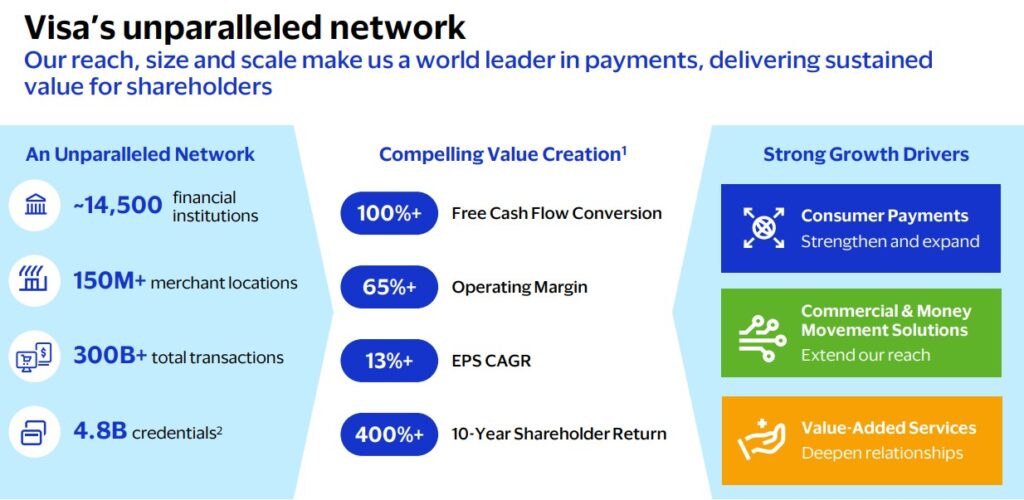
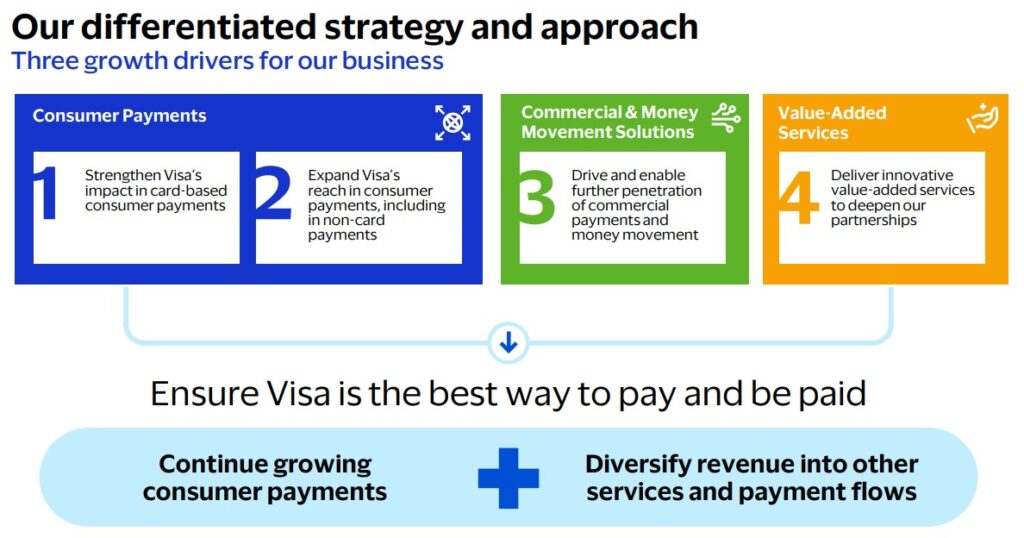
The growth strategy rests on four pillars: First, Consumer Payments, with an addressable market of $41 trillion annually, of which $23 trillion is still settled in cash, checks, or local systems. Second, Commercial & Money Movement Solutions, which expanded between 2021 and 2024 with an average annual growth rate of 22 percent and address a market of over $200 trillion – Visa Direct alone grew from 1.6 billion transactions in 2019 to nearly 10 billion in 2024. Third, Value-Added Services, with a growth rate of 20 percent per year since 2021 and an addressable revenue potential of $520 billion annually, further strengthened by the acquisition of PISMO in 2023. Fourth, geographic expansion into dynamic growth markets such as Asia-Pacific (12.4 percent CAGR), Eastern Europe (11.9 percent), and Latin America (15 percent), which are growing significantly faster than the established markets of the USA and Western Europe.
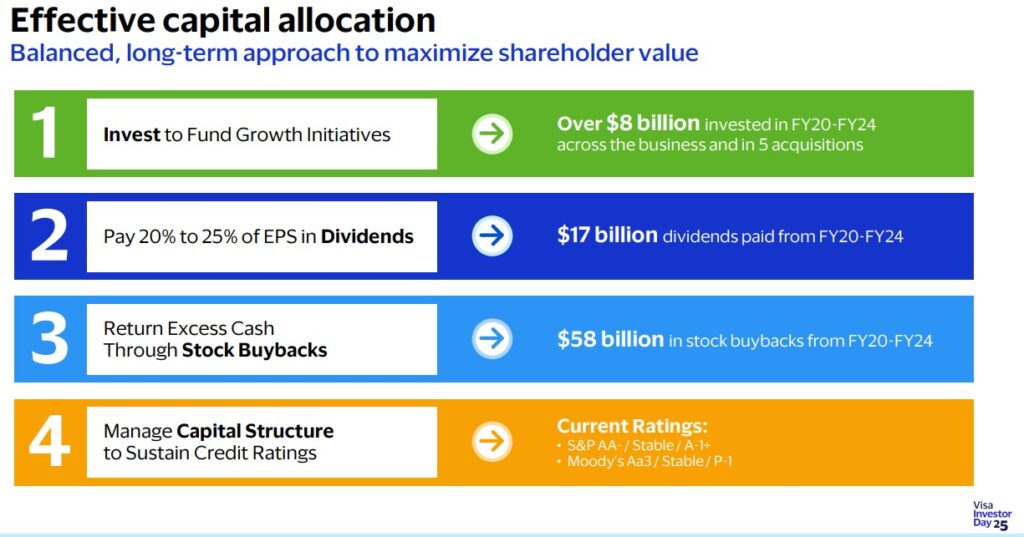
The strategy is rounded off by an exceptionally shareholder-friendly capital allocation: thanks to the capital-light model, almost all free cash flow is returned to shareholders.
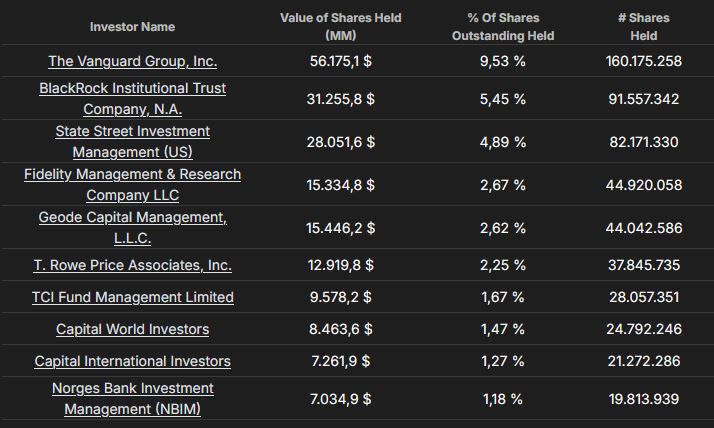
On the owner side, institutional investors clearly dominate: Around 80 percent of the shares are held by funds and other institutions, with firms like BlackRock, Vanguard, Capital Group, Fidelity, and State Street among the largest shareholders.
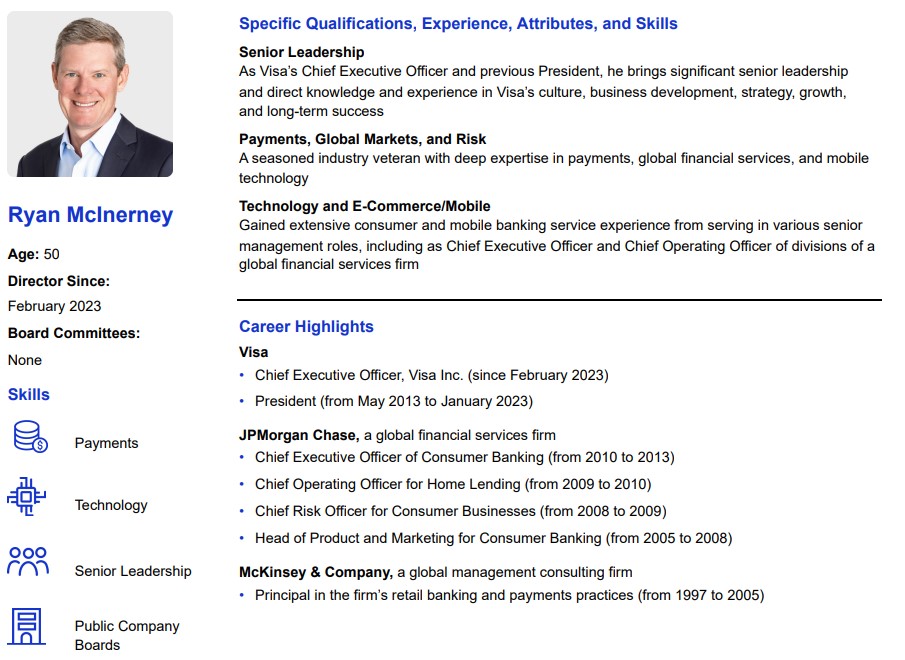
In 2023, Ryan McInerney the role of Chief Executive Officer and member of the Board of Directors of Visa. The 50-year-old executive brings over 20 years of experience in the financial services and payments industry. McInerney completed his academic education at the renowned University of Notre Dame, where he earned a Bachelor of Science in Finance in 1997. He began his professional career as a Principal Consultant at the strategy consulting firm McKinsey & Company. McInerney made a decisive career move by joining JPMorgan Chase, where he was instrumental in the development and launch of the company's first mobile banking product.
In June 2013, McInerney moved to Visa, where he initially served as President, overseeing the company's global business operations. In this nearly ten-year tenure as President, he led all of the company's market teams, business units, product development, merchant relations, and customer services in over 200 countries and territories. Under his leadership, Visa continuously expanded and solidified its position as the leading payment network. As CEO, McInerney pursues a clear innovation strategy: he is driving investments in blockchain technology, central bank digital currencies, and artificial intelligence. The father of three holds nearly 275,000 shares of his employer.
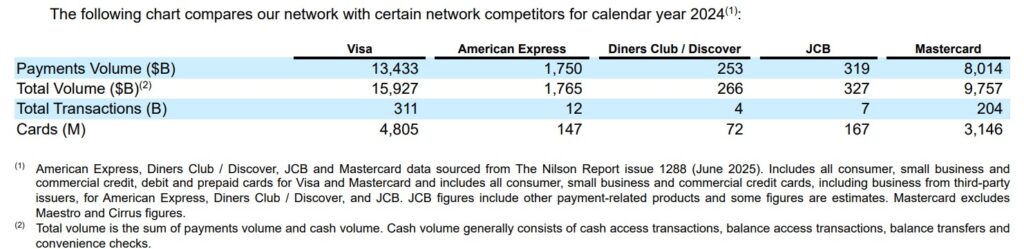
Industry profile and competitive situation
For a peer group analysis of Visa, Mastercard, the second leading player, immediately stands out as a direct comparison. Both companies pursue virtually identical business models – the so-called four-party model or "open-loop system." The fundamental difference to American Express lies in the structure and risk distribution of the business model.
Visa and Mastercard are, in their core function, purely payment network operators that act as platforms between different parties. They do not issue credit cards themselves, but rather license their brand and technology to partner banks (issuers), which then issue the cards to end customers. At the same time, they work with acquiring banks that recruit merchants as acceptance points. Visa and Mastercard earn their money exclusively by providing network infrastructure and charge fees for transaction processing, data processing, and network usage. Crucially, they bear no credit risk. If a cardholder doesn't pay their bill, that's the issuing bank's problem, not Visa's or Mastercard's. This "asset-light" model allows for extremely high margins and stable, predictable cash flows because the business is essentially based on fee income and doesn't depend on the credit quality of the end customers.
American Express, on the other hand, operates a three-party model or "closed-loop system," where the company functions as both the card issuer and the acquirer. American Express issues cards directly to customers, extends them credit, and thus bears the full credit risk. This means AmEx profits not only from transaction fees but also from interest income on outstanding card balances, annual fees, and other charges directly from cardholders. While Visa and Mastercard are B2B companies that work with banks as customers, American Express is a B2C company with a direct customer relationship. This results in a completely different risk and return profile: AmEx is more sensitive to economic cycles, as credit defaults can rise during recessions, but it also has higher yields per transaction due to its direct customer relationships and premium positioning.
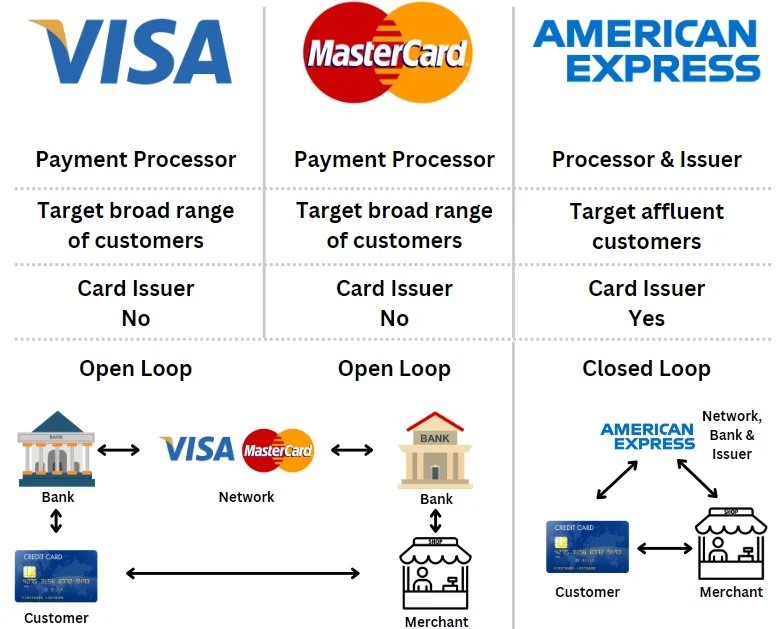
This structural difference is reflected in the financial figures: Visa and Mastercard typically show operating margins of over 60 percent, while American Express achieves significantly lower margins due to lending and customer acquisition costs. Furthermore, the balance sheet structure differs fundamentally: Visa and Mastercard have minimal assets, whereas AmEx carries substantial credit receivables on its balance sheet.
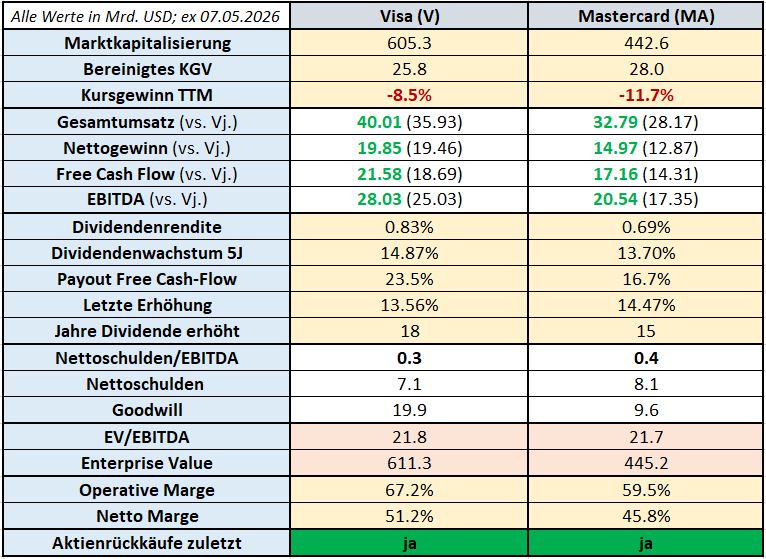
Notes on the values contained in the table:
- Green or red coloring of the numbers indicates growth or a decline compared to the previous year.
- All values are listed in USD
The financial statement of Visa
Having gained an overview of the industry in general and taken a closer look at the company, management, and competition as factors relevant to decision-making, I will now turn my attention to Bilanz and the resulting Finanzkennzahlen by Visa. The focus here is on the aspects Growth, profitability and Financing.
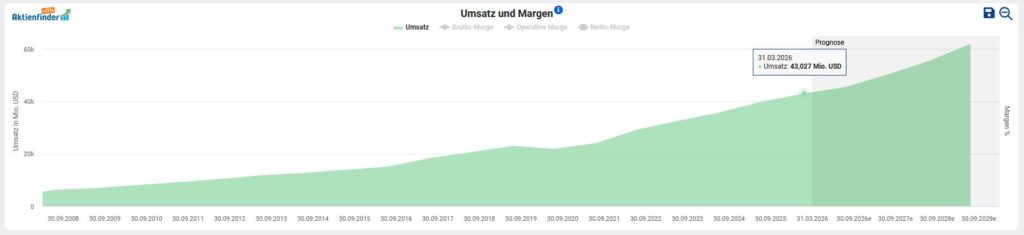
To analyze the financial situation, we will first look at the development of revenue, profit, and free cash flow. I have already discussed the internal distribution of revenue by segment above in the chapter on the business model. On average, the top line has increased in the last five years by 13.6 percent per annum.
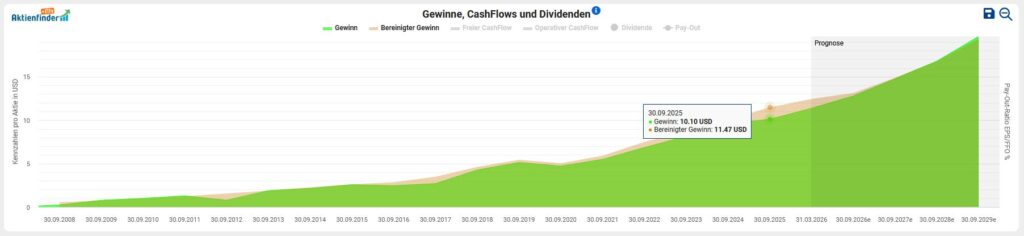
At Earnings per share We have seen an upward trend for ten years. Taking the past fiscal year 2025 as an example, adjusted earnings per share decreased by 14.1 percent ($11.47 vs. $10.05). Visa generated a profit in the past fiscal year Net profit from $19.9 billion.
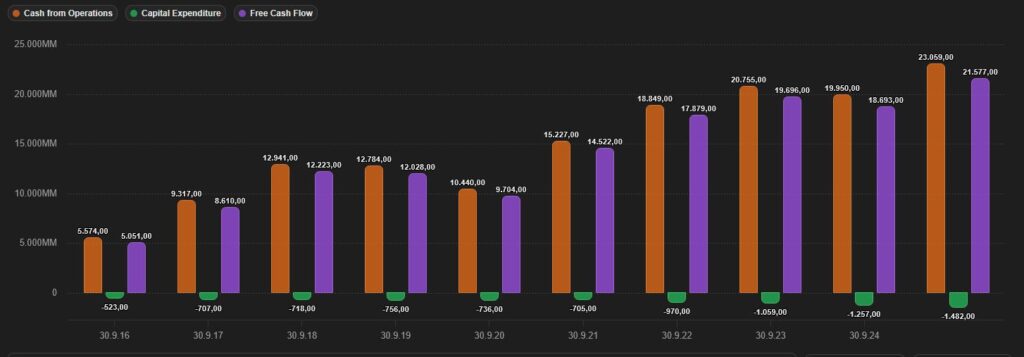
The amount available to the company Free Cashflow can be used for capital investments in organic growth, research and development, debt repayment, acquisitions, distributions of (increasing) dividends, or share buybacks. In absolute terms, the interplay of operating cash flow, free cash flow, and minimal capital expenditures (CapEx) from 2016 to 2025 is as follows:
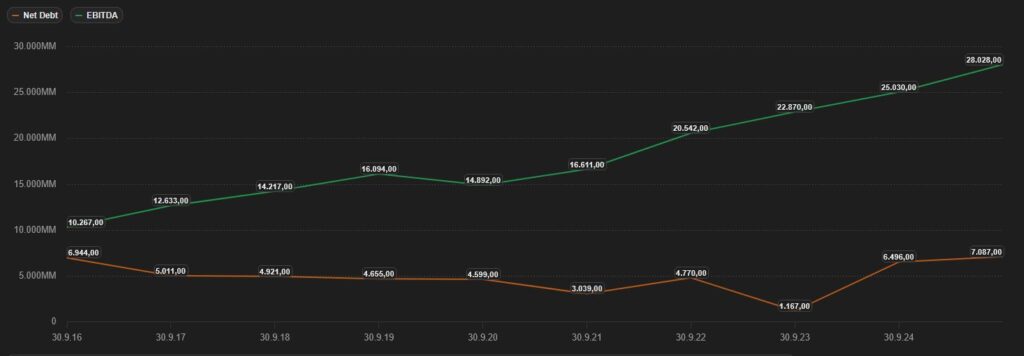
A critical look at the Debt situation shows that interest-bearing financial liabilities amount to USD 26.1 billion, offset by cash and marketable securities of USD 19 billion at the end of fiscal year 2025. This results in net debt of USD 7.1 billion. In relation to EBITDA of USD 28 billion, this calculates to a ratio of 0.3. This industry-specific value is miles below the threshold of 3, which is considered critical. In other words: Visa could completely repay its net debt from its earning power in less than one and a half months.
Thanks to this robust balance sheet structure, I'm skipping a more in-depth analysis of the Yield profile and the Maturity structure of current liabilities. Standard & Poor's confirmed the Credit rating of the company with the Investment Grade AA-.
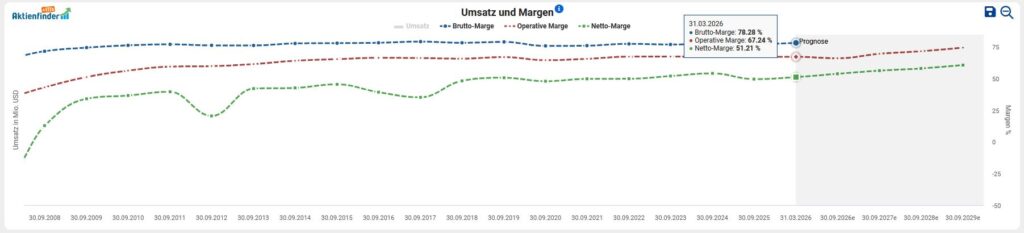
Finally, we look at the Profitability from Visa based on the development of gross, operating, and net margins. The consistency in the profitability of the business model is clearly evident from the gross margin to the operating margin. Visa has managed to maintain its gross margin at a remarkable 78 percent, with the net margin around 51 percent. This means that approximately 51 cents of every US dollar earned goes into net profit.
Opportunities & risks
The biggest structural advantage of Visa lies in its capital-light business model. As a pure network and technology company, Visa does not have physical branches, warehouses, or production facilities, does not issue cards itself, assumes no credit risk, and does not finance customer deposits. Since annual investments typically remain below one billion US dollars, Visa achieves operating margins of around 65 percent – a level that is almost unrivaled in the corporate landscape.
Linked to this is the multiple diversification of the business model. With over 60 percent of its revenue generated internationally, Visa operates simultaneously in mature markets with stable cash flows (USA, Western Europe, Japan), in dynamically growing markets (Central and Eastern Europe, parts of Asia), and in frontier markets with exponential potential (Sub-Saharan Africa, Southeast Asia, parts of Latin America), which creates substantial resilience against regional economic cycles. In addition, Visa aims to increase the share of „New Flows" and Value-Added Services from 30 to 50 percent of revenue, thereby reducing its dependence on the classic card business. Diversification across dozens of currencies also acts as an additional long-term stabiliser.
provides the strongest long-term tailwind Megatrend of cashless payments. Of the addressable market of around $41 trillion annually, approximately $23 trillion is still accounted for by cash, checks, and local payment systems. Cash continues to dominate, particularly in emerging markets, but there remains significant penetration potential even in developed markets like Germany (around 40 percent cash share). Rising smartphone penetration, government digitalization initiatives, and generational shifts in payment behavior are acting as catalysts.
Another growth driver is the Innovation potential. The e-commerce boom is increasing demand for secure digital payment solutions, benefiting Visa through higher fees on cross-border transactions as well as tokenization, which reduces fraud rates and improves authorization rates. The market for value-added services is around $520 billion annually and enables the transformation into a comprehensive fintech infrastructure provider—with the advantage that these services can also be monetized for non-Visa transactions. With the integration of blockchain and stablecoins, as well as an approximately $100 million AI investment program through Visa Ventures, the company is securing early access to future technologies.
The most prominent risk is the emergence Alternative payment methods and new competitors. Account-to-account payments like European Instant Payments, Brazil's PIX (over 40 billion transactions annually), or India's UPI bypass card networks entirely. Digital wallets like Apple Pay, Google Pay, Alipay, or WeChat Pay threaten to relegate Visa to a mere backend provider, while state-sponsored local payment systems in emerging markets are pushing for data sovereignty and independence. In addition, there are Buy Now, Pay Later providers such as Klarna, Affirm, and Afterpay, Big Tech corporations like Apple, Google, Amazon, and Meta with the potential for their own payment networks (Amazon is already experimenting with direct bank account integration), as well as established fintechs like PayPal, Stripe, Wise, and Block.
The most serious risk is the increasing regulatory intervention, especially regarding interchange fees and antitrust issues. In the EU, interchange fees are already capped, in the US, merchants are suing over the fee model, and political pressure is growing for lower transaction fees. Particularly critical are the merchant routing regulation and the Credit Card Competition Act, which would compel large banks to connect at least one third-party network in addition to Visa or Mastercard. The debate over a temporary cap on credit card interest rates under the Trump administration also underscores the growing political attention.
As an operator of critical infrastructure, Visa is also permanently Cyber risks exposed. The growing professionalism of criminal groups can lead to financial losses, reputational damage, data loss, legal disputes, and customer churn – a risk whose magnitude is difficult to calculate, which Visa simultaneously counters with its own security solutions in the VAS segment.
Finally, there is a certain Economic dependence, even if Visa does not bear credit risk. In recessions, consumer spending and thus transaction volumes decline, and the particularly high-margin cross-border business is sensitive to economic downturns. Since the US continues to account for a disproportionate share of global payment volumes due to its high card penetration and above-average per capita spending, the condition of the US consumer remains a key value driver.
Current valuation of Visa stock
For the valuation of companies in the same industry, I use the so-called Enterprise Value (EV) is short for Enterprise Value. In an acquisition, the EV represents the amount needed to purchase the operating assets, excluding non-operating assets. I compare this metric to the operating profitability (before taxes, interest, and capital expenditures (CAPEX)), expressed by EBITDA. The prevailing opinion suggests that a value below 10 signals a „healthy“ valuation.“ As with all generic Rules of thumb However, the company-specific context must also be considered by the diligent investor in the analysis. In the case of Visa, we see that a EV/EBITDA of 20.4 represents a cost-effective buying opportunity in the context of the last five years:
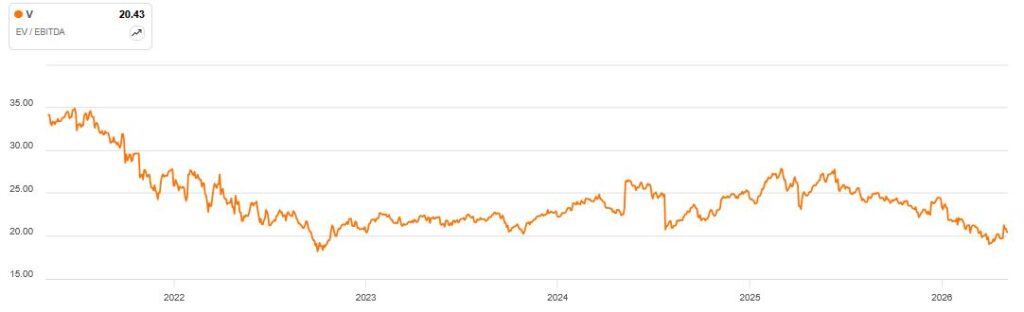
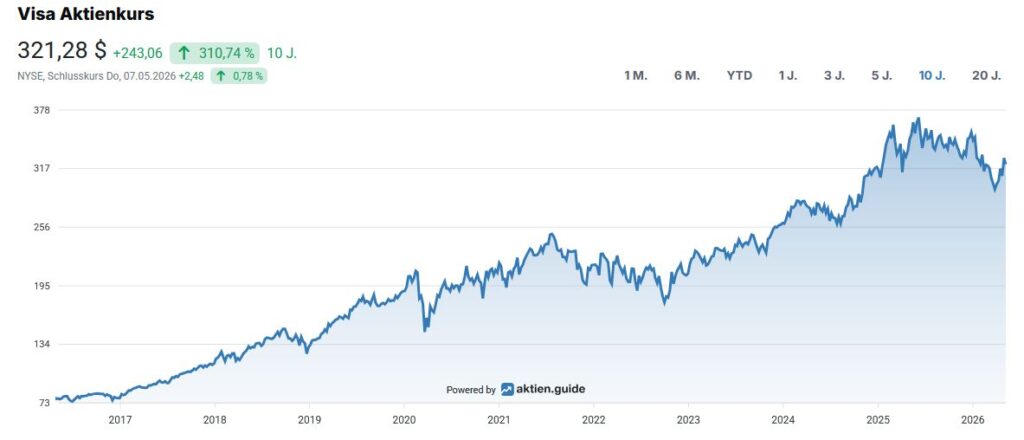
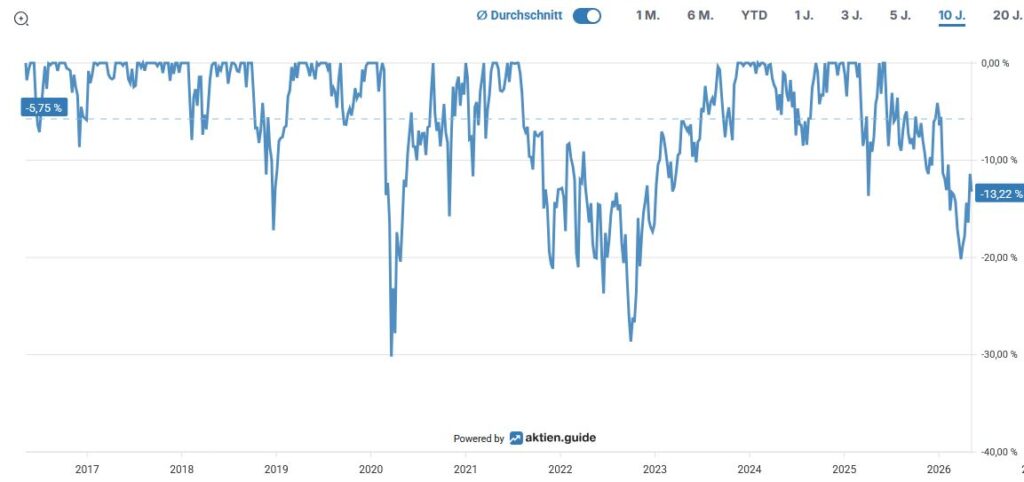
The Maximum decrease in the last ten years amounted to approx. 30 percent in the course of the Corona pandemic in 2020. Overall, we are seeing a very stable price performance, even though we are currently in a rather rare phase of weakness for Visa shares:
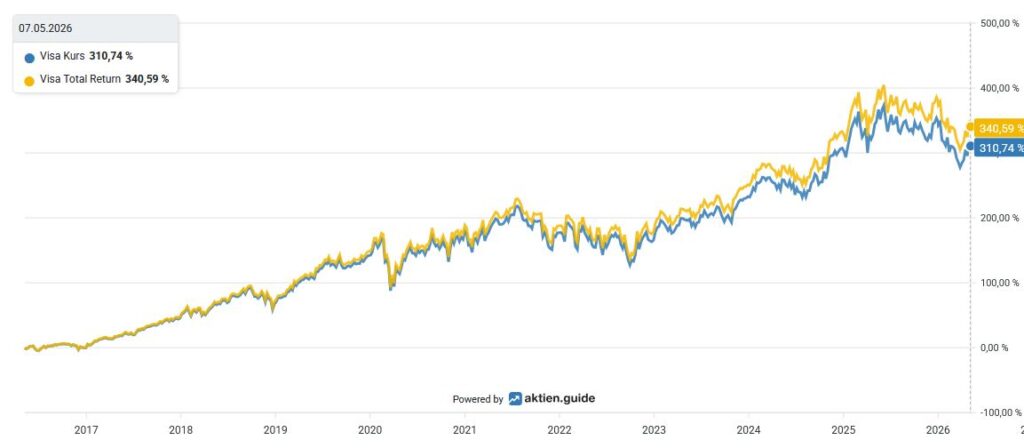
In the last ten years, an investment in Visa brought, measured by Total Return, including dividends received, a Overall performance from over 340 percent for the investor:
Capital allocation of Visa
Bei der Betrachtung der Dividendenhistorie Visa has a track record of 18 years shows growing dividends. Since their initial payout in 2008, the dividend has been increased every year.
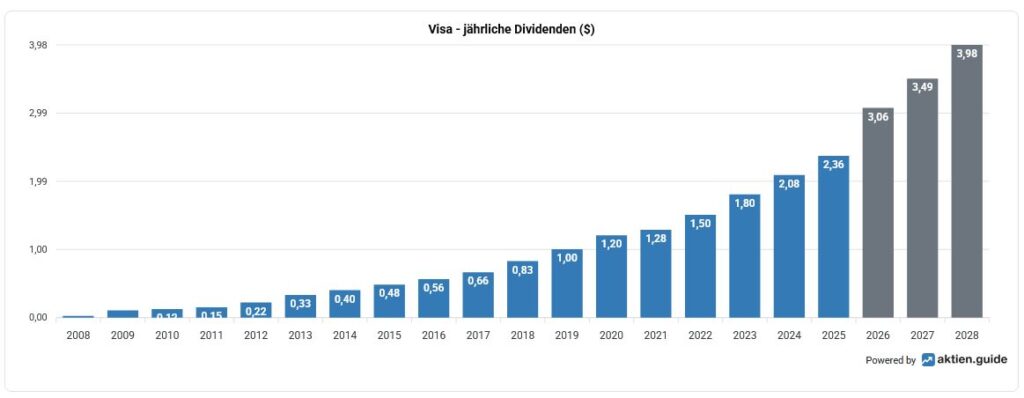
With a current price of $321.28, this results in a Dividend yield of 0.83 percent. Die Fünfjahres-Dividendenwachstumsrate amounts to 14.9 percent p.a. or 17,2 Prozent p.a. in the Ten-year period. The company last increased its dividend in October of last year by 13.6 percent. To round things off, here is an overview of the last five dividend increases:
- 2025: +13,6 %
- 2024: +13,5 %
- 2023: +15,6 %
- 2022: +20 %
- 2021: +17,2 %
The quartalsweise ausgeschüttete Dividende beträgt aktuell 0.67 USD per share and is paid out in the months at the end of the quarter (March, June, September, December).
If we take the average value of the Free cash flows of the last three years to determine the Payout ratio Interestingly, this results in a moderate payout ratio for Visa of 20.3 percent. In the coming years, I therefore see sufficient scope for dividend increases, at least in the high single-digit percentage range.
In the past ten years, Visa reduced the Number of shares outstanding by a total of 20.5 percent.
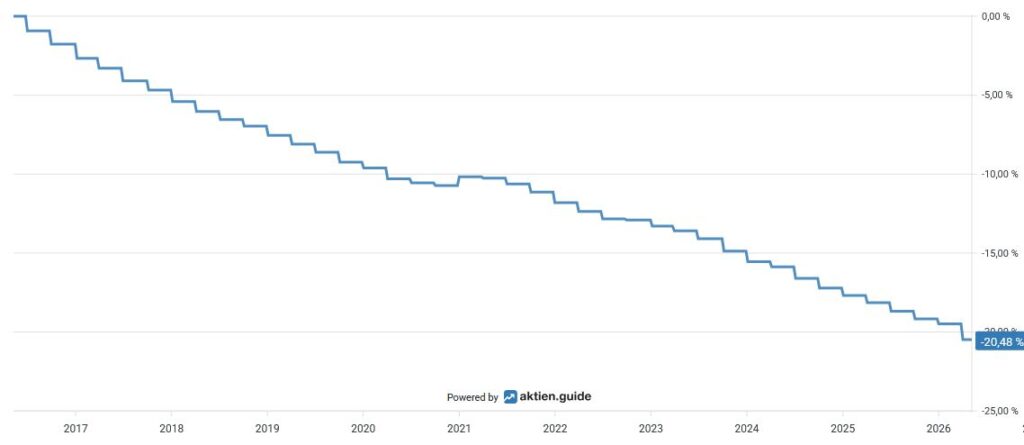
At the heart of the strategy are aggressive share buyback programs, which are among the largest in the S&P 500. After a $30 billion program announced in 2025, Visa authorized another in April 2026 $20 billion buyback program.
Conclusion: Considerations for my decision to invest in Visa
Visa possesses several structural strengths that few companies can match in combination. At its core is the capital-light business model, whose competitive advantages are difficult to replicate, as new entrants would not only have to build the technological infrastructure but, above all, overcome enormous network effects. Within the Visa-Mastercard duopoly, which controls the global credit card market outside of China, Visa is the clear market leader. This market position is complemented by strong geographical and product diversification: with over 60 percent of its revenue international, Visa operates simultaneously in mature, growing, and frontier markets, allowing it to withstand regional economic cycles well. At the same time, the megatrend of cashless payments provides significant long-term tailwinds. Coupled with increasing smartphone penetration, the e-commerce boom, generational shifts in payment behavior, and strategic expansion into value-added services, this results in substantial organic growth potential.
These structural advantages are consistently reflected in the financial figures. The high ROIC is evidence of exceptionally efficient capital allocation, which few companies worldwide achieve. Visa has maintained its net margin at just under 50 percent since 2018 – a level that generates reliable cash flows for complementary acquisitions, organic growth, and shareholder-friendly capital allocation. This combination of a dominant market position, structural growth drivers, and outstanding financial quality forms the basis of my decision to invest in Visa.