



The most important in a nutshell
- Brookfield Renewable (BEPC) is one of the world's largest producers of renewable energy. The supply of low-cost energy meets rising global demand
- Brookfield Renewable's experienced management team pursues a stringent corporate strategy that is fully geared towards growth. A multi-layered pipeline of new projects is the basis for steadily growing cash flows
- Brookfield Renewable is a core part of the Brookfield conglomerate. The main shareholder's strong position as one of the largest asset managers for alternative investments with an extensive network and established access to institutional investors is an undeniable competitive advantage for BEPC
- The participation of shareholders in the company's economic success is anchored in the form of annual dividend growth of 5 to 9%. This has been increased every year since the first distribution in 2011
- Click here for the DGI model portfolioand here to the overview of this series The dividend custody account
Company profile and business model: Who is Brookfield Renewable and what does it do?
The history of Brookfield began at the end of the century before last, in Brazil in the late 1890s. At that time, the railroad entrepreneur William Mackenzie and the qualified electrical engineer Frederick Stark Pearson - to enter the utility business alongside other infrastructure services. The company made use of hydropower to generate electricity and expanded its business activities in North America in the Ontario region over the next few decades.
After several takeovers and name changes, the Brascan Limited - the name is a historical reference to the two core countries Brasilies and K(C)anada - Brookfield Asset Management (BAM) in 2005.
For a long time, BAM managed its investments in the field of renewable energies in two different vehicles or companies. The assets were held in Brookfield Renewable Power Fund (formerly Great Lakes Hydro Income Fund) and Brookfield Renewable Power Incorporated, before BAM decided to combine all of its hydro, wind, solar, distributed generation, pumped storage and biomass businesses under Brookfield Renewable (Energy) Partners Limited, headquartered in Hamilton, Bermuda. Upon completion of the transaction, BAM owned nearly 73 percent of the combined company, which trades on the Toronto Stock Exchange under the symbol BEP-UN and on the New York Stock Exchange under BEP.
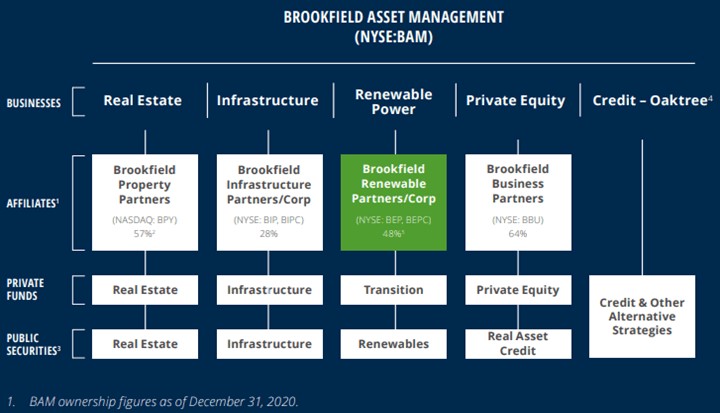
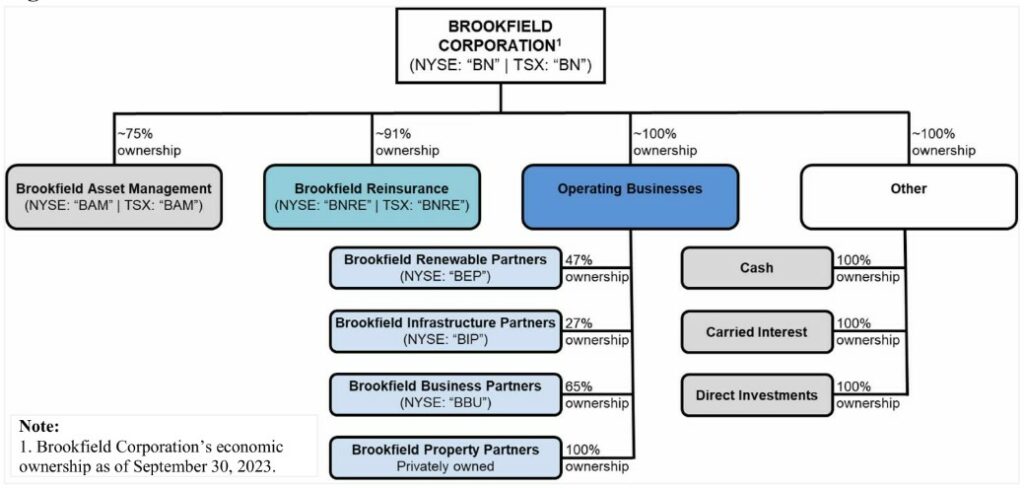
The Brookfield conglomerate today is made up of the five cornerstones listed below. As mentioned, the spin-off Brookfield Asset Management Limited now trades under the ticker symbol BAM, while the "old" BAM has been trading under the name Brookfield Corporation (BN) acts as the holding company.
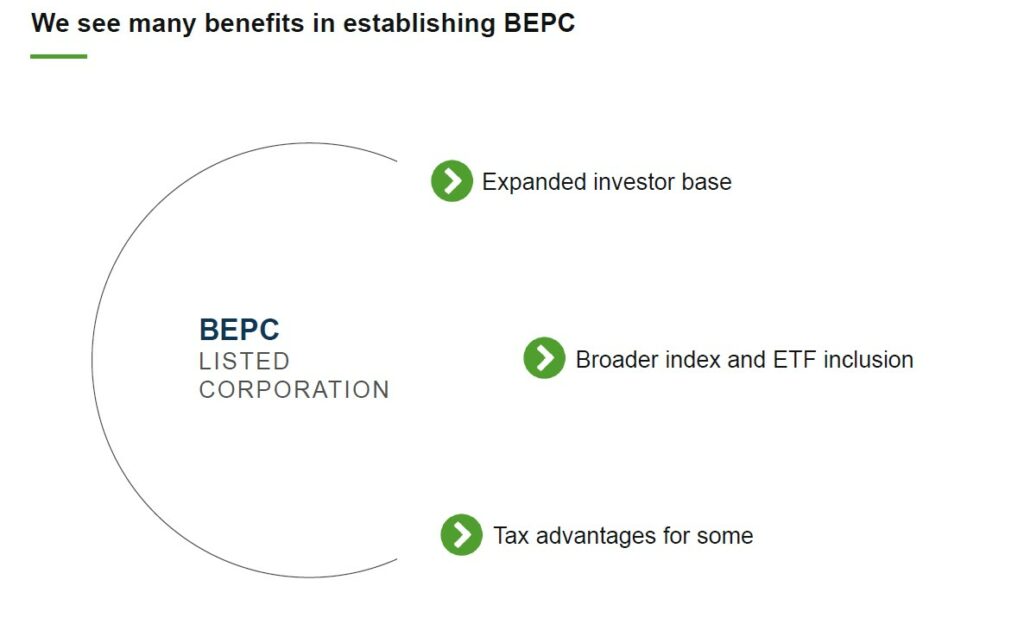
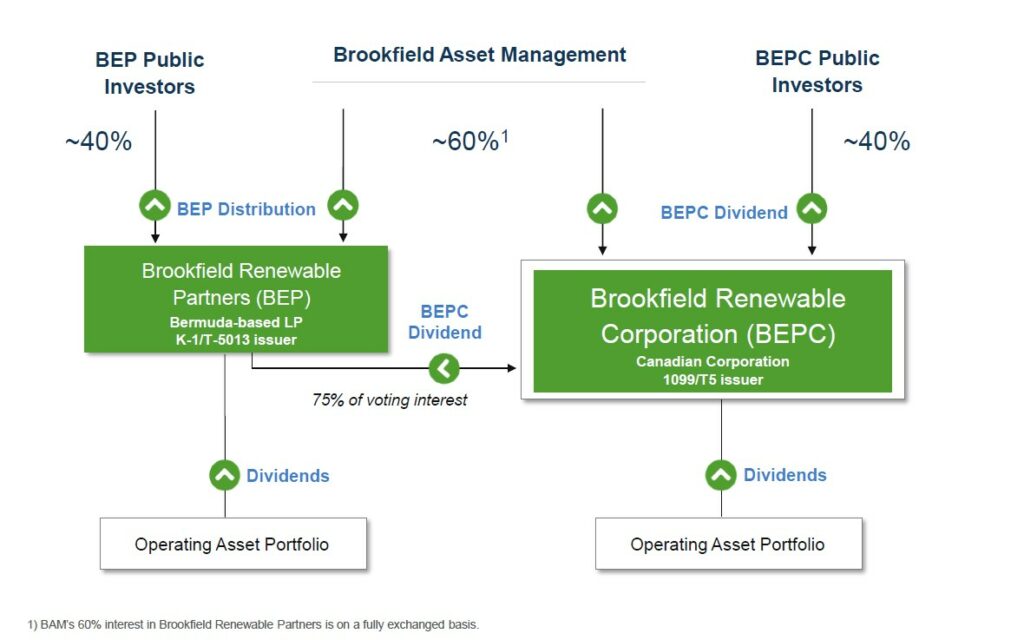
Why did I actually invest in the Brookfield Renewable Corporation with the ticker BEPC? In 2018, the management decided to split Brookfield Renewable into two separate companies. Assets from the existing BEP were transferred to the newly established BEPC, which was set up as a company domiciled in Canada and has been traded on the stock exchange since 2020. Distributions from trusts and limited partnerships are subject to different taxation than conventional shares. Due to their tax complexity, they are generally less popular with private investors, ETFs and investment funds. To provide more flexibility and liquidity, Brookfield decided to create company shares (C shares). One ulterior motive was to increase the attractiveness for US retail investors due to more favorable tax characteristics. BEPC's dividends are variable in amount and schedule (ex-dividend, payday, etc.). Identical with the distributions from BEP.
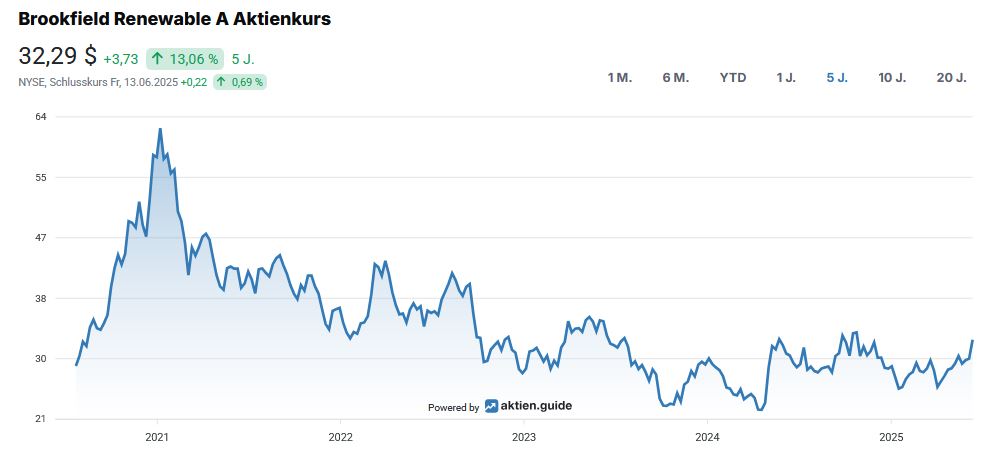
What stands out when looking at the share charts is the Different price trends after the BEPC shares were issued at the same price as the BEP units in 2020. The price difference is explained by the high level of interest in the company's shares. As demand for company shares increased, all Brookfield C shares rose in price faster than the trust and LP units. As a result, BEPC shares trade roughly at a ten percent premium, which in turn translates into a lower dividend yield by the same proportion.
The core of the Geschäftsmodells of Brookfield Renewable comprises the generation of electricity from predominantly renewable energy sources. Let us first take a look at the energy mix, i.e. what proportion of the portfolio is made up of the individual energy sources and what value contribution they make to economic success. At the same time, the geographical distribution reveals the relatively dominant position of North America for the two central segments of hydropower and wind power.
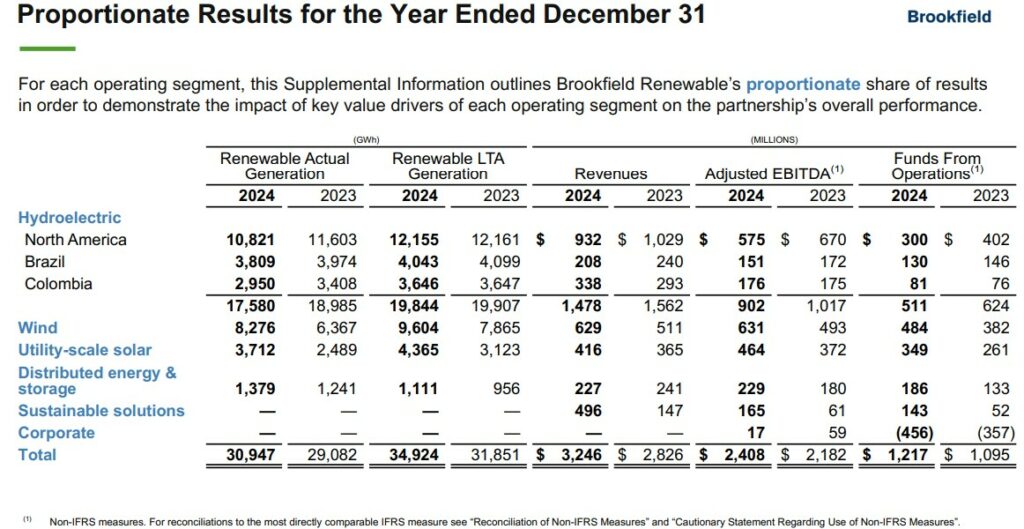
At this point, a necessary reference to the data and facts used in this chapter from now on. I refer exclusively to the aggregated figures that the company summarizes under "Brookfield Renewable" (i.e. BEP and BEPC). I am thus adopting the approach practiced by Brookfield in its external presentation and corporate communications.
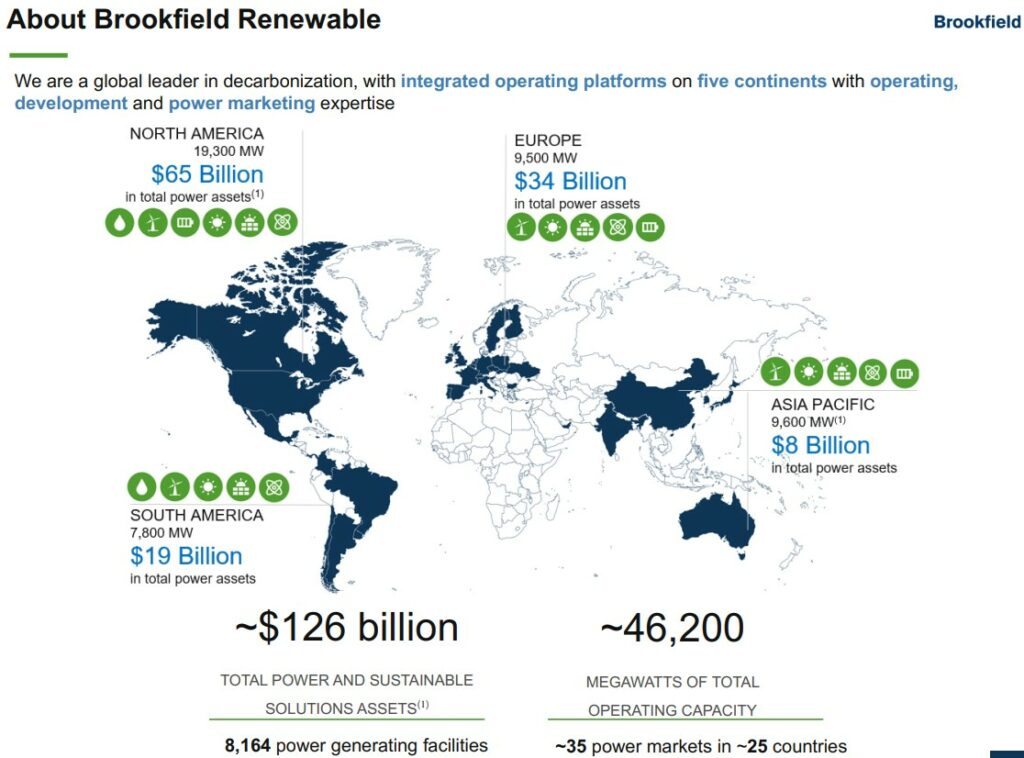
As reliable as the power supply should be, a Long-term planning for the energy producer is essential for the operation and, in particular, the development of new projects. Typical for the industry, a so-called "Power Purchase Agreement" (PPA) between the electricity producers and (wholesale) customers or electricity traders. These long-term electricity supply contracts regulate the conditions regarding the amount of electricity that can be supplied, payment processing and, of course, the fixed price. The average remaining term at Brookfield Renewable is 14 years.
Due to the "Inflation Reduction Act" of the former US administration under Joe Biden and strong demand from the private sector, Brookfield is actively driving forward development projects in the United States. Since 2022, the portfolio of global projects has Pipeline for the development of renewable energy plants has more than doubled to around 227,000 megawatts.
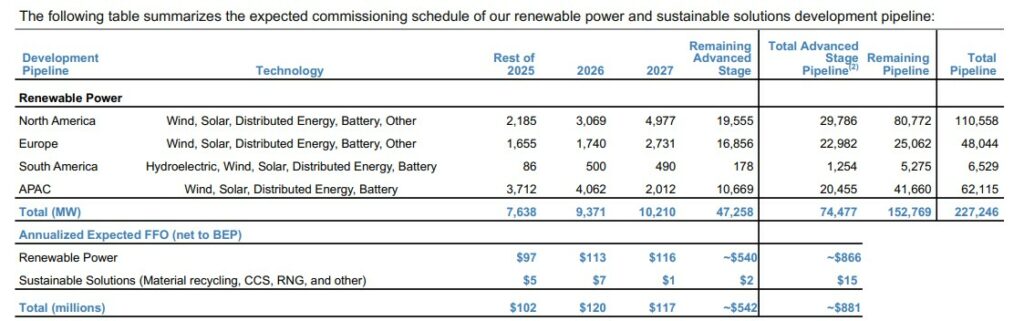
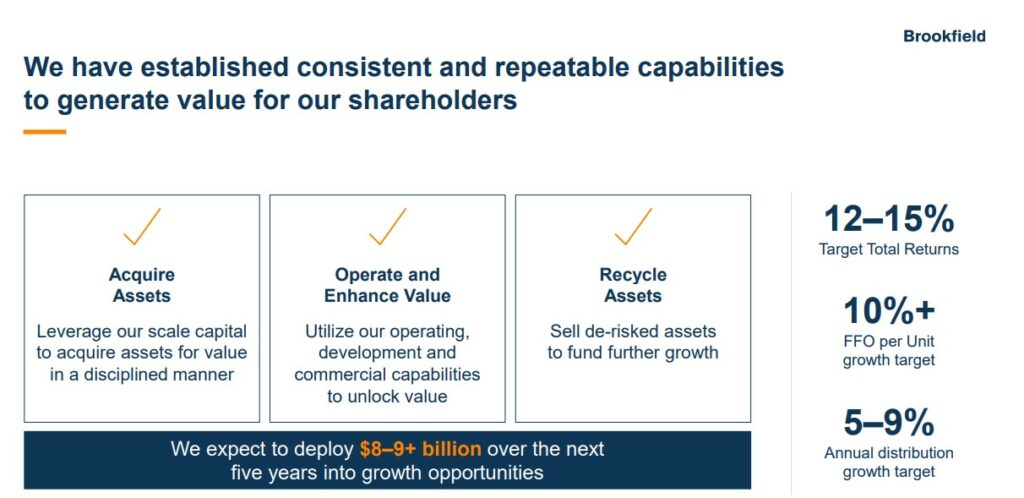
Diese Growth ambitions go hand in hand with Brookfield's strategy of positioning itself on the capital market as a company with a strong cash flow. The management's objective is to achieve a 12 to 15 percent return on capital employed.
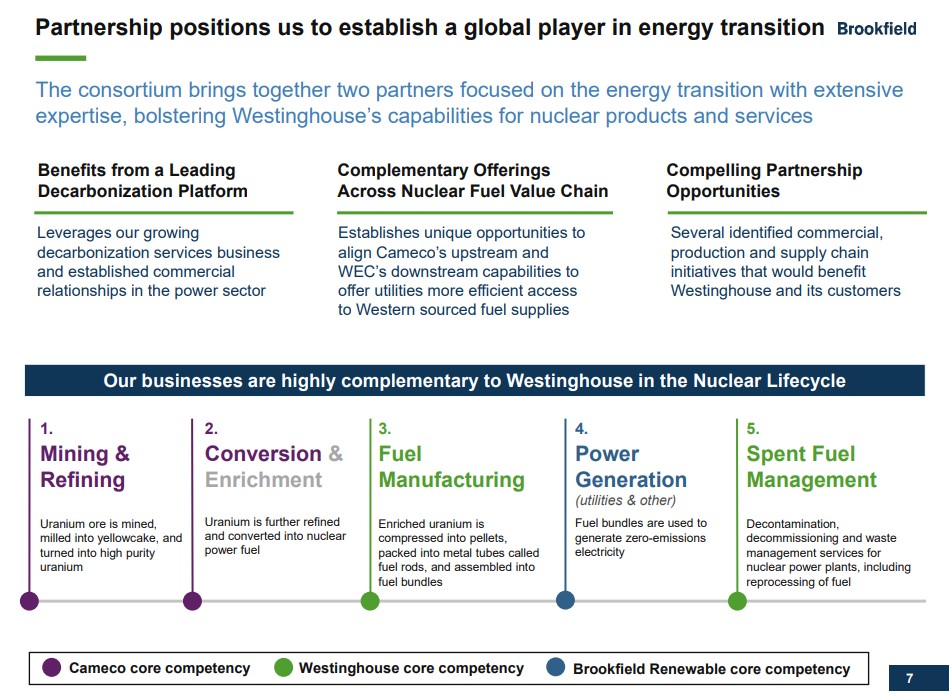
In October 2022 Brookfield Business Partners announced that the subsidiary specializing in nuclear technology Westinghouse Electric to a consortium consisting of Cameco and Brookfield Renewable Partners for sale. Cameco is one of the world's largest suppliers of uranium fuel for nuclear power and has extensive uranium mining, refining and conversion facilities. Brookfield Renewable, together with its institutional partners, holds a stake of 51 percent to Westinghouse and Cameco the remainder. The resulting equity costs were split pro rata between Brookfield Renewable and its institutional partners (approximately USD 2.3 billion) and Cameco (approximately USD 2.2 billion).
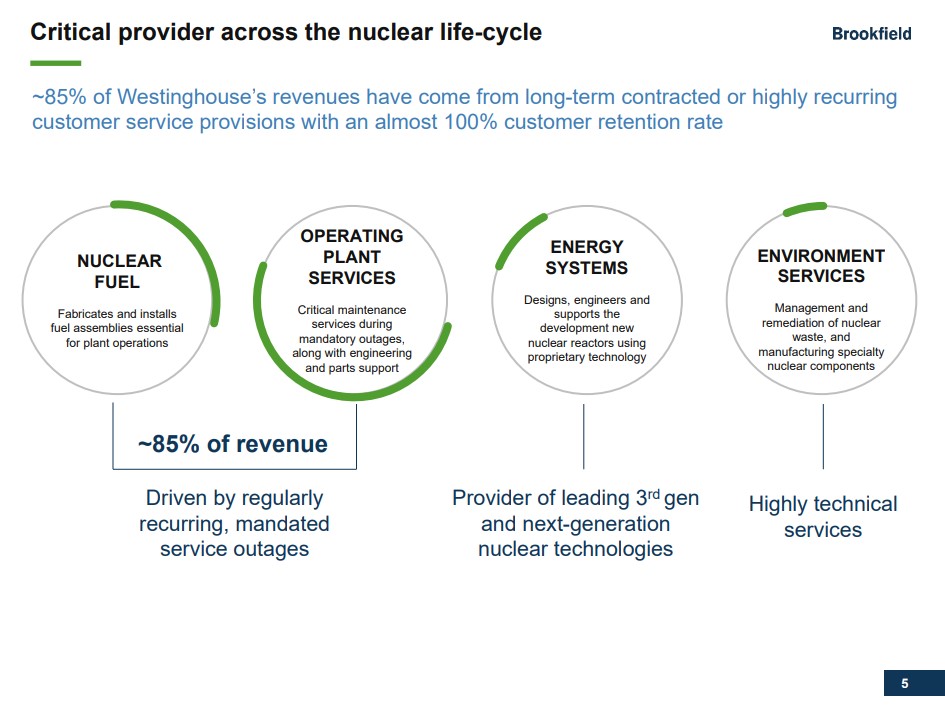
As an original equipment manufacturer, Westinghouse supplies more than the Half of the world's nuclear reactors. As an industry leader, the company has a workforce of around 9,000 employeeswhich have been used for years in these highly regulated markets around the world. In 2018, Brookfield bought the then insolvent manufacturer of nuclear power plants for USD 4.6 billion.
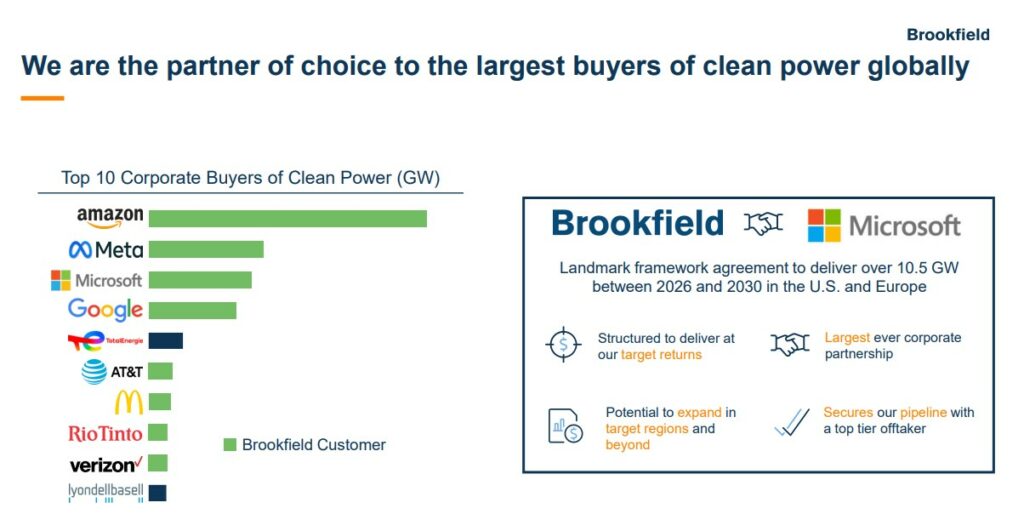
In May 2024, a significant Cooperation between Brookfield Renewable and Microsoft was announced. The two companies have entered into an agreement to develop and deliver more than 10.5 gigawatts of renewable energy. This partnership includes the development of new wind and solar projects in the US and Europe and is recognized as one of the largest single agreements in the renewable energy sector.
The ownership structure of Brookfield is unsurprisingly more complex than that of other companies in the sample portfolio. Looking at the top 10 currently reported owners, one could get the impression that the parent company Brookfield Corporation holds just under a third of the outstanding Class A shares.
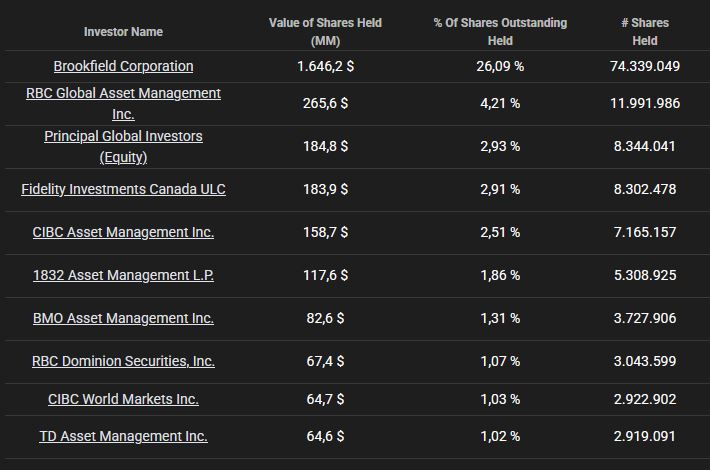
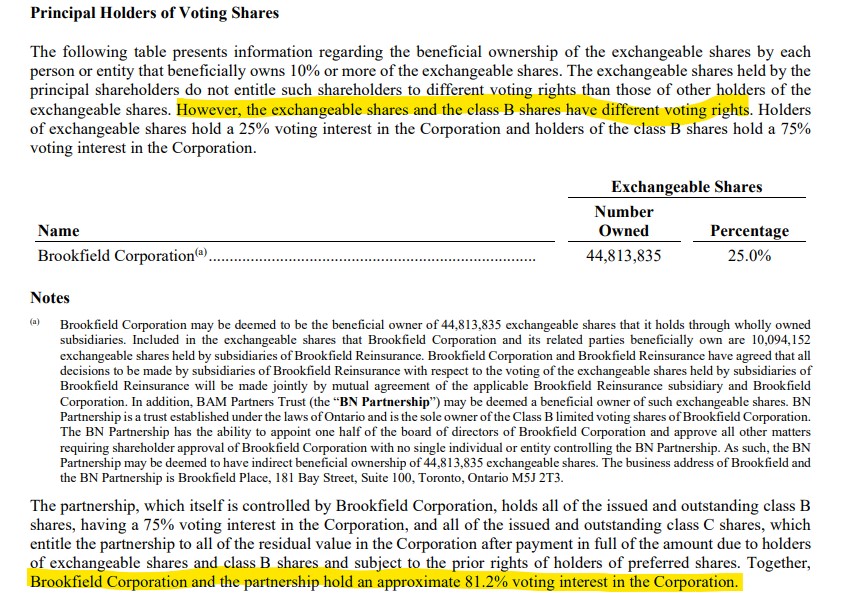
However, a closer look at the annual report sheds light on the existence of the B class of shares in addition to the A shares ("exchangeable shares") traded on the stock exchanges in New York and Toronto. In particular the 165 B shares have an exorbitant voting weight. This means that Brookfield Corporation, which holds all Class B shares via BEP, holds exactly 81.5 percent of the voting rights. In other words: without Brookfield's consent, no resolutions can be passed that would conflict with the interests of the majority shareholder.
The financial situation of Brookfield Renewable
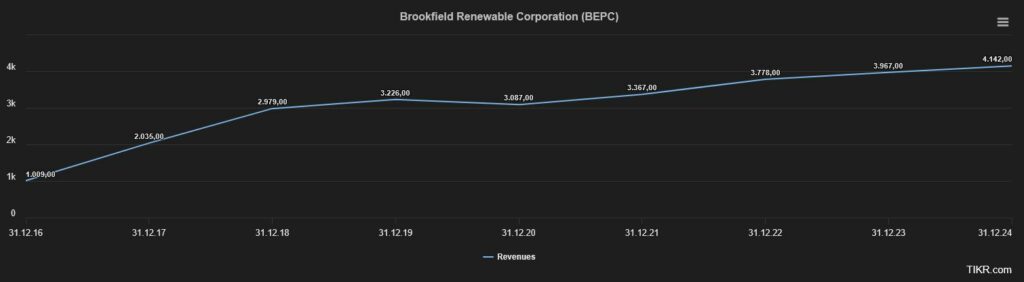
After gaining an overview of the industry in general and taking a closer look at the company, management and strategy as factors that influence decision-making, we take a look at the Bilanz and the Finanzkennzahlen from Brookfield Renewable. The focus here is on the Growth, debt situation and the Financing. To analyze the financial situation, we first look at the development of sales, funds from operations and liquidity.
To the Sales development It can be stated that the top line has increased by an average of 13.4 percent p.a. grew.
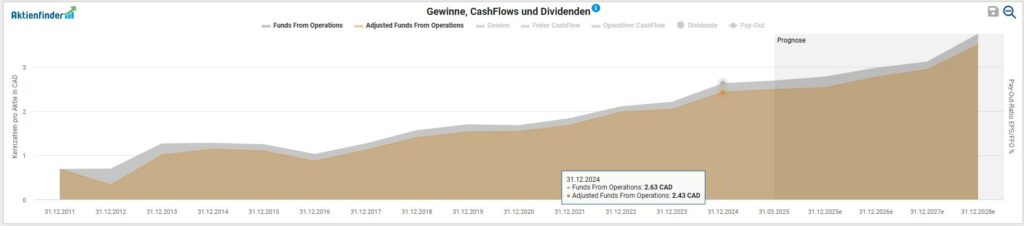
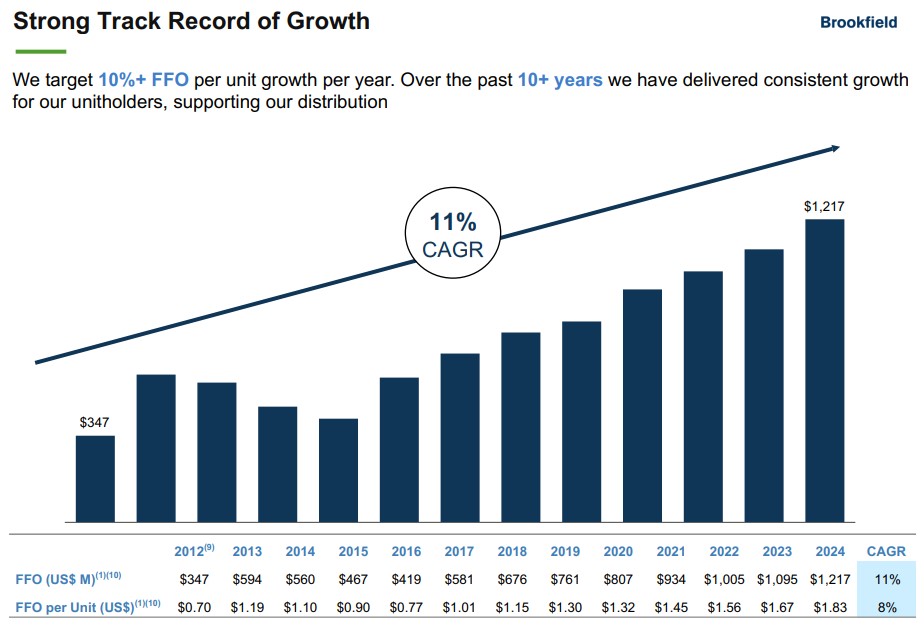
The resources available to the company Funds From Operations (FFO)which are also used by real estate investment trusts (REITs) as an indicator for evaluating the actual cash transactions in the financial year, can be used for capital investments in organic growth, research and development, repayment of debt, expansion via company acquisitions, distribution of (increasing) dividends or share buybacks. The latter hardly ever occurs with utilities and real estate companies. The opposite is the case, as issuing new shares is a proven instrument for raising capital to finance growth expansion in the form of new projects. In absolute figures - which I primarily like to refer to - the increase in FFO for the period 2011 to 2024 based on the BEPC figures is expressed as follows:
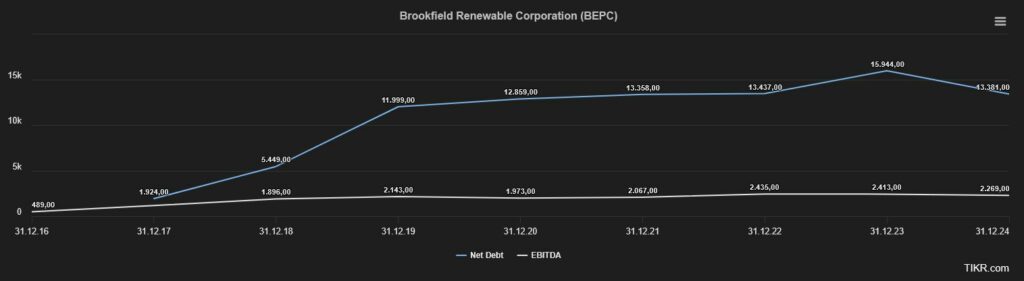
A look at the Debt situation shows us that BEPC has a share of interest-bearing financial liabilities of USD 14.1 billion, which in turn is offset by cash and cash equivalents and securities totaling USD 0.7 billion. If we now divide the remaining net debt after adjustment for other factors of USD 13.4 bn by the most recently generated EBITDA of USD 2.3 bn, we arrive at a ratio of 5.8. Although this value is well above the threshold value of 3, which is generally regarded as critical, if we include the industry context relevant to this specific investment case in our Financial analysis If we also take into account the costs of the utilities sector, it is not uncommon for values to deviate from the standard by twice the amount.
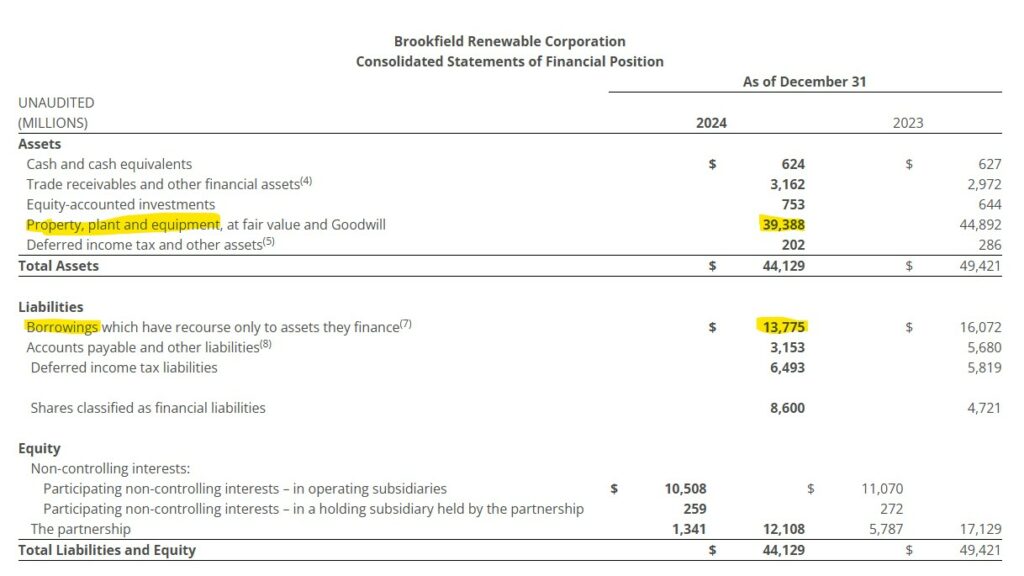
At this point, I would like to draw attention to the capital-intensive infrastructure and the ongoing maintenance and repair costs in order to further analyze the balance sheet. If we only use the Anlagevermögen (USD 38.7 billion) of BEPC in relation to the Net debt (USD 13.8 billion), this results in a passable value of 0.36. What is striking and positive is the Low goodwill of USD 0.7 billion, which is to be recognized as an intangible asset in the balance sheet for company acquisitions and which I had already deducted from fixed assets.
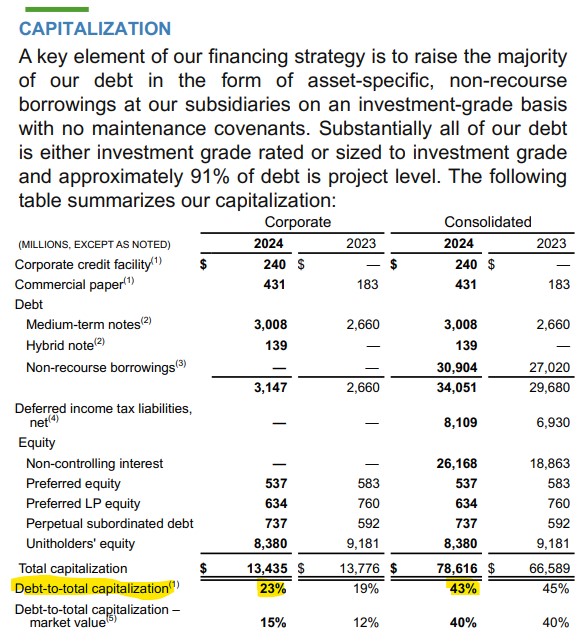
Finally, I would like to mention a valuation metric that is often used in the case of utilities to evaluate the liabilities in a balance sheet and to analyze leverage and financial stability. We are talking about the Total debt-to-capitalization ratio. The sum of all (short and long-term) interest-bearing financial liabilities is set as a percentage of the company's total capitalization. My heuristic approach: the higher the gearing ratio, the riskier the company is, all other factors being equal. This is because a higher leverage ratio means that the company is financed more by debt than equity, which in turn poses a greater risk to creditworthiness if the debt cannot be paid on time. For utilities, ratios between 50 and 60 percent are considered safe. Brookfield Renewable ends up with a respectable value of 43 percent at overall Group level:
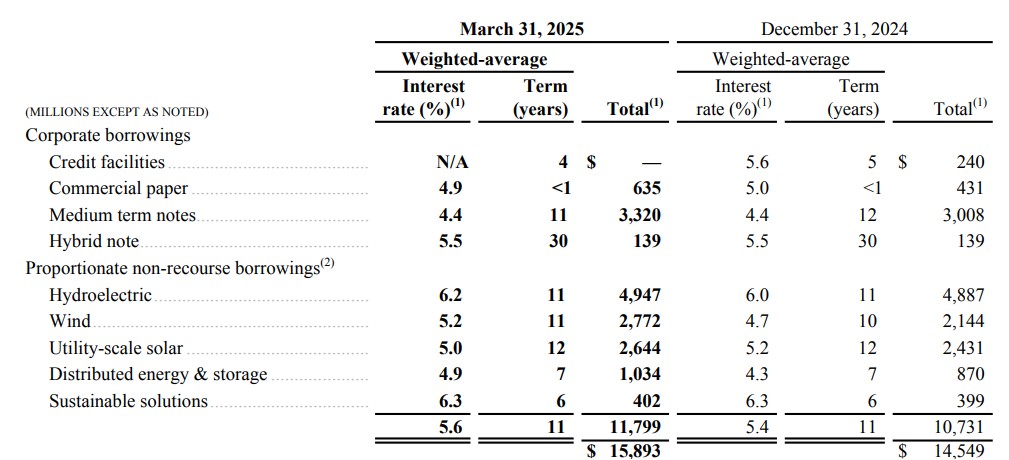
Around the topic Indebtedness and External financing it makes sense to look at the Interest profile and the Maturity structure of current liabilities. Finally, it is important to assess how vulnerable the company appears to be to the continuing rise in key interest rates. In the last quarterly report, the management pointed out that twelve percent of current loan liabilities Variable interest rate are. Brookfield Renewable also announces that the Loan liabilities at 90 percent into the individual project companies (Special Purpose Vehicles) in order to avoid concentrating the credit burden in the holding company. Standard & Poor's and Fitch recently confirmed the company's credit rating of BBB+ with a stable outlook.
Opportunities & risks
The gradual expansion of the existing business provides reliable cash flows (or funds from operations (FFO)), which enable an owner-friendly capital allocation based on a conservative financing structure. Over the years, Brookfield Renewable has established itself as one of the world's largest players in the renewable energy sector. The broadly diversified supply, combined with low input costs, meets a global demand for energy that continues to rise. In addition, the strategic cooperation with Cameco in the acquisition of the nuclear power plant manufacturer Westinghouse enabled the company to enter a new business segment, which led to a further diversification of its sources of income.
The focus on multi-billion dollar subsidy programs such as the US "Inflation Reduction Act" has increased the flow of capital towards renewable energies to date. Brookfield has built up a formidable track record in the development, operation and execution of renewable energy assets over the past decades. It should be noted that the utility, as a core part of the Brookfield conglomerate, has direct access to an extensive network of institutional investors. This can be emphasized as a competitive advantage for raising capital.
Considering the various risks, the international diversification of assets entails a higher exposure and requires active management of various risks (e.g. currency risks, geopolitical risks). The operation of energy generation plants is associated with operational risks, including technical failures, natural disasters and other unforeseen events that can have a negative impact on production and costs. The generation of renewable energy, particularly from hydropower, wind and solar power, is heavily dependent on weather conditions. Unforeseeable weather events can affect energy production.
Although financing, and therefore primarily the bundling of risks, takes place at project level, Brookfield Renewable works with a decent level of leverage. Changes in interest rates or access to capital could increase financing costs and limit growth potential. Regulatory intervention in the energy market by federal, national or international institutions represents a permanent risk for energy suppliers. For example, subsidies for renewable energies could be reduced or new environmental regulations introduced.
Current valuation of the Brookfield Renewable share
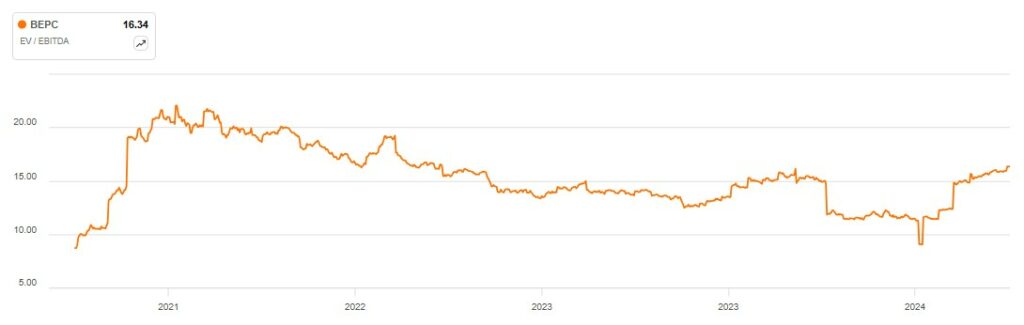
For the valuation of companies, I use the so-called Enterprise Value (EV) is used. In the case of a takeover, the EV indicates the amount required to purchase the assets required for operations and excludes the non-operating assets. I relate this key figure to operating profitability (before interest, taxes and investments (CAPEX)), expressed as EBITDA. The prevailing opinion is that a value of less than 10 indicates a „healthy valuation“ - as is always the case with generic Rules of thumb the company-specific context must be considered in the analysis by the careful investor himself. In the case of Brookfield Renewable, we saw the Valuation result of 16.3 more favorable multiples in the last twelve months:
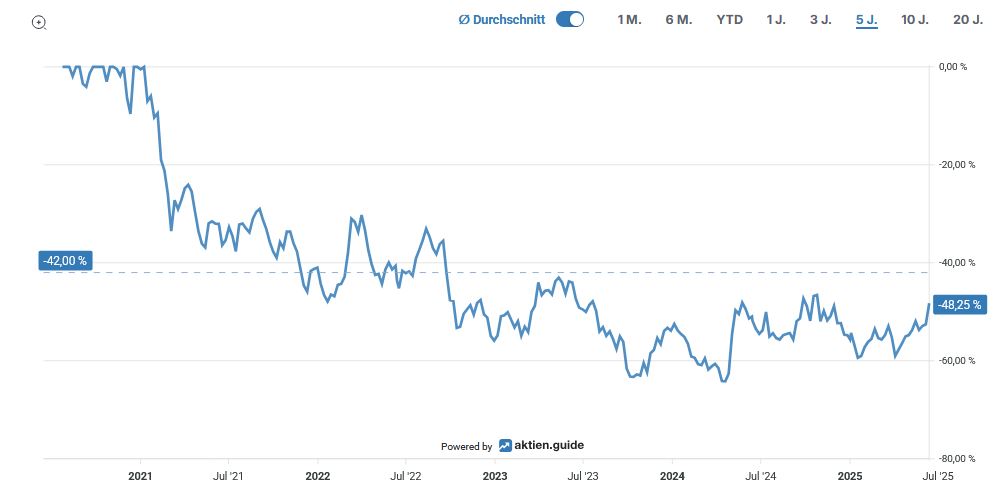
The Maximum decrease in the last five years amounted to approx. 64 percent in the year 2024:
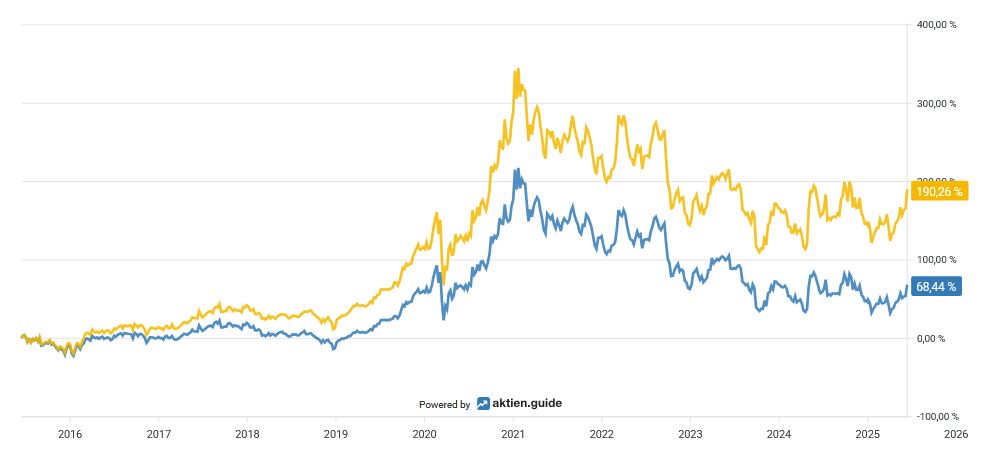
Over the last ten years, an investment in Brookfield Renewable has yielded Total Return, including dividends received, a Overall performance from 190 percent for the investor:
Capital allocation of Brookfield Renewable
Due to the relatively recent history of the actual BEPC, I am referring to BEP for the evaluation of dividend quality. Why? Because when BEPC was founded, great importance was attached to ensuring that BEP's dividend continuity was handled in the same way. In fact, the distributions of both BEP and BEPC amount to the equivalent sum (currently USD 0.373 per quarter).
In the meantime, Brookfield Renewable has been 16 years of continuous dividend to. This means that the Canadian supplier is a so-called Dividend Contenderwhich increase the dividend between 10 and 24 years.
At the current share price of USD 32.29, this results in a Dividend yield from 4.6 percent. The Five-year dividend growth rate amounts to 5.3 percent p.a. or 5.6 percent p.a. in the Ten-year period. The company last increased its dividend by 5.1% this January. To round things off, here is an overview of the last five dividend increases:
- 2024: +5,2 %
- 2023: +5,5 %
- 2022: +5,3 %
- 2021: +5,0 %
- 2020: +5,4 %
The quartalsweise ausgeschüttete Dividende currently amounts to USD 0.373 per share and is paid out at the end of each quarter (March, June, September, December).
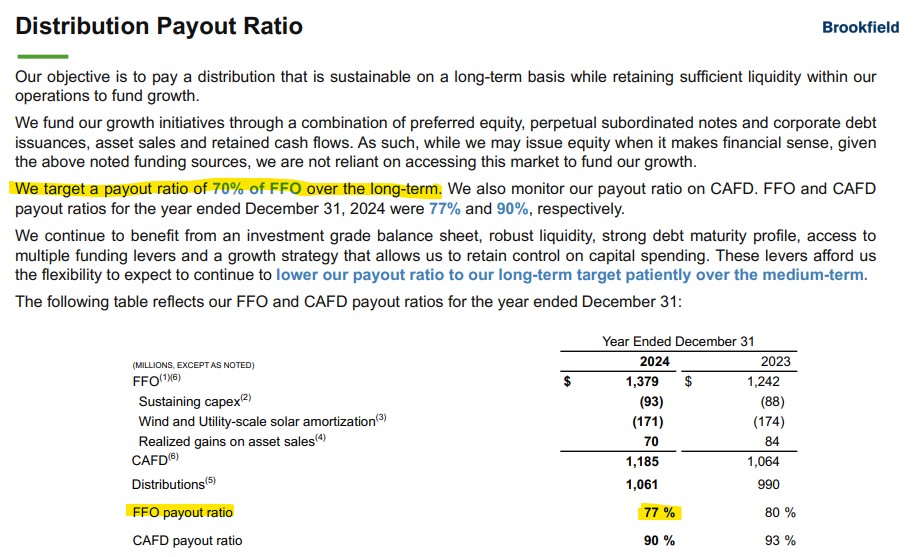
Let's pull the Funds From Operations As a basis for determining the payout ratio, we end up with a payout ratio of 77%. This is currently above the target value of 70%. For us as investors, this could mean that the payout increases in the coming years will be somewhat lower compared to FFO growth until the company has reached its payout target.
As part of the capital allocation strategy, the element of Share buybacks rarely play a decisive role. It is therefore not surprising that Brookfield Renewable has made little use of share buybacks in the past. Nonetheless, the management has been granted the power to acquire own shares equivalent to five percent of the company's total issued shares until the end of 2025.

Conclusion: Considerations for my decision to invest in Brookfield Renewable
Brookfield Renewable is one of the world's largest listed companies in the renewable energy sector. As part of Brookfield Asset Management, the Group focuses on the acquisition, development and operation of energy generation assets. The company has an extensive and diversified portfolio of hydroelectric, wind, solar and energy storage assets. Thanks to the strategic cooperation with Cameco to acquire the nuclear power plant manufacturer Westinghouse and the associated entry into a new business area, Brookfield Renewable has diversified its sources of income. The use and generation of electricity from nuclear power will remain relevant as a bridging technology for the energy transition over the coming years (decades).
These plants are geographically distributed across the globe and are mainly located in North and South America, Europe and Asia. The company benefits from long-term contracts with built-in inflation protection and stable cash flows secured through the generation and sale of renewable energy. This provides investors with financial security and predictable returns for the development of new investment projects. As explained above, Brookfield Renewable is pursuing a growth strategy that includes both organic development and strategic acquisitions. This enables the company to expand its capacities.
Overall, Brookfield Renewable offers an attractive opportunity for investors looking to invest in the renewable energy sector combined with stable returns and long-term growth potential with a financially strong core shareholder.

