



The most important in a nutshell
-
Comfort Systems USA has a profitable business model in a fragmented domestic market that is undergoing ongoing consolidation.
-
The company has more than quintupled its turnover over the past ten years through the targeted acquisition of regional competitors.
-
Strategically, the serial acquirer is focusing on structurally growing areas such as data centers, cloud and AI infrastructure, semiconductor manufacturing, electromobility as well as energy and storage solutions.
-
Capital allocation is clearly geared towards shareholder value, with strong dividend growth and opportunistic share buybacks.
-
Further information can be found in the DGI model portfolio and in the overview of the series The dividend custody account.
Company profile and business model: Who Comfort Systems USA is and what it does
What began as a merger of regional specialists in the mid-1990s developed into a national group: Comfort Systems USA. The provider of technical building equipment now operates as a nationwide network of subsidiaries. The company was founded in Delaware in the mid-1990s, but operations began in 1997 when twelve established heating, ventilation and air conditioning (HVAC) companies were merged to form Comfort Systems USA and simultaneously listed on the NYSE under the ticker symbol FIX.
From the very beginning, the Group, headquartered in Houston, Texas, was focused on forming a US-wide provider of mechanical and later also electrical building services, offering its customers installation, service and maintenance from a single source.
In the early years, Comfort Systems USA pursued a pronounced buy-and-build strategy and integrated numerous regional trade and service companies, resulting in a rapid increase in sales and national presence. However, a period of economic weakness and a high level of maturing financial liabilities forced the Group to undergo a strategic restructuring in the early 2000s, during which a total of 19 subsidiaries were sold to competitor Emcor in 2002. This made it possible to reduce debt and stabilize the balance sheet. In the years that followed, Comfort Systems USA resumed its growth course, modernized its service portfolio to include areas such as building automation, modular/off-site manufacturing and energy services and expanded its network of operating units to over 45 companies with more than 170 locations in around 130 cities in the United States.
Today, Comfort Systems USA is one of the leading specialized service providers for mechanical and electrical building systems in the United States, offering services ranging from HVAC, plumbing and piping to electrical installations and fire protection. S&P 500 rise. The Group sees itself as a decentrally organized association of locally anchored companies that combines the strength of a large network with the regional customer and market proximity of the individual subsidiaries.
The core of the business model is the planning, installation and maintenance of technical building equipment (MEP: Mechanical, Electrical, Plumbing) for the construction, conversion and modernization of non-residential buildings. Around 90 percent of revenue comes from project-related construction and installation services, while around 10 percent comes from ongoing service, maintenance and repair contracts. These ensure recurring cash flows and customer loyalty. The company operates on a decentralized basis: local subsidiaries acquire projects, manage execution and personnel, while the head office bundles purchasing, capital allocation and M&A, among other things.

Comfort Systems USA reports on two operating business segments:
- Mechanical includes heating, ventilation, air conditioning, sanitary/plumbing, pipeline construction, building automation/controls, modular/off-site production, monitoring and fire protection, which together generate the majority of sales (around USD 4.2 billion in 2024).
- Electrical bundles the installation and servicing of electrical systems. This segment contributed around USD 1.3 billion to Group sales in 2024 and is growing through projects in data centers, industrial and energy technology, among others
Geographically, FIX is a purely US-oriented provider with a nationwide presence with a focus on economically strong regions such as the Southeast, Texas, the Midwest and selected coastal states.

The Corporate strategy of Comfort Systems USA can best be described as a scaled but decentralized „MEP champ“ that targets high-quality industrial and tech infrastructure through buy-and-build, service expansion and technology focus. It builds on the fact that FIX has been pursuing a consistent M&A strategy for years in order to acquire regional specialists, broaden its service portfolio and consolidate its geographical coverage. Acquisitions such as Summit Industrial and Century Contractors serve to penetrate segments with higher margins and strengthen the ability to implement complex projects (e.g. data centers, semiconductors).
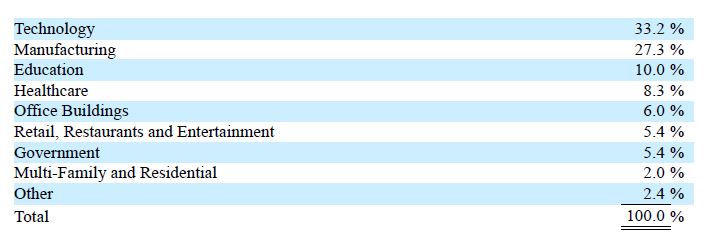
Strategically, the company is focusing on structurally growing sectors such as technology (data centers, cloud/AI infrastructure), semiconductors, automotive/electromobility, life sciences and energy/storage solutions. These industrial and tech projects account for an increasingly large proportion of the backlog, which has recently supported both sales growth and profitability.
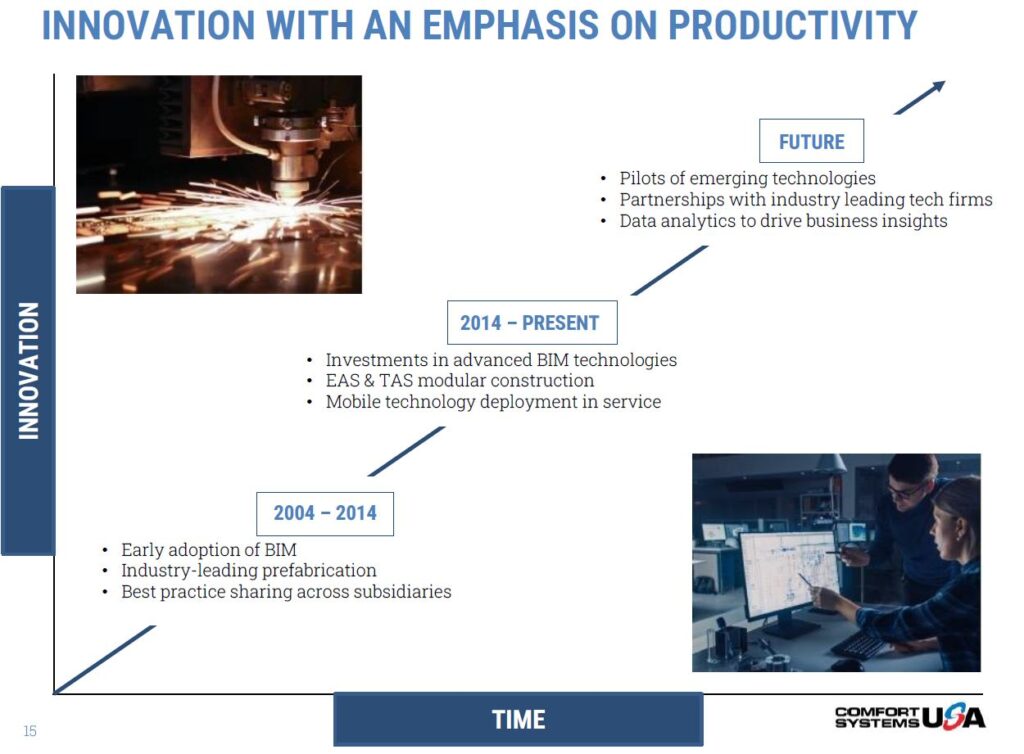
A central element of the strategy is the expansion of volumetric/modular offsite production („build before you build“) and the use of digital tools for project planning, control and monitoring. This modular, „Lego-like“ construction method reduces construction time and execution risks, improves scalability and enables large-scale projects to be completed with greater planning certainty and better margins.
In addition to the project business, Comfort Systems is focusing on growing service revenue (maintenance, monitoring, service contracts) and major national customers in order to strengthen recurring cash flows and customer loyalty. The record-high order backlog, which is resilient over several years, is seen as a strategic „pipeline“ that secures capacity planning, price discipline and investments in personnel and technology. As mentioned above, operational implementation is deliberately decentralized.

The company stands out above all for its experienced, long-term oriented management team with a strong industry background. CEO Brian E. Lane has led the company since 2011, has been with the Group since 2003 and is regarded as the architect of the decentralized, M&A-driven growth strategy.
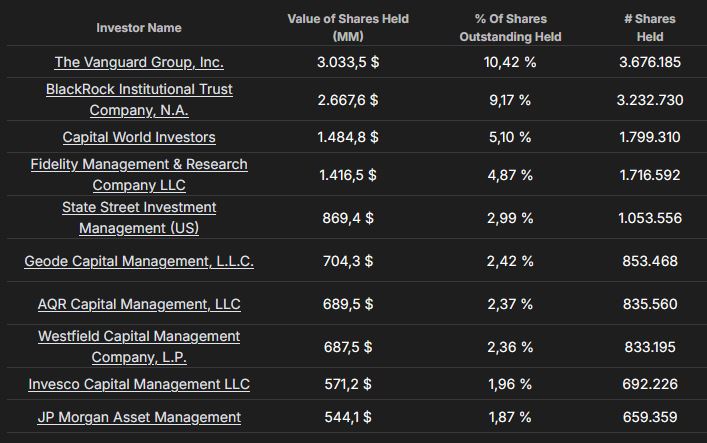
Institutional investors clearly dominate on the ownership side: over 85% of shares are held by funds and other institutions, with companies such as BlackRock, Vanguard, Capital Group, Fidelity and State Street among the largest shareholders.
Industry profile and competitive situation
Comfort Systems USA operates in the US non-residential MEP services industry, which is characterized by high fragmentation, pronounced regionality and a mix of cyclical project business and relatively stable service revenues. The market is structurally driven by issues such as energy efficiency, ageing building stock, stricter regulatory requirements and smart building and automation trends and is growing in the mid single-digit to low double-digit percentage range per year in North America.
It is characteristic that a very large proportion of market participants are small and medium-sized, locally based trades and specialist companies, while only a few larger, nationally or internationally operating groups offer a broader range of MEP services as a so-called „one-stop store“. Competition often takes place in narrow regional markets via tenders and fixed-price contracts, with corresponding pressure on margins.
Comfort Systems USA's strongest competitors in the narrower, directly comparable field include in particular EMCOR Group, which is a high-volume provider of mechanical, electrical and building services in the US and internationally and occupies a similar position along the non-residential construction and service business. Therefore, I decided to take a closer look at this company for the competitive comparison. In addition, FIX competes on a project and customer-specific basis with other specialized construction and MEP service providers such as Quanta Services, APi Group (especially in the fire protection and building services sector), IES Holdings, Primoris as well as regionally strong players such as ACCO Engineered Systems and ABM Industries, while large industrial groups such as Johnson Controls tend to act as system providers and integrators at the interfaces to technology and building automation.
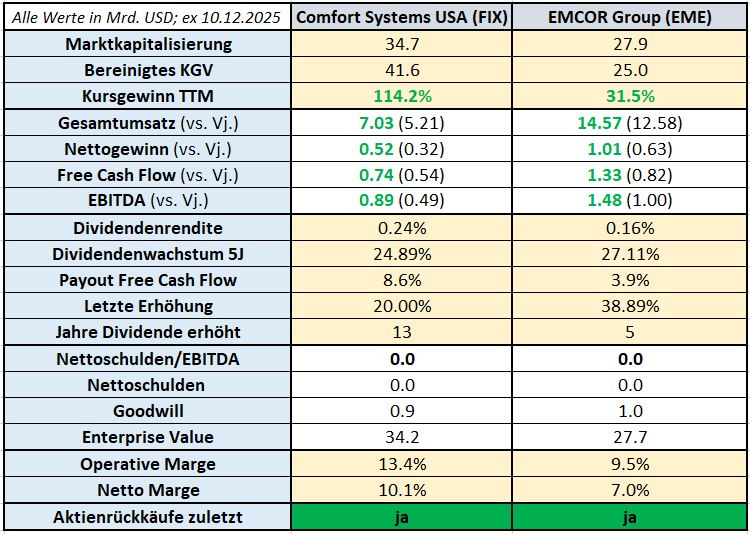
Notes on the values contained in the table:
- Green or red coloring of the figures indicates growth or decline compared to the previous year
- All values are stated in US dollars
The financial situation of Comfort Systems USA
After gaining an overview of the industry in general and taking a closer look at the company, management and competition, we take a look at Canadian National's balance sheet and the key financial figures derived from it. The focus here is on the following aspects Growth, profitability and the Financing.
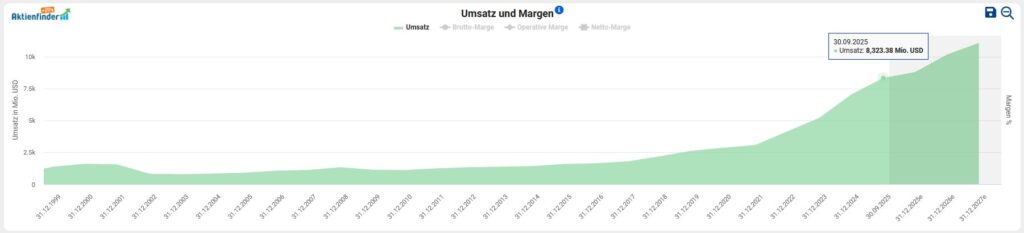
To analyze the financial situation, the first step is to look at the development of sales, profit and free cash flow. I have already discussed the internal distribution of sales by segment above in the section on the business model. On average, the Turnover in the last five years by 23.7 percent p.a.. an.
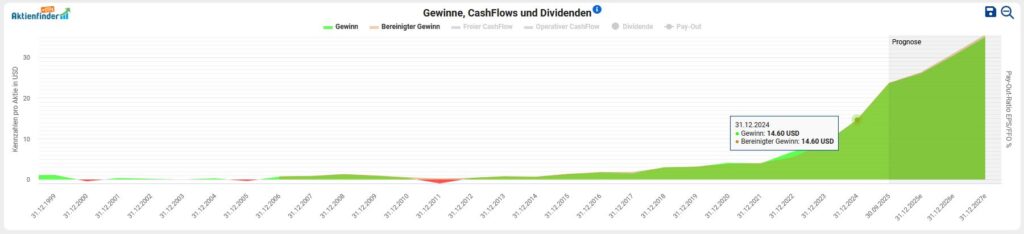
At Earnings per share we have seen an upward trend for ten years. If we look at the past financial year 2024, adjusted earnings per share fell by an impressive 62% (USD 9.01 vs. USD 14.60). In the past financial year, Comfort Systems USA generated a Net profit of USD 4.5 billion.
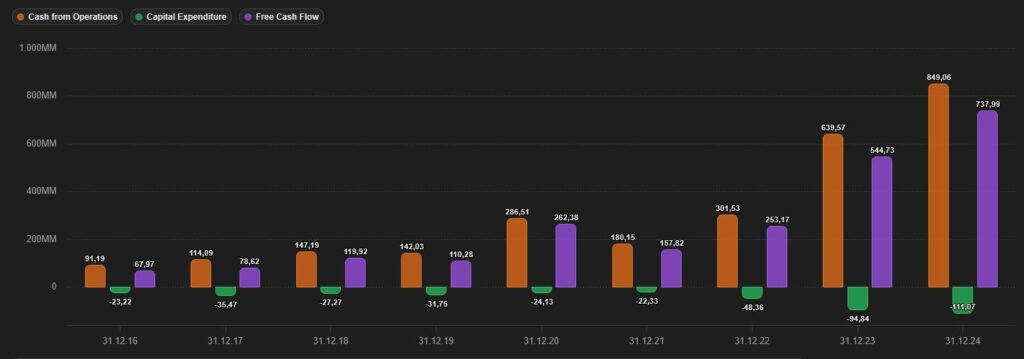
The amount available to the company Free Cash-Flow can be used for capital investments in organic growth, research and development, repayment of debt, expansion via company acquisitions, distributions of (increasing) dividends or share buybacks. In absolute figures - which I primarily like to use - the picture of operating and free cash flow as well as capital investments (CapEx) for the period 2016 to 2024 is as follows:
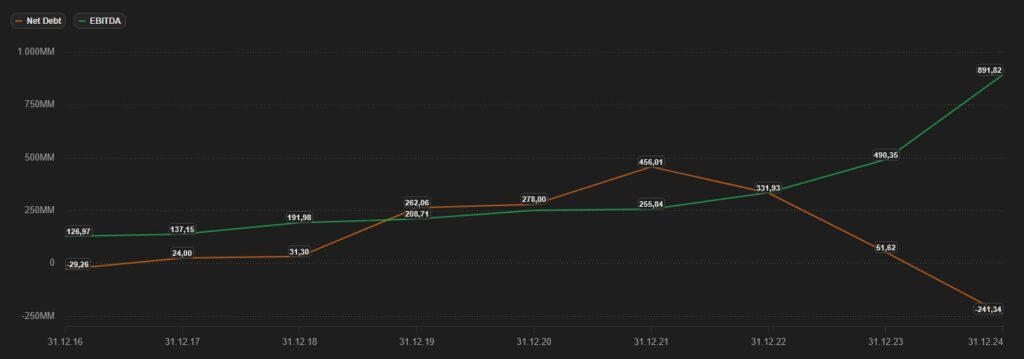
A look at the Debt situation shows us that, based on the last financial year, Comfort Systems USA has interest-bearing financial liabilities of USD 0.31 billion, which in turn is offset by cash and cash equivalents and securities totaling USD 0.55 billion. It doesn't take a math genius to realize that Comfort Systems USA is free of any net debt and therefore has a formidable balance sheet.
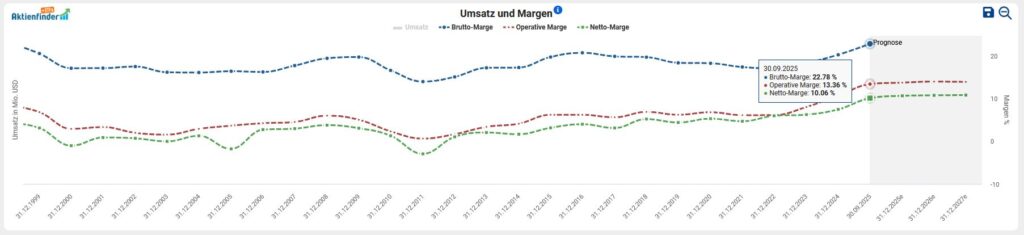
Finally, we look at the Profitability of Comfort Systems USA based on the development of gross, operating and net margins. The constant development in recent years underpins the margin strength of Comfort Systems USA compared to its competitors. Within the last five years, the management has managed to more than double the net margin.
Opportunities & risks
The main opportunities for Comfort Systems USA lie in the combination of structural growth in the end markets, a business model with established market entry barriers and a very solid balance sheet, while the key risks result from the cyclical nature of large-volume construction projects, the high exposure to tech/data center investments and execution and integration risks in the M&A-driven model.
Comfort Systems is currently benefiting from a record-high order backlog, which provides good visibility for sales and capacity utilization over several years. A certain amount of pricing power for complex projects cannot be denied. Structural drivers such as ageing commercial building stock, energy efficiency requirements, reshoring of industrial production and a massive expansion of data centers and semiconductor factories play directly into Comfort Systems' hands, as the company specializes in sophisticated MEP solutions for precisely these customers. Added to this is a very high return on invested capital (ROIC) track record, which is well above the industry average, and a net cash position that gives the management scope for further value-enhancing acquisitions and organic growth.
On the other hand, there are several risks that arise primarily from the nature of the business model. Comfort Systems USA is heavily dependent on the construction cycle outside of residential construction, meaning that a weakness in industrial and technology investments - for example as a result of economic downturns, higher interest rates or declining AI/data center investments - could significantly slow growth or lead to underutilization. The high concentration of the recent order boom on technology-driven projects (a steadily growing share of sales is attributable to data center and semiconductor customers) creates additional tailwinds, but also increases the cluster risk if this specific investment cycle turns earlier or more sharply than expected.
Operationally, there are also classic operational risks such as large fixed-price contracts: Cost overruns, project delays or miscalculations, which can quickly erode margins, particularly in the case of very complex large-scale projects. In addition, the business model is characterized by a high use of personnel and subcontractors, which means that shortages of skilled workers, rising wage costs or problems in the supply chain can have a negative impact on profitability. Finally, the continued roll-up approach harbors inherent integration risks - such as system integration or loss of local key personnel - even though Comfort Systems USA has historically demonstrated above-average M&A implementation.
Current valuation of the Comfort Systems USA share
For the valuation of companies, I use the so-called Enterprise Value (EV) is used. In the case of a takeover, the EV indicates the amount required to purchase the assets required for operations and excludes the non-operating assets. I relate this key figure to operating profitability (before interest, taxes and investments (CAPEX)), expressed as EBITDA. The prevailing opinion is that a value of less than 10 indicates a „healthy valuation“ - as is always the case with generic Rules of thumb the company-specific context must be considered in the analysis by the careful investor himself. In the case of Comfort Systems USA, we have to consider a more favorable valuation based on the Result of 27.4 not far behind, as the multiple fell to almost 10 in April of this year:
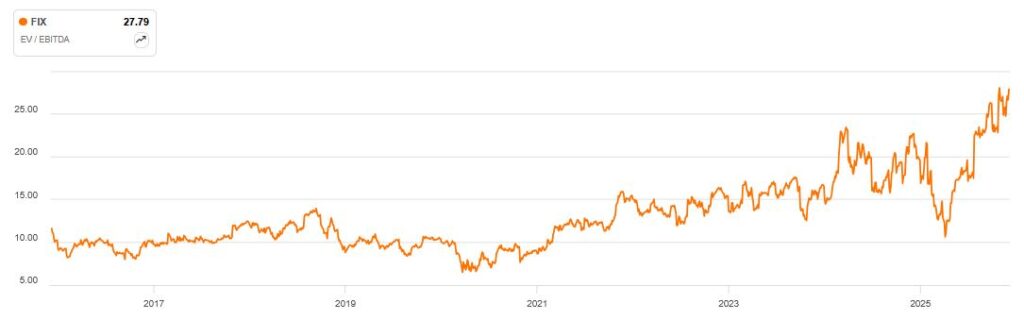
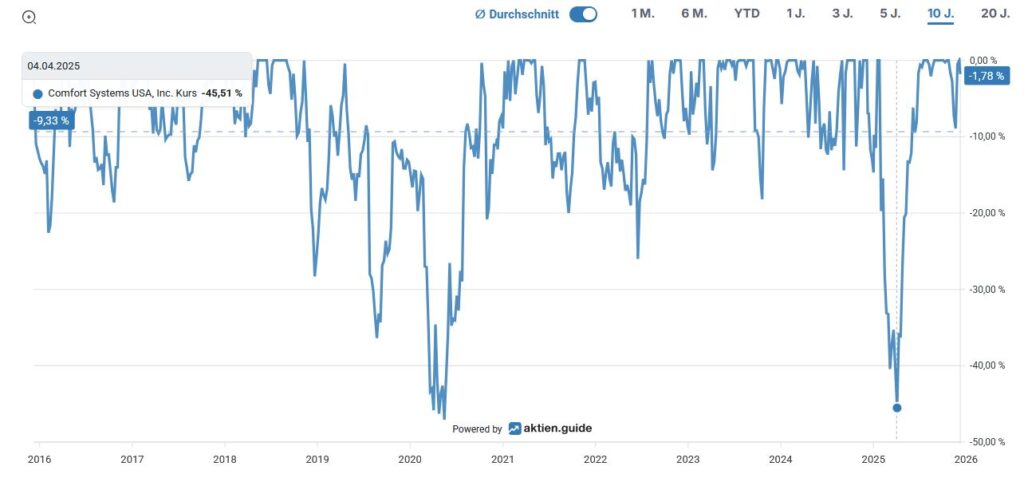
The Maximum decrease in the last ten years amounted to approx. 45 percent in the course of the tariff conflict initiated by the US administration in April 2025:
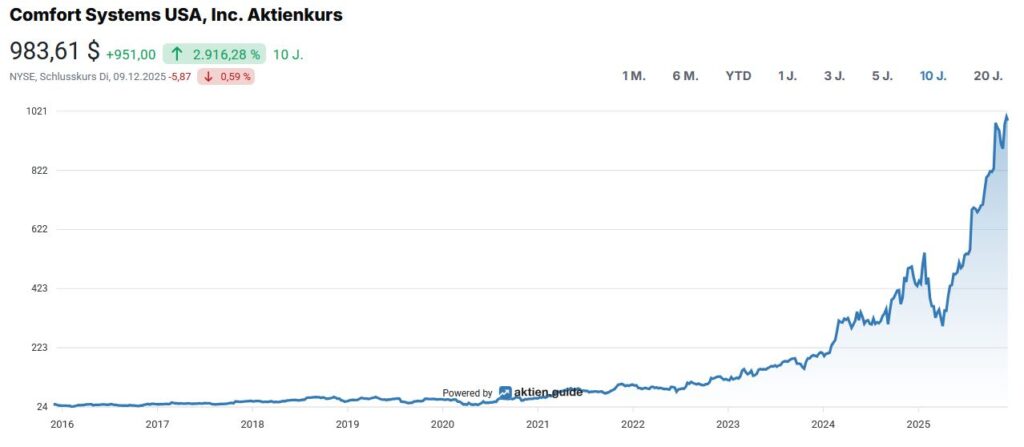
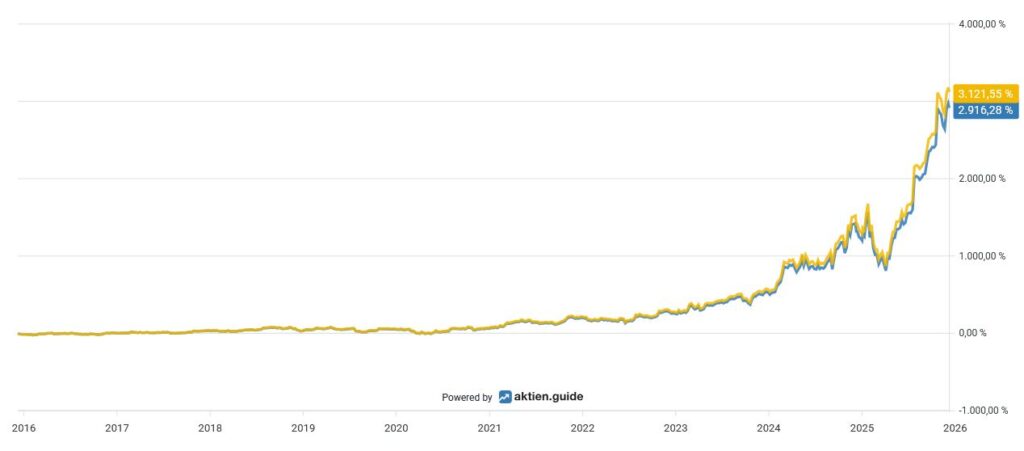
Over the past ten years, an investment in FIX, measured by the Total Return, including dividends received, a Overall performance from over 3,100 percent for the investor:
Capital allocation of Comfort Systems USA
Since meanwhile 13 years FIX pays an annually increasing dividend to its shareholders. The US company is therefore a dividend contender that has been increasing its payout every year for at least ten years.
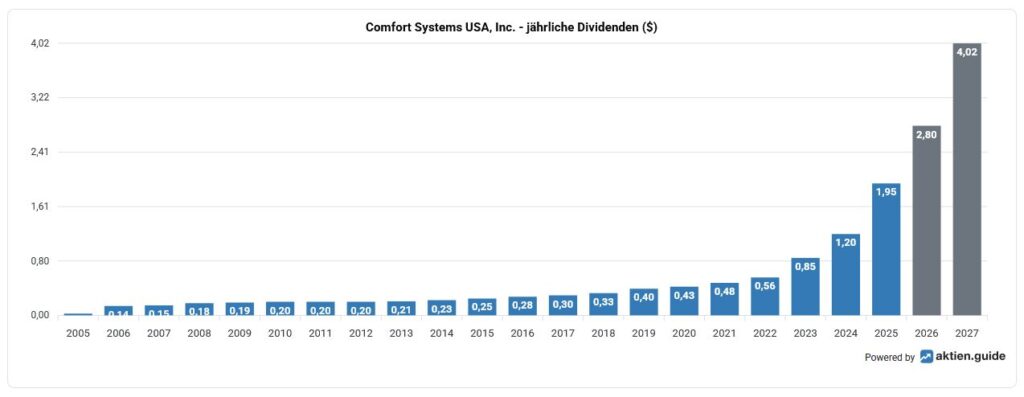
At the current share price of USD 983.61, this results in a Dividend yield of 0.24 percent. Die Fünfjahres-Dividendenwachstumsrate amounts to 24.9 percent p.a. or 18.2 percent p.a. in the Ten-year period. The company last increased its dividend by 20 percent this October. To round things off, here is an overview of the last few years of dividend increases:
- 2024: +40,0 %
- 2023: +66,7 %
- 2022: +15,4 %
- 2021: +18,2 %
- 2020: +10,0 %
The quartalsweise ausgeschüttete Dividende currently amounts to USD 0.60 per share and is paid out at the beginning of each quarter (May, August, November) with the exception of March.
If we take the average value of the Free cash flow of the last three years as the basis for determining the payout ratio, we end up with an extremely comfortable result of 6.5 percent for the payout ratio of FIX.
The Number of shares outstanding decreased overall by 6 percent in the past ten years.
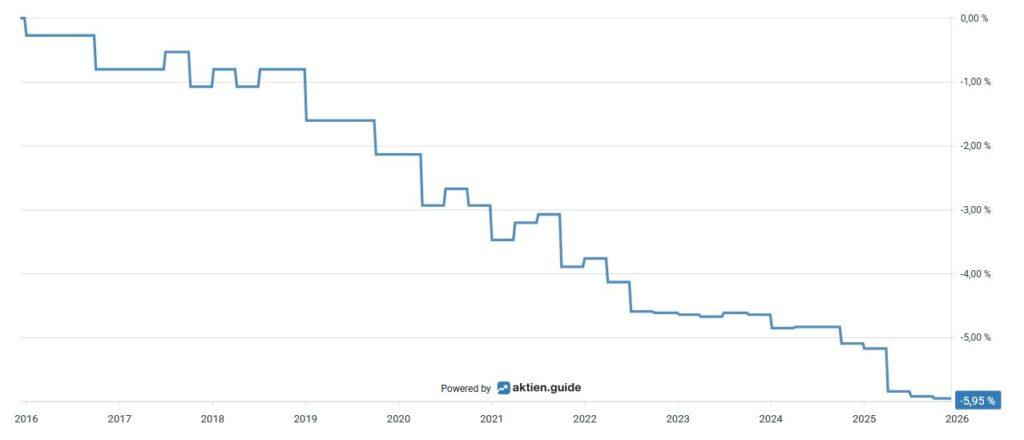
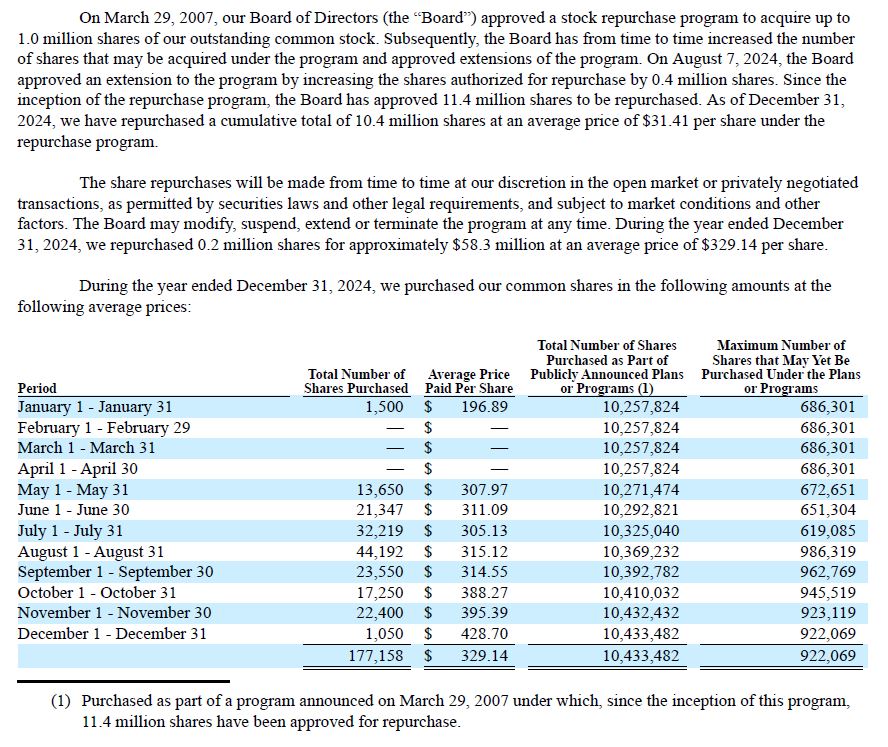
The current Aktienrückkaufprogramm grants the management the power to buy back a total of 0.4 million treasury shares, which will be used opportunistically if one considers the buybacks in 2024:
Conclusion: Considerations for my decision to invest in Comfort Systems USA
Comfort Systems USA builds the physical infrastructure of the digital and industrial economy: the air systems, cabling and cooling systems that keep factories, hospitals and data centers up and running. This may not sound particularly exciting, but it is powerful and highly profitable. What's more, the company's dominance in HVAC, electrical and plumbing, backed by an order backlog of over nine billion US dollars and AI-driven efficiencies, makes it a long-term beneficiary of this trend.
The share is no longer a bargain. From a fundamental perspective, the overall picture fits: the order backlog is high, margins are rising and the coffers are full. The company is emphatically shareholder-friendly and pursues a disciplined capital allocation. For investors with a long-term horizon, Comfort Systems USA offers remarkable growth potential. The dividend yield of less than one percent will not excite income investors, but the dividend growth rate and the excellent balance sheet give us confidence that we are dealing with a long-term compounder that has so far delivered an impressive performance in the model portfolio.

