



The most important in a nutshell
- Roper Technologies focuses on vertical niches and is one of the larger software providers in the USA. It is characterized by a high proportion of recurring revenues and a business model with a very low need for capital investment
- The company has established itself as a dominant player in predominantly regulated markets, with strong pricing power, long-term customer loyalty and low competitive pressure in oligopoly-like niches
- As a serial acquirer, Roper prioritizes deals in high-margin technology-industrial hybrids. The holding company invests in specialized technology companies in niche markets with a strong moat, ample cash flow margins and organic growth potential
- The dividend aristocrat has been paying its shareholders an annually increasing dividend for 33 years. In addition, management has USD 3 billion at its disposal for opportunistic share buybacks
- Click here for the DGI model portfolio and here to the overview of this series The dividend custody account
Company profile and business model: Who is Roper Technologies and what does it do?
1890 marks a turning point in world history: In Europe, Bismarck's era ends with his dismissal as Prussian Prime Minister, which permanently shifts the balance of power before the First World War. Meanwhile, in the United States, the industrial economy is growing rapidly, new states such as Idaho and Wyoming join the Union and the Sherman Antitrust Act marks the beginning of the era of modern competition regulation. It was in this environment of technological progress, industrialization and reorganizing superpowers that the company that would later become Roper Technologies was founded.
The history of Roper begins in 1890 with George Denny Roper, who initially acted as co-owner of the Van Wie Gas Stove Company in Cleveland, Ohio, enters the gas stove and household appliance business. The relocation of the factory to Rockford, Illinois, the fiduciary administration due to the debt situation in the early 1890s and finally Roper's takeover of all shares mark the phase in which a small stove manufacturer develops into an independent industrial company. Just ten days after the debt settlement in September 1894, a major fire destroyed the factory, but Roper, who had lost his left arm as a child, had the factory rebuilt and reopened under the name of Eclipse Gas Stove Company new ones.
In the first half of the 20th century, the company expanded its industrial base: in 1906, the acquisition of the Trahern Pump Company, which had existed since 1857, added an established pump business, expanding the portfolio from stoves to pumps and other industrial products. Over the decades, Roper developed into a typical, broad-based industrial group in the US economy, producing household appliances, pumps and other technical components for the booming oil industry and increasingly acting as a supplier for the mass market. During the Second World War, the industrial group earned its money by manufacturing pumps for naval ships. In 1957, Roper sold the stove business to the Florence Stove Company; The remaining company is thus focusing on pumps and will henceforth operate as Roper Pump Company.
The 1960s and 1970s were characterized by further diversification: Roper entered the outdoor and garden machinery business and further expanded its pump and component portfolio, consolidating its position as a diversified industrial manufacturer. From the Initial public offering in 1992 was followed by a series of acquisitions that shifted the Group more towards specialized measurement, control and monitoring technology and transformed it from a traditional household appliance manufacturer, whose associated product divisions were sold to Whirlpool and Electrolux, into a technology-driven industrial group.
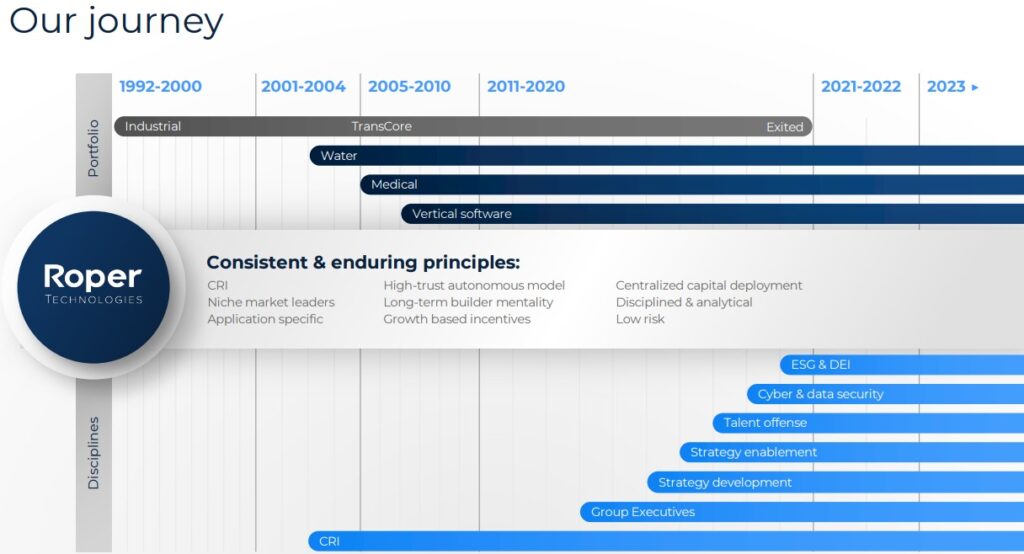
From the 2000s onwards, the decisive strategic shift took place. CEO Brian Jellison Roper is consistently focusing its portfolio on high-margin, asset-light business models and shifting its focus from hardware-heavy industrial products to vertically specialized application and network software as well as technology-based products. This change is supported by a disciplined M&A strategy that targets niche market leaders with high recurring revenues and low capital requirements, thereby sharpening Roper's profile as a cash-flow-strong, decentrally managed technology group. In 2015, the change of name from Roper Industries to Roper Technologies reflects this de facto repositioning.
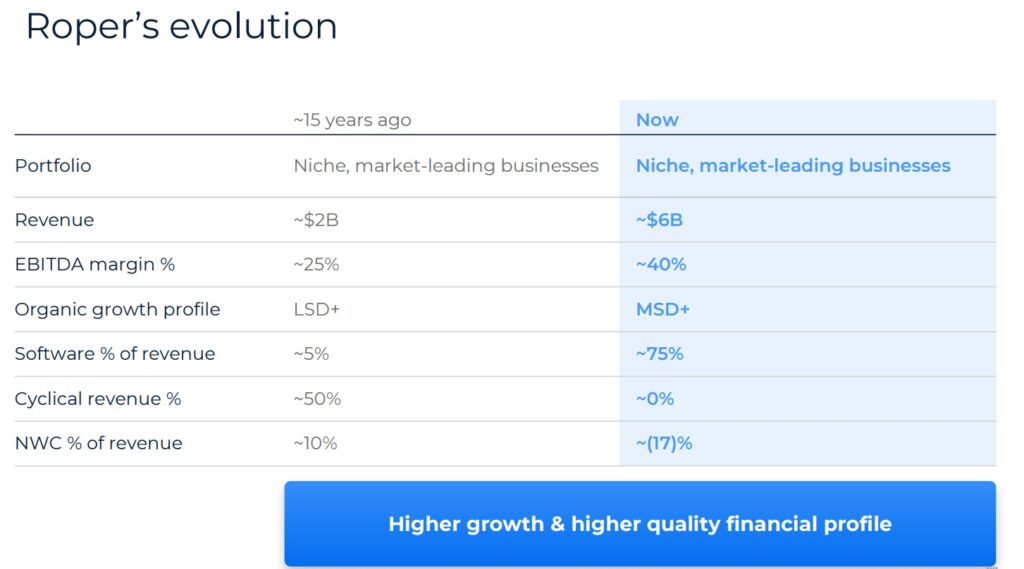
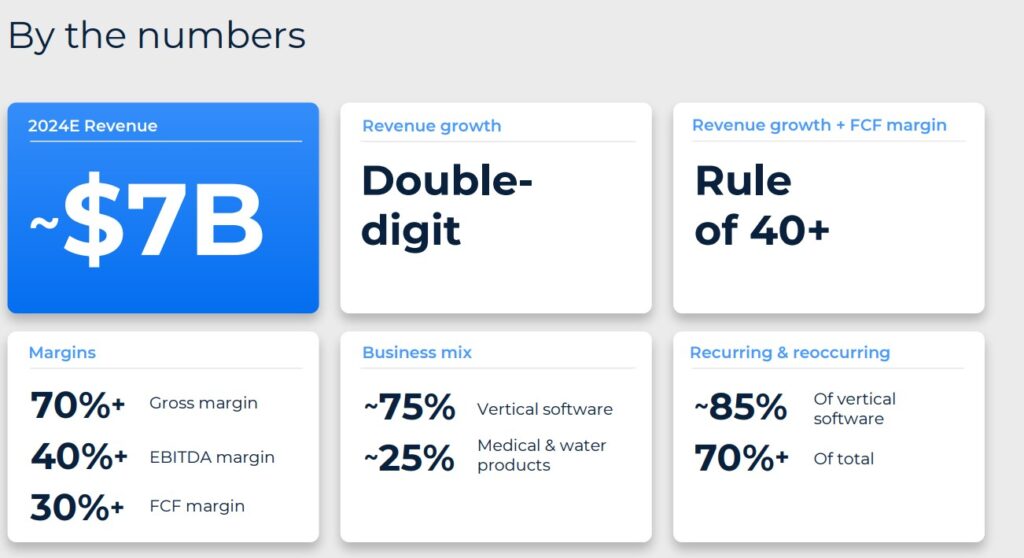
Today, the company bundles a portfolio of technology-supported business models with a focus on vertical niches and is one of the larger software providers in the USA, while its industrial history from its founding in 1890 remains visible only as the origin of a transformation path that has spanned more than a century.
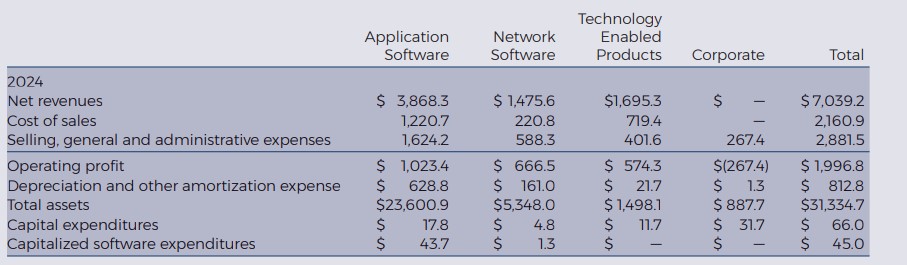
Im Zentrum des Geschäftsmodells is a decentralized, capital-light operating model that is divided into three segments serving highly specialized, largely uncorrelated, so-called „mission-critical“ niche markets:
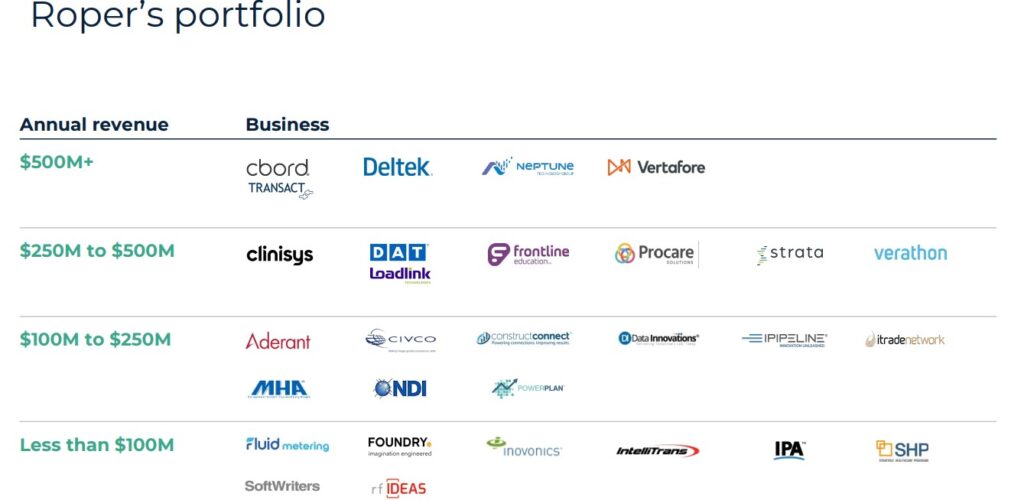
- Application Software (share of sales: 55%): This segment primarily serves medium-sized to large companies and institutions in highly regulated, workflow-intensive industries with ERP- and management software. The main customer profiles include insurance agencies and brokers (Vertafore), law firms and law firm networks (Aderant), government contractors and project-based service providers (Deltek), leasing and asset financiers (PowerPlan), hospitals, laboratories and diagnostics providers (CliniSys, Data Innovations, Strata: LIS and Imaging Workflows), K-12 schools and kindergartens (Frontline Education, Procare Solutions) as well as universities and campus operators (Transact, CBORD
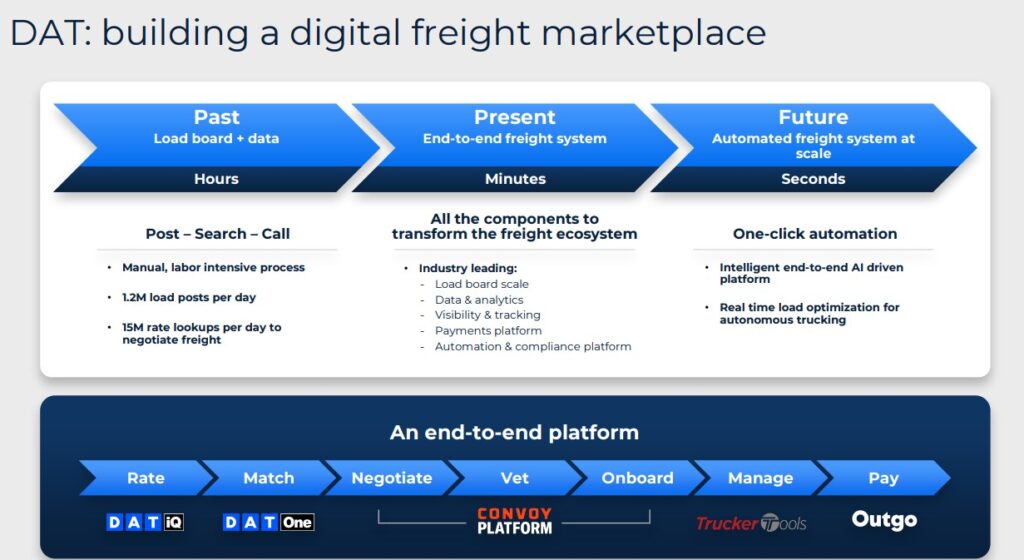
- Network Software (share of sales: 21%): Products from this segment are used most by the building/construction (ConstructConnect) and logistics/transportation (DAT) sectors, which together drive the majority of growth. These are complemented by food supply chain monitoring (iTradeNetwork), insurance distribution (iPipeline), media agencies (Foundry), pharmaceutical logistics (MHA, SHP), pharmacy software (SoftWriters) and the non-profit sector (Subsplash)
- Technology Enabled Products (share of sales: 24%): Hardware-related products in healthcare and infrastructure: medical ultrasound/endoscopy (Verathon, CIVCO Medical Solutions), water measurement systems/fluid control (Neptune, FMI), medical technology/robotics (Northern Digital), access/entry control (rf IDEAS), wireless paging (Inovonics) and hospital infrastructure (IPA)
By far the most important single country is the United States, which contributed around USD 6 billion in sales in the past financial year, accounting for over 85% of Group sales. The remainder is mainly distributed between Canada (4 percent) and Europe (7 percent).

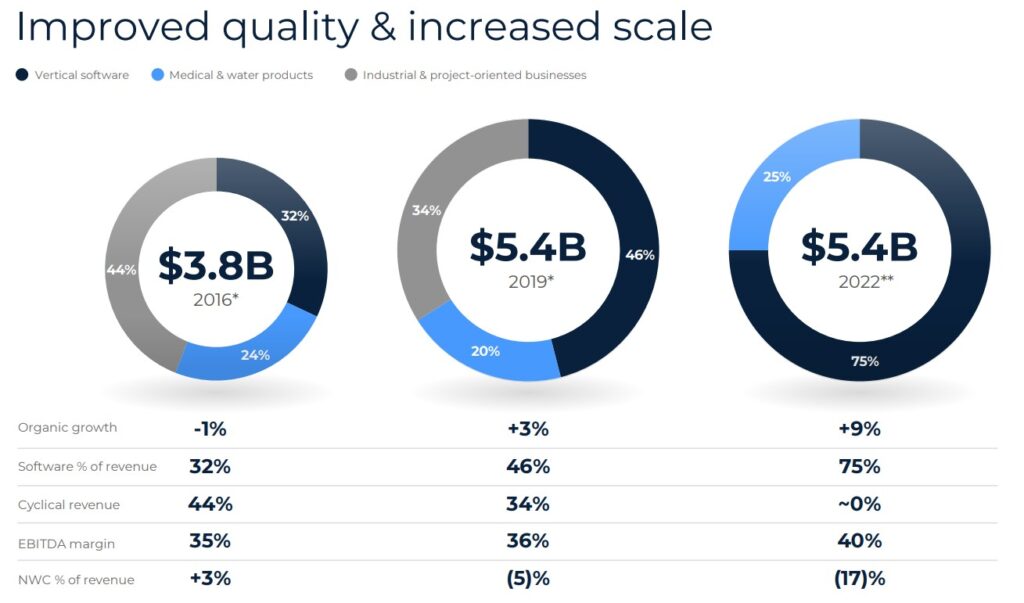
The transformation of Roper Technologies from a diversified industrial group to a vertical software investment holding company was achieved under former CEO Brian Jellison (2001-2018), previously a manager at General Electric and Ingersoll-Rand, through a disciplined M&A strategy that began in 2008 with CBORD - Roper's first pure-play software deal for campus card systems. In parallel, Roper reduced its exposure to the industrial sector through numerous divestments in order to divest CapEx-intensive, cyclically sensitive units (e.g. oil/gas-dependent pumps) in favor of asset-light software. The sale of TransCore (USD 2.7 billion) and the majority stake in Indicor to CD&R (USD 2.6 billion), both of which were completed in 2022, are representative of the strategic realignment. This also freed up the necessary capital for new acquisitions.
One positive and deliberate consequence of this transformation is that the proportion of Recurring revenues (subscriptions, maintenance contracts, network fees) account for over 85% of software revenue. In the Application Software segment, the share is almost 90% to 95%, as ERP and industry solutions are primarily subscription-based and have a high level of loyalty due to workflow integration. The Network Software segment has the highest share at over 95%, driven by network effects and user-based platform fees. In the Technology Enabled Products segment, the recurring share is around 60% to 70%, as hardware-related solutions are bundled with a subscription model and services are mixed with one-off sales.
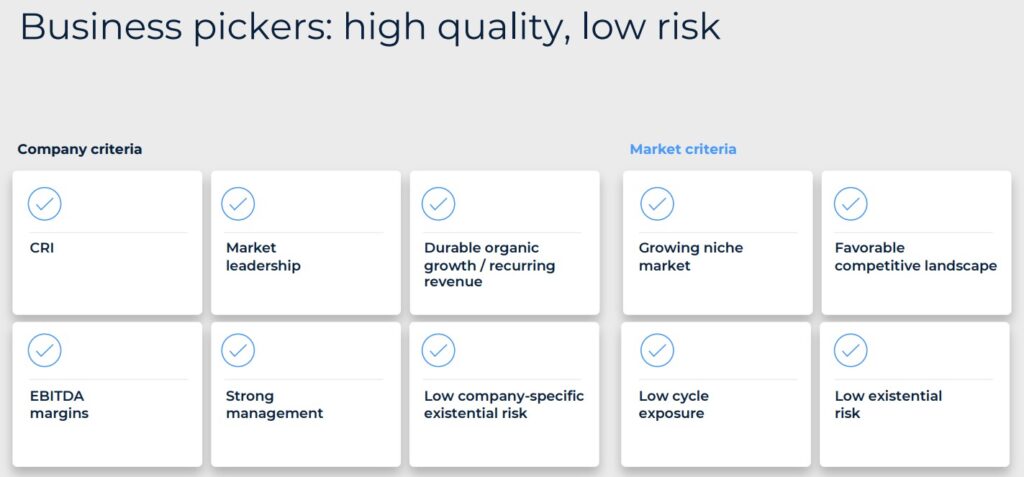
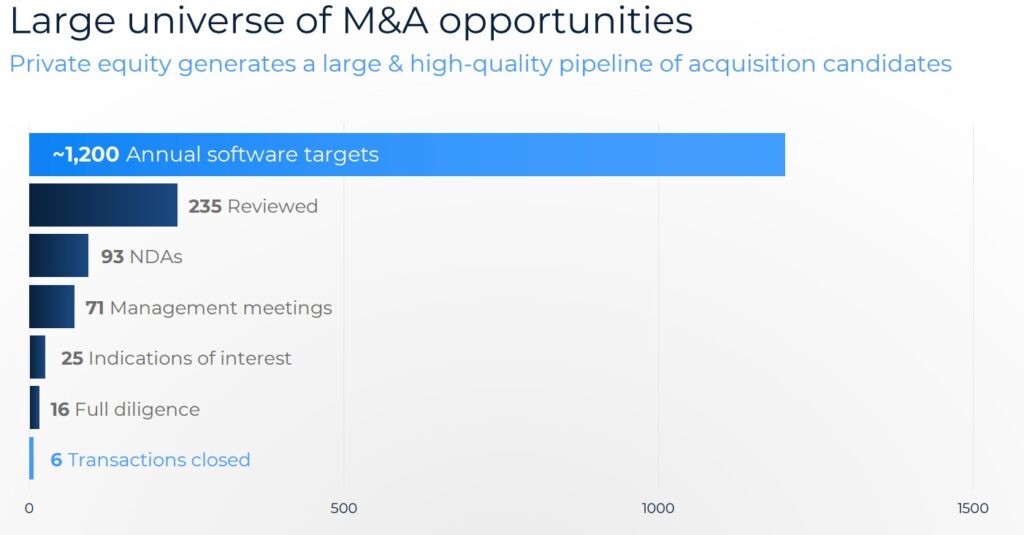
Roper Technologies pursues a centrally managed serial acquirer strategy, which has been codified as a clear playbook since Jellison and will be continued under his successor Neil Hunn. The holding company identifies asset-light, vertically specialized software and tech companies in niche markets with high recurring revenues, strong moats (network effects, regulation, switching costs), EBITDA margins (>25 percent) and organic growth potential, whereby the acquisition targets typically have an enterprise value of USD 1 to 5 billion and must meet an internal rate of return on capital of 10 to 15 percent. In contrast to opportunistic acquisitions, the pipeline is systematically built up via private equity partners, investment banks, etc., with a focus on private deals to avoid competition.
Compared to its past as a classic industrial conglomerate, Roper today differs in the absence of physical assets, cyclical fluctuations in capacity utilization and high CapEx. Instead, the company scales via software with stable demand. Compared to horizontal software peers (e.g. Salesforce, ServiceNow), Roper lacks broad market coverage, but compensates by vertical positioning with high pricing power, long-term customer loyalty and less competitive pressure in oligopoly niches. Other serial acquirers such as Constellation Software prioritize smaller, countless micro-targets with a focus on technology, while Roper pursues larger deals (often > USD 1 bn) in technology-industrial hybrids with high margins.
The Corporate culture of Roper Technologies is strongly characterized by decentralization, entrepreneurship and capital discipline and thus differs significantly from traditional corporations. The company operates "hub-and-spoke" governance as an investment company in which the lean holding company exclusively handles strategic acquisitions, FCF distribution and capital allocation and portfolio monitoring. At its core, Roper combines a „high trust, high accountability“ culture at operating unit level with a very sober, numbers-driven approach at holding company level.
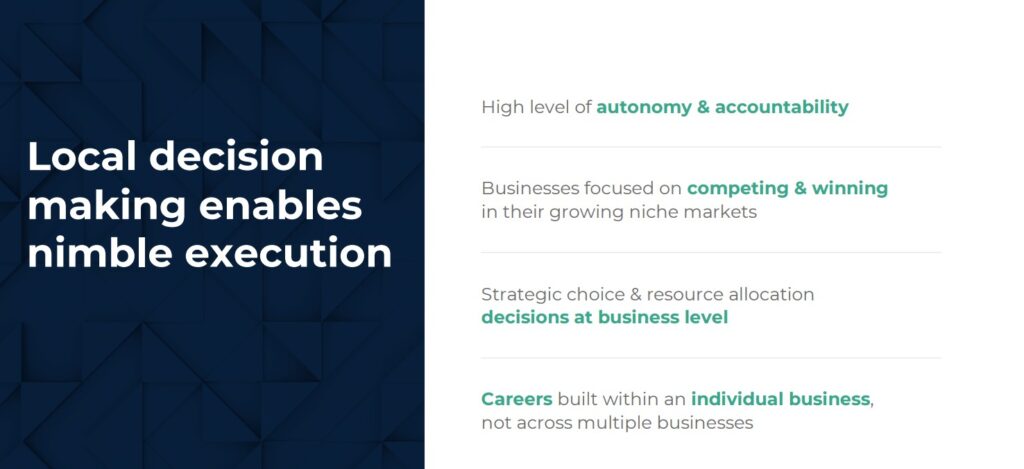
The first characteristic is the high degree of entrepreneurial autonomy: the 29 business units operate largely independently, retain their brands, structures and management teams and are not forced into a centralized „one roper“ operating system. However, this freedom is linked to clear expectations - in particular sustainable EBITDA and cash flow growth, high returns on capital and the maintenance of strong niche positions. Variable remuneration is strongly growth- and performance-based, which creates a pronounced responsibility for results at business unit level.
In addition, there is a culture of long-term thinking and „non-intervention“: Roper expressly does not see itself as a turnaround or synergy machine, but as a long-term owner that holds successful niche businesses for decades instead of turning them around after a short time. The central organization provides support through capital allocation, best-practice exchange and, more recently, AI expertise, but does not intervene operationally in customer relationships or product roadmaps - which is considered an important cultural advantage when it comes to acquisition targets.
In addition to this core M&A expertise, we have now arrived at an important growth driver. Artificial intelligence plays a central role in Roper Technologies' sales growth. Over 25 GenAI products are already in operation or under development as catalysts for organic growth (from the current 6% to >10%) by expanding the overall market potential.
AI is integrated into existing software platforms in a decentralized manner and depending on the workflow. Roper primarily uses proprietary domain data, historical workflow and customer data from its vertical software platforms as core sources for AI models and agentic AI solutions, supplemented by structured transaction data and compliance logs. Each operational unit develops AI features internally, with centralized support from Leadership-capacities. These internal, non-public datasets (no external LLMs such as ChatGPT) enable regulatory-compliant models and represent a clear competitive advantage in niche markets, as Roper's „system-of-record status“ provides exclusive training data that is not publicly available.
In 2018, the company took over Neil Hunn the role of Chief Executive Officer and member of the Board of Directors of Roper Technologies. Neil Hunn's career has been characterized by a clear thread of experience in the finance and software industries and then internally at Roper. After earning a bachelor's degree in Finance & Accounting from Miami University and an MBA from Harvard Business School, he worked in consulting (Parthenon Group) and corporate development/internet investments (CMGI) before joining MedAssets, a healthcare SaaS provider, in 2001, where he held various leadership roles (including Chief Financial Officer) and was responsible for the preparation of the IPO and several M&A transactions. In 2011, Hunn joined Roper as Group Vice President in the Medical segment, where he drove the growth of the medtech and software platforms. In 2017, Hunn was appointed Executive Vice President & Chief Operating Officer. Hunn holds almost 190,000 shares in his employer.
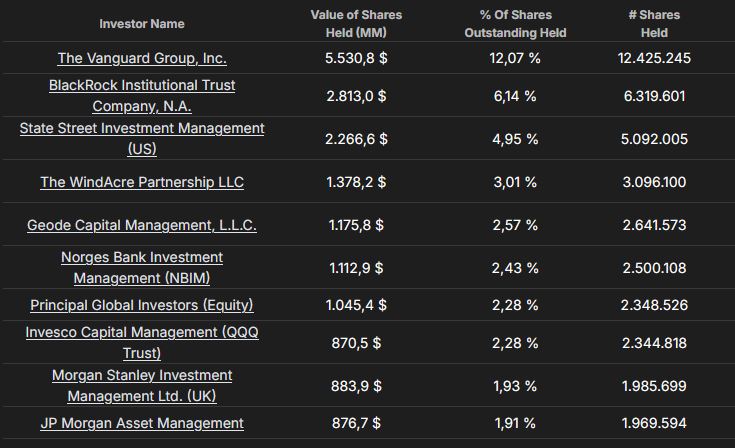
Institutional investors clearly dominate on the ownership side: over 93% of the outstanding shares are held by funds and other institutions, with addresses such as BlackRock, Vanguard, State Street and the Norwegian sovereign wealth fund among the largest shareholders.
Industry profile and competitive situation
As a vertical software and technology serial acquirer, Roper Technologies has such a specific business model that a classic peer group comparison based on standard key figures is only of limited value for several reasons and would tend to be misleading. Firstly, Roper combines a historically grown industrial base with a currently dominant portfolio of highly specialized niche software platforms, which differs significantly from „pure“ software groups both in terms of the end markets addressed (healthcare, insurance, education, public sector, niche industries) and the revenue logic (high proportion of recurring revenues, very low capital intensity, decentralized management).
Even the definition of a meaningful peer group is problematic because there are hardly any listed companies that simultaneously exhibit a similar diversification across heterogeneous vertical niches, a comparably high serial acquisition share of growth and a similarly pronounced asset-light cash flow logic; even obvious candidates such as Constellation Software, OpenText or Halma clearly differ either in the sector mix, the ticket size of the acquisitions or in the governance architecture.
In addition, Roper's key value drivers - such as the quality and depth of its niche positioning, pricing power in regulated areas, integration philosophy (highly decentralized autonomy of the operating units) and disciplined capital allocation with a focus on free cash flow - cannot be adequately reflected in standard KPI screens and only become apparent in the longitudinal section over several cycles. A purely quantitatively defined peer comparison would therefore level out structural peculiarities such as the exceptionally high free cash flow conversion with simultaneously low capital commitment, the combination of defensive „mission-critical“ software and selectively cyclical end markets as well as the long-term nature of the M&A playbook and falsely squeeze Roper into valuation or margin bands that are more likely to (falsely) apply to classic industrials or horizontal software providers.
For a well-founded assessment, it therefore seems more sensible to analyze Roper primarily as an independent compounder case - with selective references to other serial acquirers for a qualitative classification of the strategy - instead of attempting to construct a formal peer group, which in any case only insufficiently does justice to the idiosyncratic profile of the company.
The financial situation of Roper Technologies
After providing an overview of the industry in general and taking a closer look at the company, the management and the competition, I will take a look at the balance sheet and the key financial figures of Roper Technologies derived from it. The focus here is on the following aspects Growth, profitability and Financing.
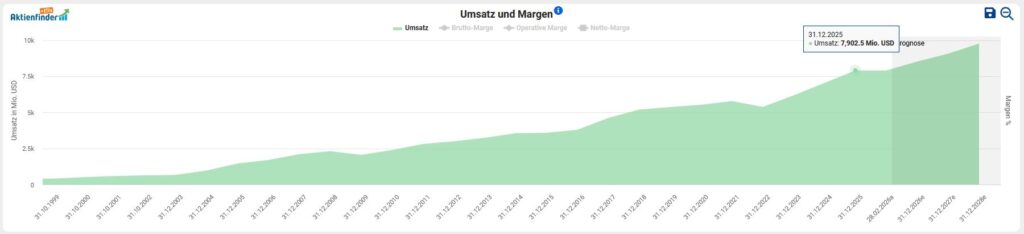
To analyze the financial situation, the first step is to look at the development of sales, profit and free cash flow. I have already discussed the internal distribution of sales by segment above in the chapter on the business model. On average, the Turnover in the last five years by 7.8 percent p.a.. an.
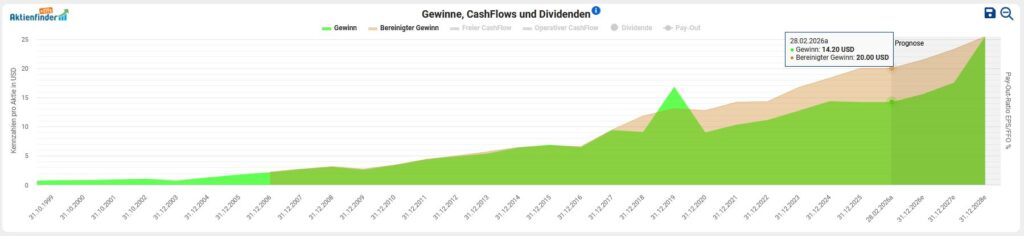
At Earnings per share we have seen an upward trend for ten years. If we look at the past financial year 2025, adjusted earnings per share rose by 9.8% (USD 20 vs. USD 18.21). In the past financial year, Roper Technologies generated a Net profit of USD 1.5 billion.
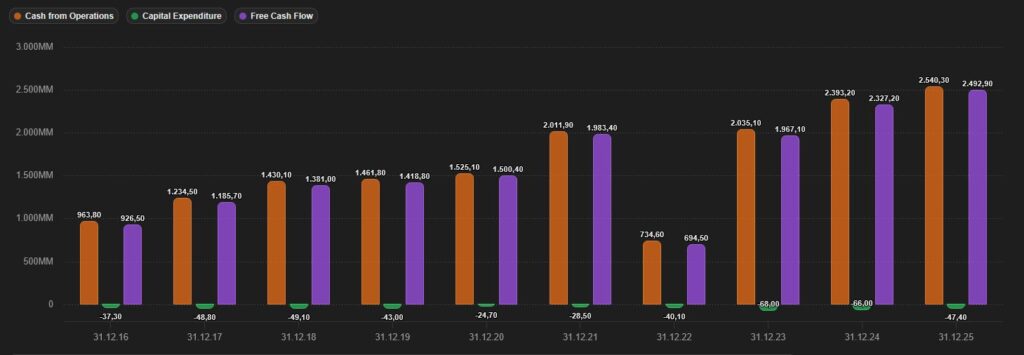
The amount available to the company Free Cashflow can be used for capital investments in organic growth, research and development, repayment of debt, expansion through company acquisitions, distributions of (increasing) dividends or share buybacks. In absolute figures - which I primarily like to use - the picture of operating cash flow, free cash flow and virtually non-existent capital expenditure (CapEx) for the period 2016 to 2025 is as follows:
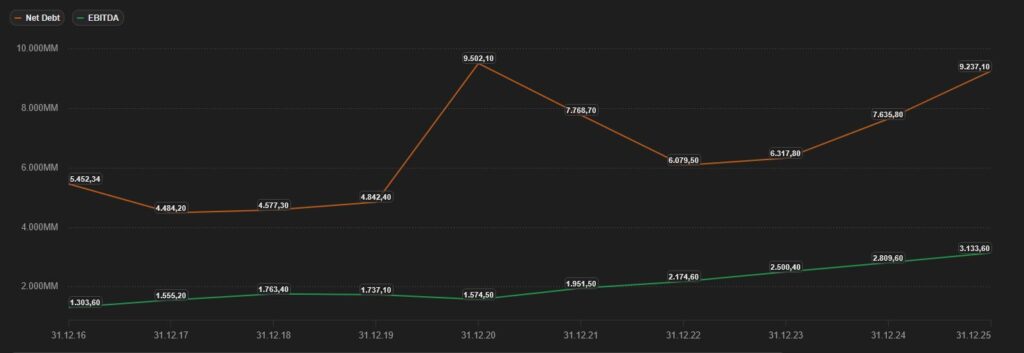
A critical look at the Debt situation shows that interest-bearing financial liabilities amount to USD 9.5 billion, which are offset by cash and cash equivalents and securities of USD 0.3 billion at the end of the 2025 financial year. This results in net debt of USD 9.2 billion. In relation to EBITDA of USD 3.1 billion, this results in a ratio of 3. This industry-dependent value is right on the critical threshold of 3. However, Roper has distinguished itself in the past with its rigid debt management.
Around the topic Indebtedness and External financing complete, it makes sense to look at the Interest profile and the Maturity structure of current liabilities. Finally, it is important to assess how vulnerable the company is to rising key interest rates and the extent to which refinancing or rescheduling of existing debt is due in the near future. The cumulative maturities of non-current liabilities total approximately USD 3.8 billion up to 2029. All non-current liabilities have fixed interest rates and are therefore not subject to any interest rate risk.
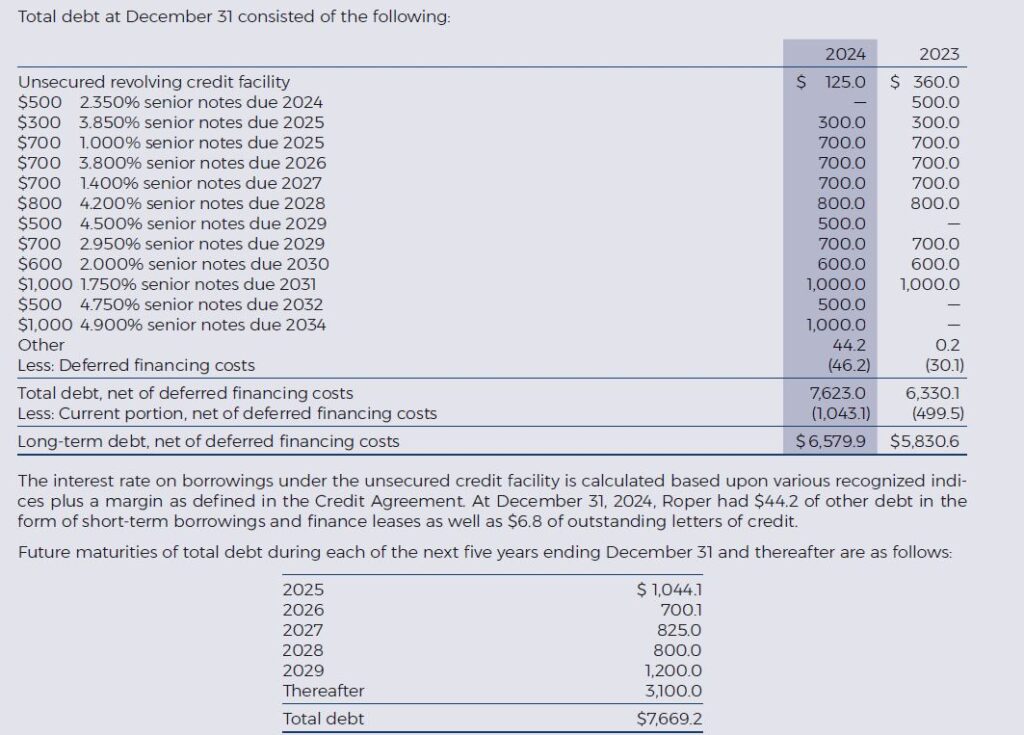
In January 2025, Standard & Poor's confirmed the Credit rating of the company with Investment grade BBB+.
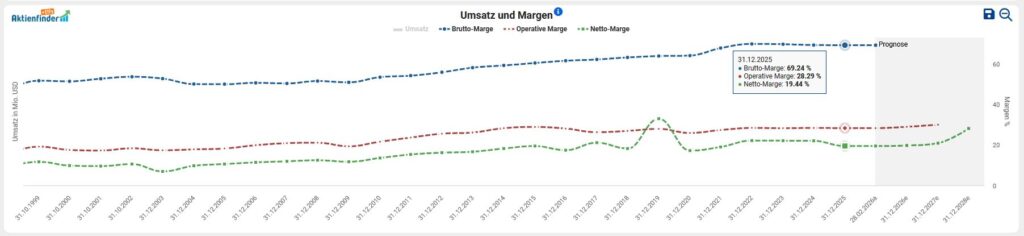
Finally, we look at the Profitability of Roper Technologies based on the development of gross, operating and net margins. The consistency in the profitability of the business model is evident from the gross margin to the operating margin. Thanks to the successful transformation of the business model, we can observe a significant improvement in profitability. Roper Technologies has succeeded in increasing its gross margin to a remarkable 70 percent.
Opportunities & risks
Roper Technologies presents itself as a company with an exceptionally well thought-out business model, but one that also presents structural challenges. The Group's strengths lie primarily in its capital-light structure and its strategic focus on recurring revenues. With a software revenue share of over 80% recurring revenue and a remarkably low capital intensity of just 1.5% of revenue, the company has established a highly profitable model. This positioning in „mission-critical" niche markets within regulated industries such as healthcare, education and insurance gives the Group a certain market power and pricing power.
Roper's M&A expertise is another key success factor. With over 60 acquisitions since 2000, the management has an impressive track record. The systematic approach is particularly noteworthy: Roper minimizes integration risks through a structured due diligence process, a clear requirement for returns above the cost of capital and the deliberate avoidance of turnarounds. The decentralized management of the acquired companies keeps integration costs low and maintains the operational flexibility of the individual units. The diversified earnings structure across various business areas and a broad customer base also protect against cluster risks.
The integration of artificial intelligence into the product range is a particularly promising growth driver. With over 25 generative AI products in operation or under development, Roper is aiming to increase organic growth from the current 6% to over 10%. The decisive competitive advantage lies in the proprietary domain data from the vertical software platforms, which serve as exclusive training sources for AI models and are difficult to replicate in niche markets.
However, these opportunities are offset by significant risks. The biggest structural problem is the increasing size of the company itself. With a market capitalization of just under USD 40 billion, it is becoming increasingly difficult for Roper to make value-enhancing acquisitions. While the company used to close deals in the hundreds of millions of USD, it is now moving into the billions. This not only limits the number of suitable targets, but also means that individual missteps are more difficult to compensate for with the existing portfolio. In addition, Roper is increasingly competing with private equity firms and other strategic buyers such as Constellation Software, which is driving up target valuations and could put pressure on return on invested capital (ROIC).
Goodwill has tripled in the last ten years and amounted to USD 21.3 billion at the end of the 2025 financial year. This represents a latent risk. Should individual business areas disappoint or the cost of capital increase, substantial impairments could become necessary, which would burden equity and worsen the debt ratios. At the same time, the high market valuation of the company itself poses a risk for investors. The expectations priced into the share price are high, and any disappointment in the implementation of the growth strategy could lead to a significant fall in the share price.
The competitive pressure in the software industry should also not be underestimated. Despite their niche positioning, the markets are characterized by short product cycles, technological innovation and new market players. Start-ups can challenge established providers with disruptive approaches. Added to this are cyber risks, which are particularly critical for a software-heavy portfolio. The increasing professionalism of cyber attacks could lead to financial losses, reputational damage and customer churn.
Current valuation of the Roper Technologies share
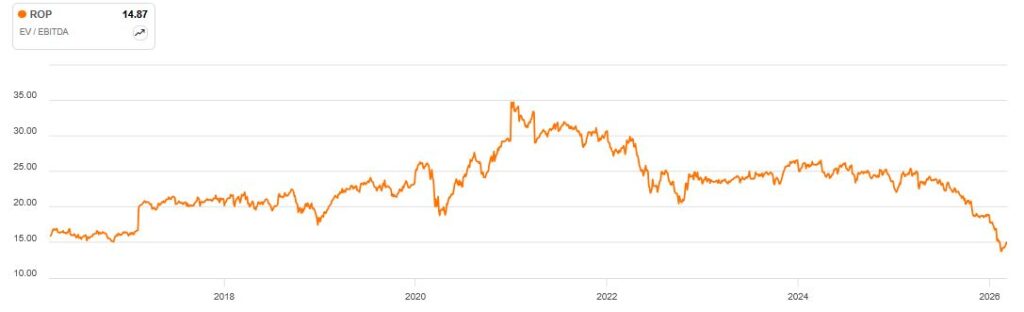
For the valuation of companies in the same industry, I use the so-called Enterprise Value (EV) is used. In the case of a takeover, the EV indicates the amount required to purchase the assets required for operations and excludes the non-operating assets. I relate this key figure to operating profitability (before taxes, interest and investments (CapEx)), expressed as EBITDA. The prevailing opinion is that a value of less than 10 indicates a „healthy“ valuation - as is always the case with generic Rules of thumb the company-specific context must be considered in the analysis by the careful investor himself. In the case of Roper Technologies, we see that a EV/EBITDA of 14.9 represents an extremely favorable buying opportunity in the context of the last five years.
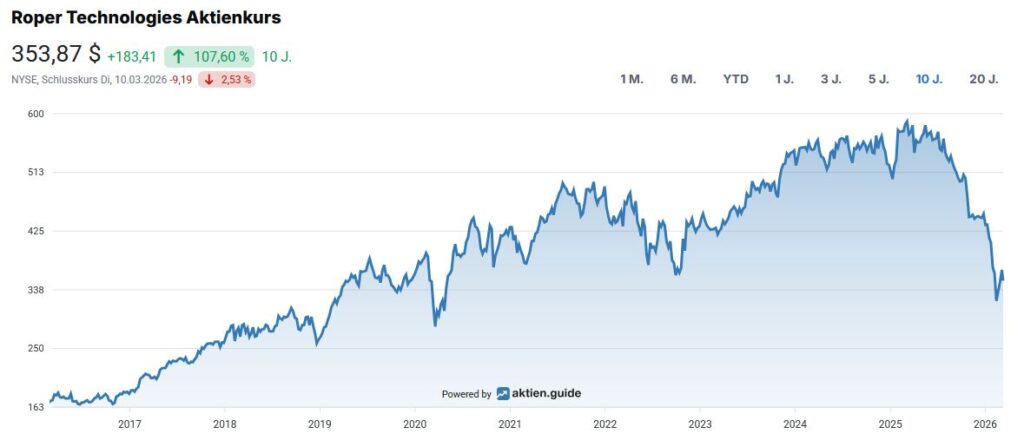
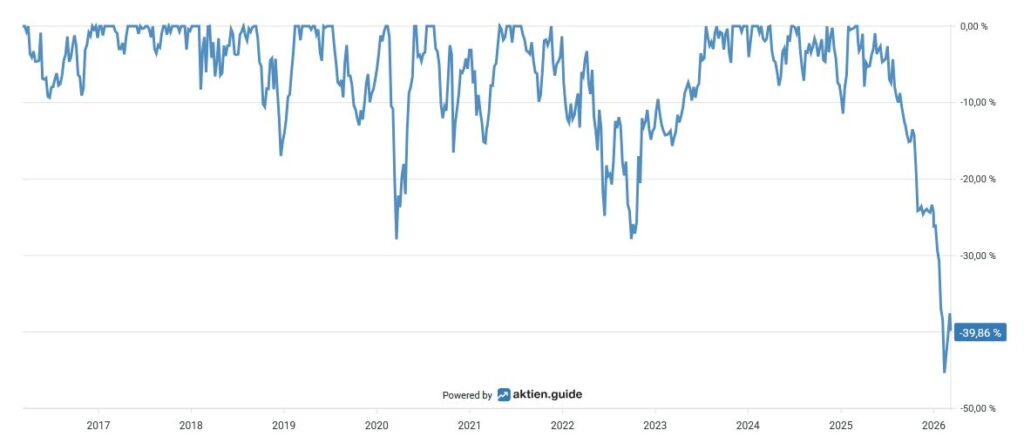
The Maximum decrease in the last ten years amounted to approx. 45 percent at the beginning of this year:
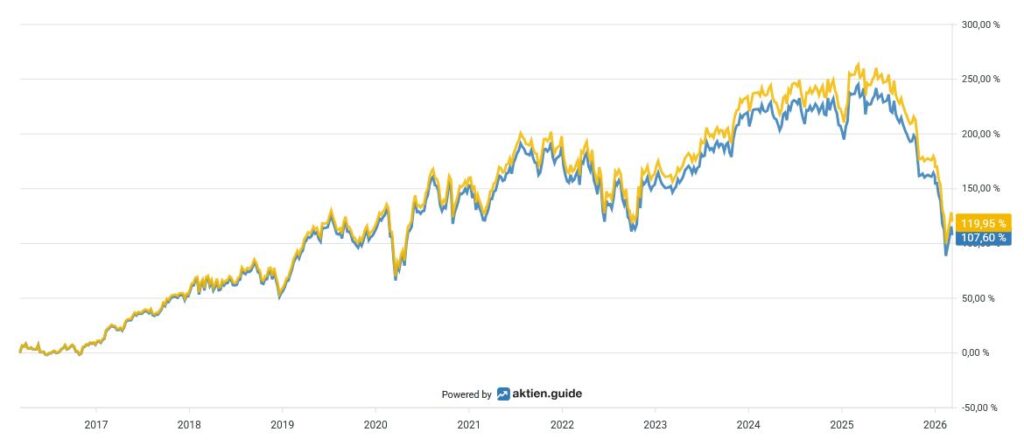
Over the last ten years, an investment in Roper has yielded Total Return, including dividends received, a Overall performance from over 120 percent for the investor:
Capital allocation of Roper Technologies
Bei der Betrachtung der Dividendenhistorie it is striking that Roper Technologies has a track record of 33 years continuously growing dividends. This puts the investment company in the select circle of dividend aristocrats that have increased their dividends for at least 25 years in a row.
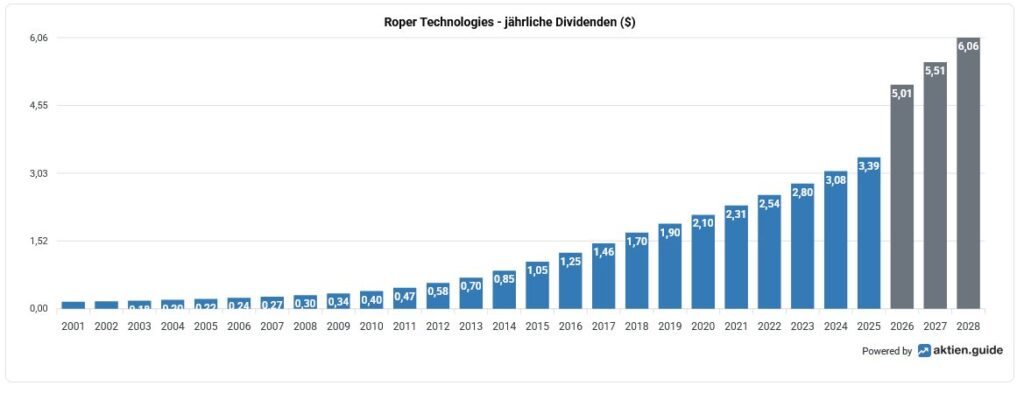
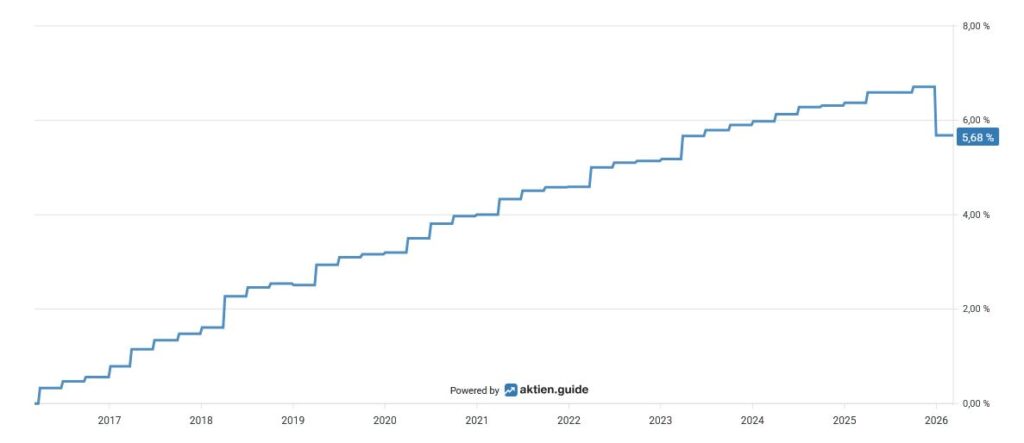
At the current share price of USD 353.87, this results in a Dividend yield from 1 percent. The Five-year dividend growth rate amounts to 10.2 percent p.a. or 14.1 percent p.a. in the Ten-year period. The company last increased its dividend in November 2025 by 10.3 percent. To round things off, here is an overview of the last five dividend increases:
- 2024: +10,0 %
- 2023: +9,9 %
- 2022: +10,1 %
- 2021: +10,2 %
- 2020: +9,8 %
The quartalsweise ausgeschüttete Dividende beträgt aktuell USD 0.91 per share and is paid out at the beginning of each quarter (January, April, July, October).
If we take the average value of the Free cash flows of the last three years to determine the Payout ratio Roper Technologies has a moderate payout ratio of 15.9 percent. In the coming years, I therefore see sufficient scope for dividend increases, at least in the high single-digit percentage range.
Over the past ten years, the number of Number of shares outstanding by a total of 5.7 percent, This is due to the remuneration of management with company shares (stock-based compensation).
For the first time in the company's recent history, the Board of Directors approved a Aktienrückkaufprogramm, which has a volume of USD 3 billion and is open-ended.
Conclusion: Considerations for my decision to invest in Roper Technologies
In my opinion, Roper Technologies is a high-quality investment with an exceptionally robust business model. The Group has successfully transformed itself from a traditional industrial company into one of the largest software providers in the USA and today combines a bundle of technology-based business models with a clear focus on vertical niche market leaders. The recipe for success is based on recurring revenues of over 80 percent in the software segment, minimal capital intensity and a dominant position in „mission-critical" oligopoly structures in regulated markets such as healthcare, education and insurance.
As a serial acquirer, Roper has a proven M&A playbook and systematically identifies low-capital, vertically specialized companies with high margins and strong competitive advantages. The decentralized governance structure enables the various business units to operate largely independently, while the lean holding company focuses on strategic acquisitions, capital allocation and portfolio monitoring. The integration of artificial intelligence in the products based on proprietary domain data offers additional organic growth potential and a competitive advantage that is difficult to replicate.
The company generates reliable cash flows for further acquisitions and growth investments. As a dividend aristocrat with 33 years of increasing dividends and a share buyback program of USD 3 billion, Roper underlines its commitment to shareholder-friendly capital allocation.
To summarize, Roper Technologies has a high-quality business model with strong operational excellence, whose biggest challenge is paradoxically its own success. The question of whether the company can scale its recipe for success to the next level or whether it will eventually become „too big to grow" remains the key question for long-term investors.

