Dear trader, dear stock market friends.
Another week of record highs in the most important US share indices lies behind us. The Dow Jones Industrial Average, the S&P 500 and the Nasdaq 100 all reached new all-time highs.
Fundamental factors
The market is currently being driven by a mixture of strong economic data, a robust labor market, predominantly positive corporate results during the reporting season, strong share buybacks by companies and the prospect of an interest rate turnaround in the current stock market year, which is made possible by a continuing trend of disinflation.
However, the strong labor market and economic data is also a factor that the US Federal Reserve will take into account when deciding whether to cut interest rates. If developments are too positive, this could prompt the central bank to postpone the date for the first interest rate cuts further into the future. It is now considered very unlikely that the first rate cut will be announced on March 20.
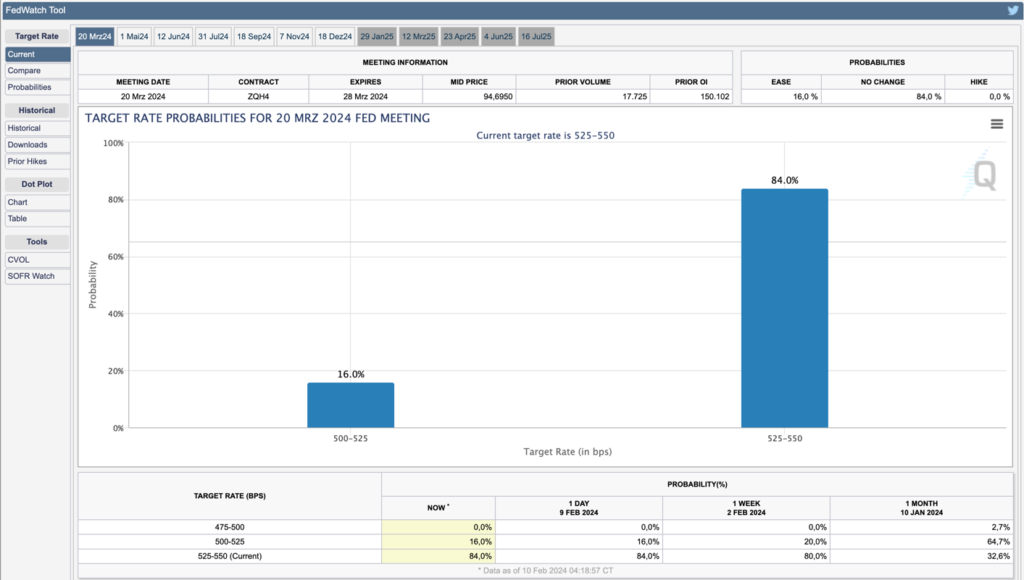
Measured using the FED Watch Tool, which calculates the probability of a rate cut based on the FED Funds Futures, the market currently expects an 84% probability that key interest rates will remain unchanged at the March meeting and only a probability of 16 % that interest rates will be cut. Just one month ago, the probability or expectation of a rate cut in March was 64.7 %.
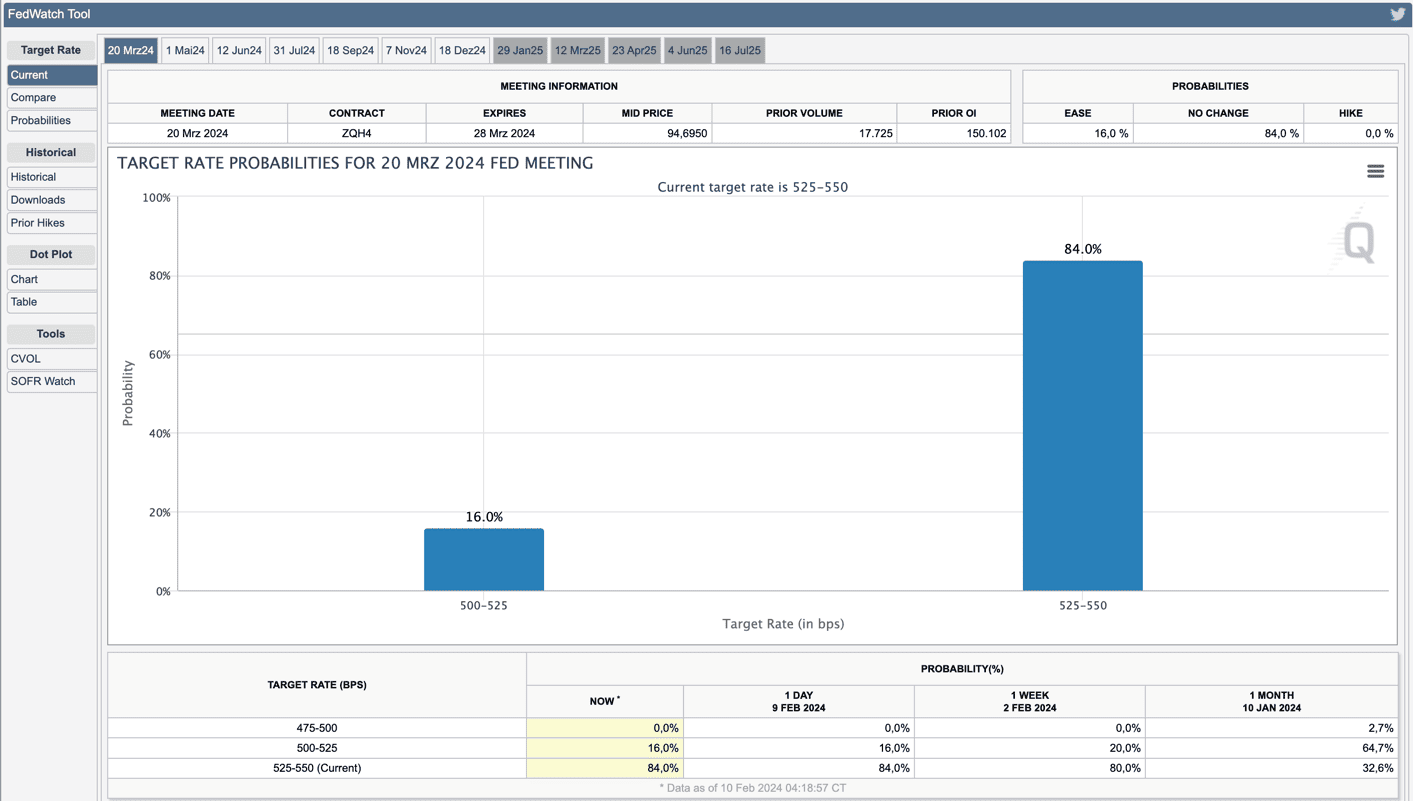 CME FedWatch Tool signals no interest rate cut in March
So far, the stock market has absorbed all developments indicating a delay in the interest rate turnaround or a slower pace of interest rate cuts remarkably quickly.
The somewhat "hawkish" outlook in recent weeks has led to a brief rise in US government bond yields and, conversely, to a correction in government bond prices. This development should continue to be monitored closely. The correlation between the equity and bond markets has been very high, particularly in the last two to three years.
The following chart shows the price of 10-year US government bonds (red) and the price of the Dow Jones Index (purple). The correlation can be seen in the chart overlay and with the help of the correlation indicators (correlation 20 days and correlation 50) below the chart. The correlation has weakened in the current year. For this divergence to close again, either the Dow Jones would have to correct or the bonds would have to rise.
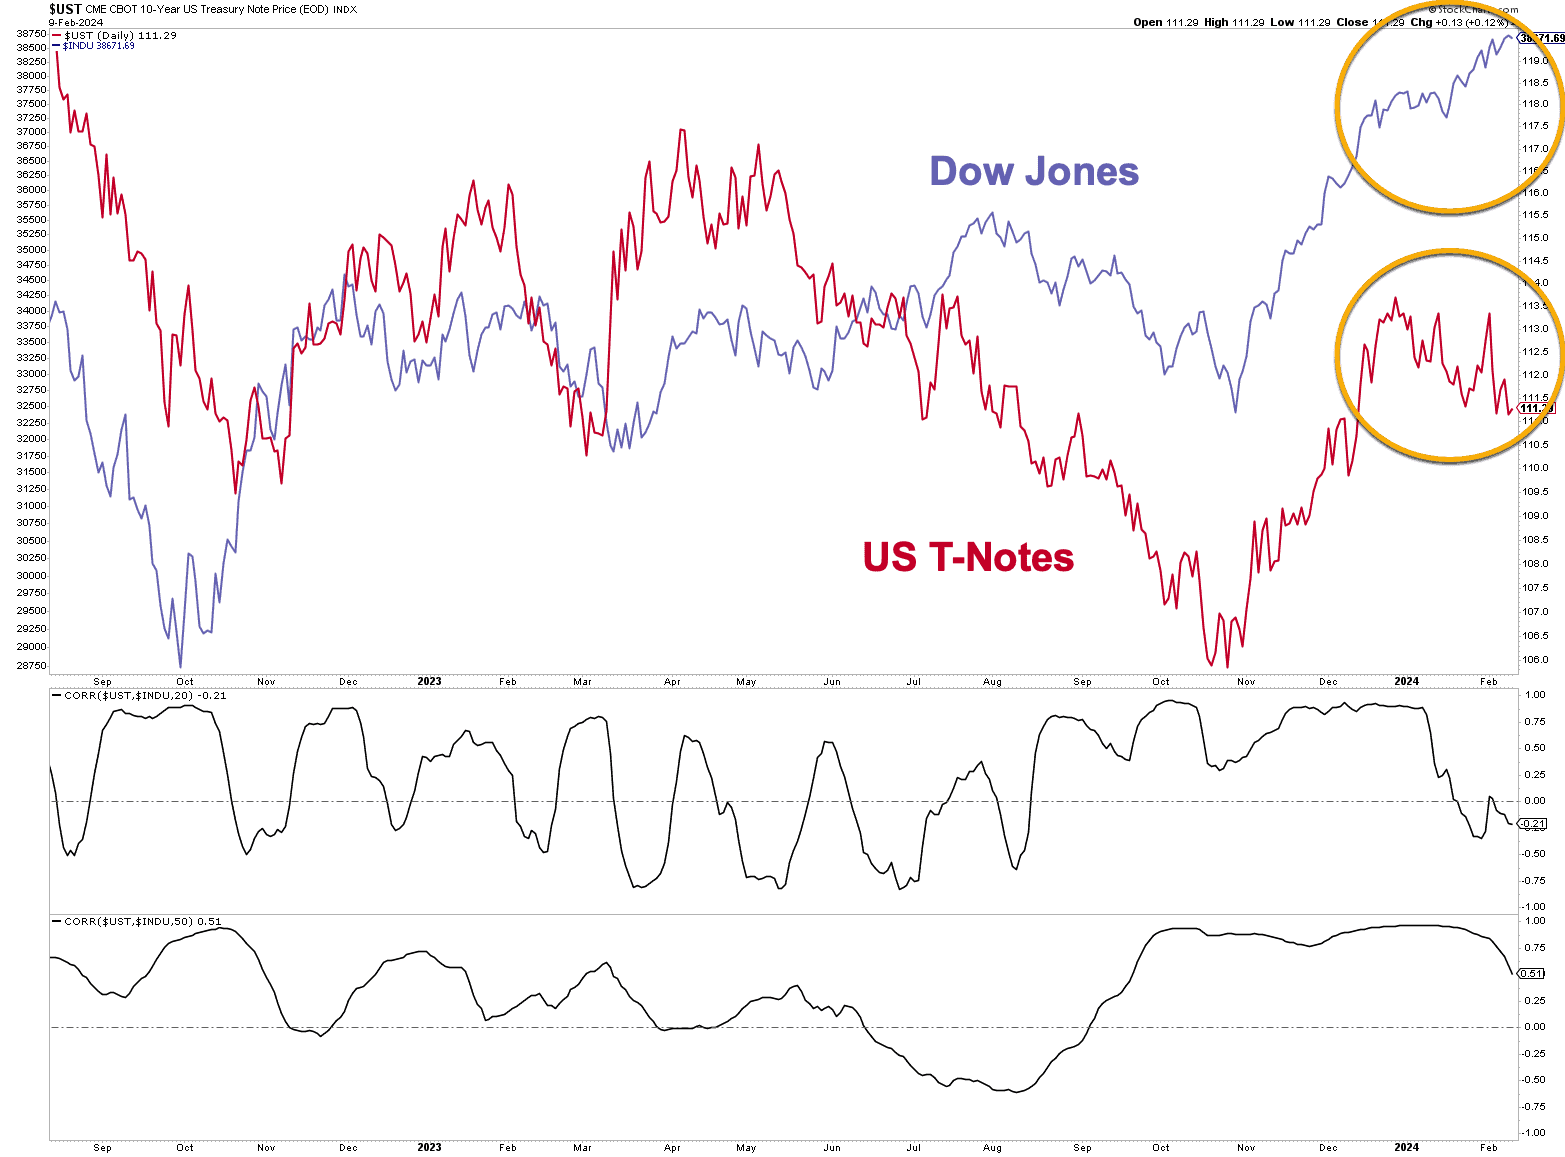 Dow Jones and 10-year US government bonds (T-notes) + correlation indicator
The correlation has weakened somewhat in recent weeks. If government bonds continue to come under significant pressure, this should also weigh on the stock market.
In this respect, the publication of consumer prices will attract a lot of attention this week. On Tuesday at 14:30, the inflation data for January will be reported, which could provide further indications regarding monetary policy and the pace of possible interest rate cuts. If, contrary to expectations, inflation rises surprisingly sharply, this could be a possible trigger for a correction on the stock markets.
Dow Jones: Technical outlook
The Dow Jones has risen in 14 of the last 15 weeks, which is nothing less than a rally that can be described as historic. That the market is overheated and in an overbought state is self-explanatory and a look at momentum indicators seems superfluous. Nevertheless, the last few weeks have shown that an overbought state can last for a long time and is not in itself a reason to bet on a correction. One of the most important virtues of every investor and trader is required here: patience. As long as the chart signals indicate a bull market and the intermarket analysis confirms this, corrections should be used to jump on the upward trend. In the short term, the EMAs on the daily chart can be used as a guide. Support is provided by the EMA 20 and the EMA 50, which in the event of a correction coincides with the horizontal support area at around 37,800 points.

Dow Jones daily chart with EMA 20 (purple) and EMA 50 (green)
In the event of a more extensive correction, the next support levels can be seen on the weekly chart. Here it is advisable to combine the horizontal support levels with other supports, such as the upward trend line and the most important moving averages on a daily and weekly basis. As soon as buy signals such as candlestick reversal formations (or a subordinate trend reversal on a smaller trend scale) occur at one of the support areas in conjunction with rising volume, a long entry may be attractive.
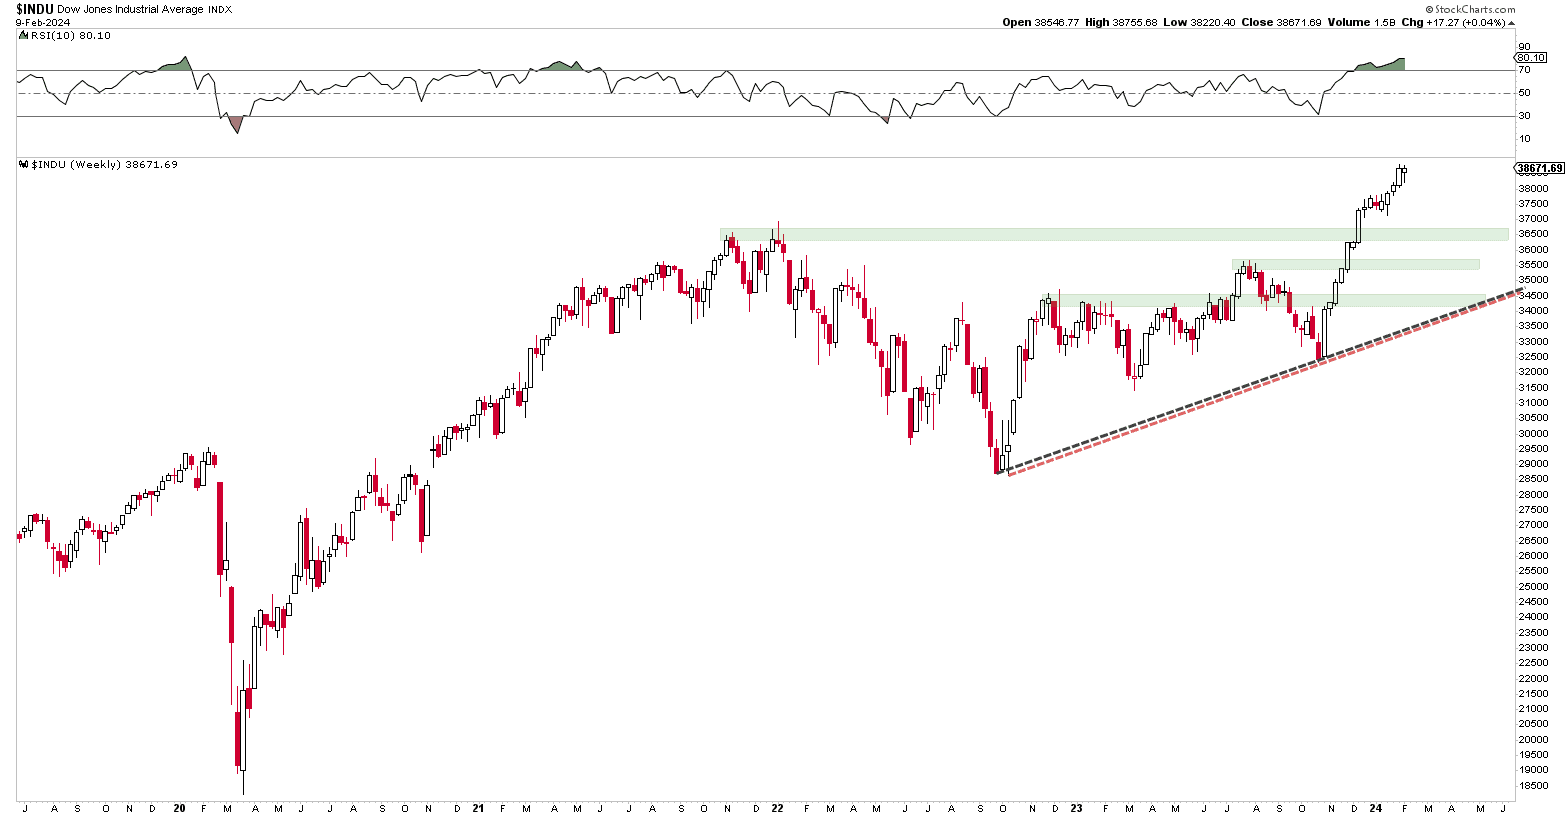
Dow Jones weekly chart
Author: Tobias Schmid
Date: 12.02.2024