Dear trader, dear stock market friends.
The Nasdaq 100 Index reached another all-time high last week amid slightly higher trading volumes than in the previous week. After consolidating sideways at a high level in the previous two weeks, the Nasdaq 100 thus showed relative strength again and technology stocks remain one of the leading market sectors this year.
Breakout above the 18,000 points mark
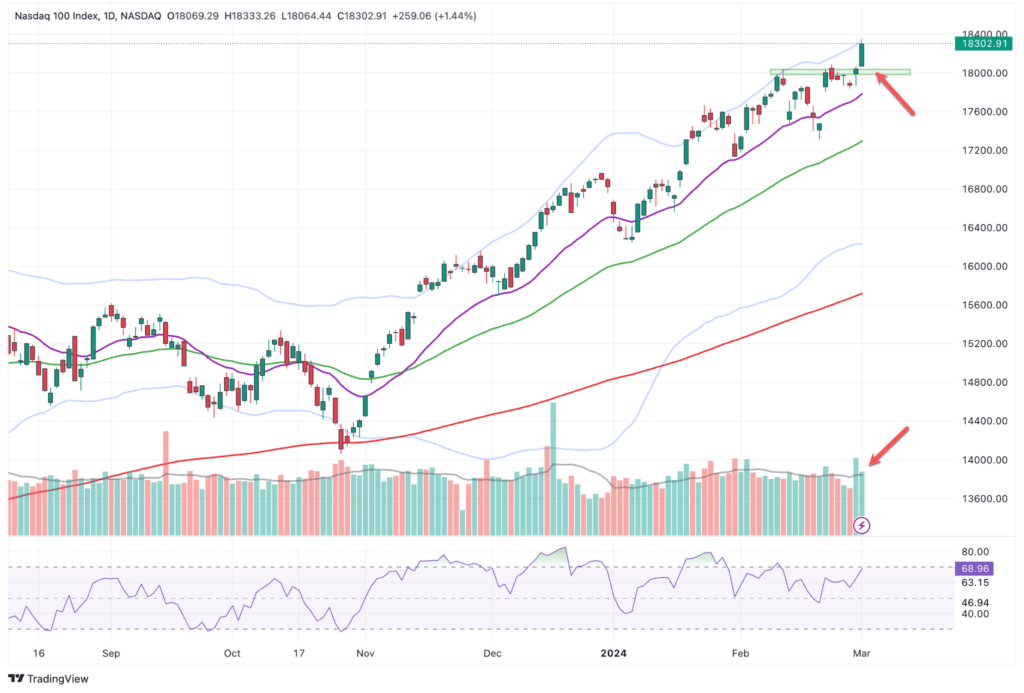
As can be seen on the following daily chart, the Nasdaq 100 rose to around 18,000 points for the first time on February 9. This was followed by a small correction and the resistance around the 18,000 mark was tested several times before finally breaking out on Friday.

Nasdaq 100 daily chart: breakout above 18,000 points on rising volume
Wait for a correction or consolidation
It can also be seen that the Nasdaq 100 has now reached the upper Bollinger Band, which means that the air is getting a little thin, at least in the short term. Since the start of the rally in November, the index has repeatedly reached the upper Bollinger Band (or broken out above it) and a correction or consolidation usually followed in the days and weeks afterwards. The risk/reward ratio is therefore no longer favorable at the moment. In the event of a correction, it would be better to re-enter the market and jump on the trend.
Short-term buy zone between EMA 20 and EMA 50
The EMA 20 and EMA 50 confirm the upward trend and the bullish momentum is still intact. During the current uptrend, the corrections also followed a pattern and each ended near the daily EMA 20 or between the EMA 20 and the EMA 50. As long as this pattern continues, this price zone offers another opportunity to position yourself directionally long or to sell put options or put spreads in the event of a correction.
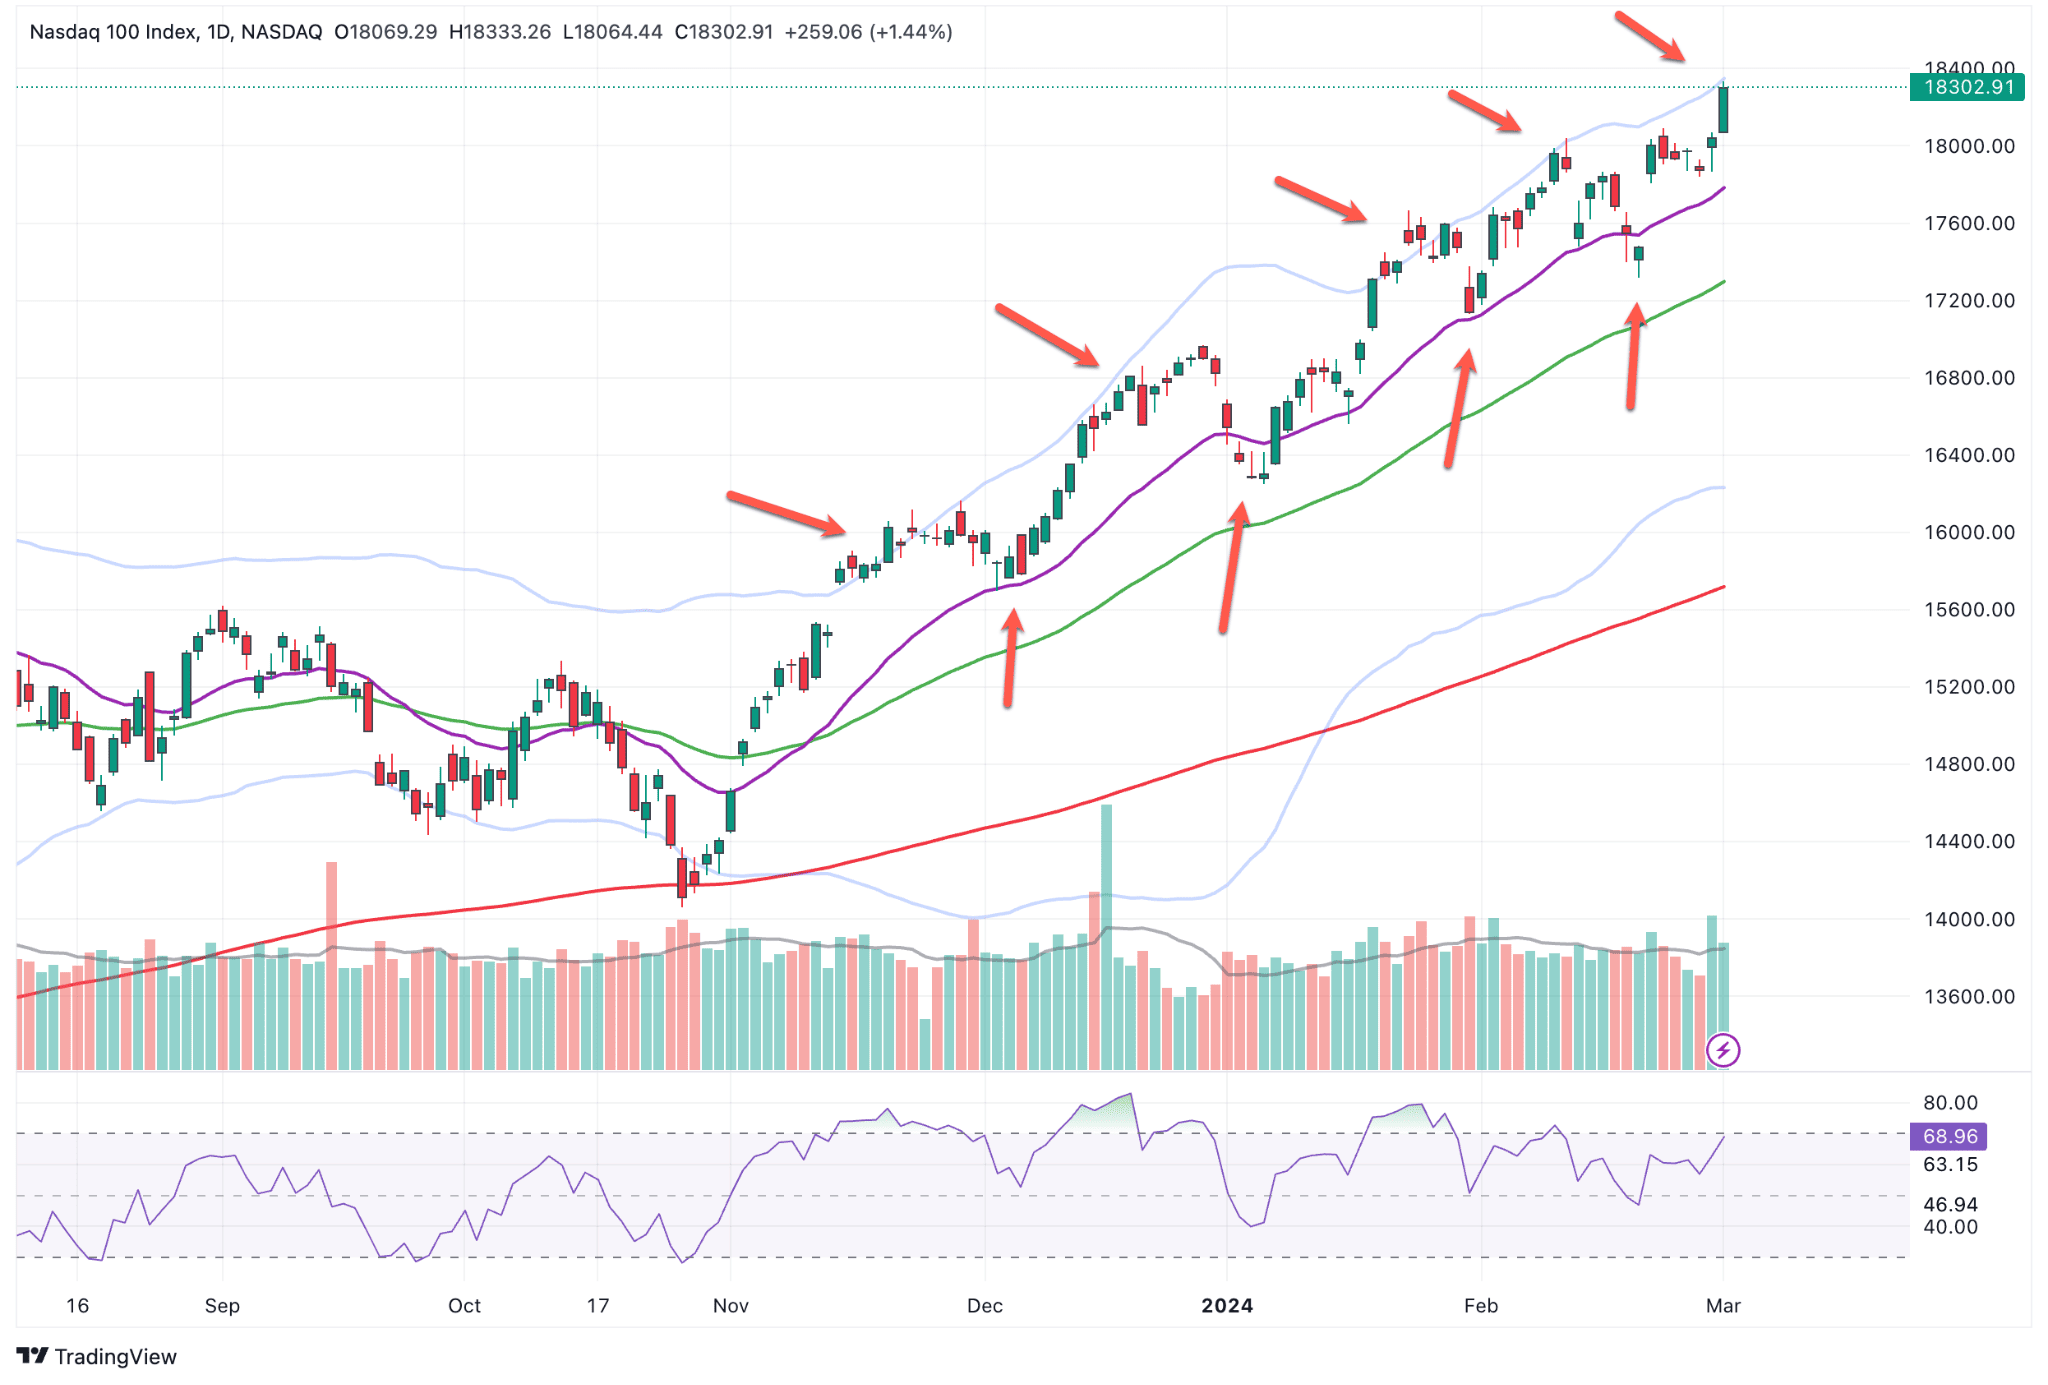
Resistance near the upper Bollinger Band and support between the EMA 20 and EMA 50
Nasdaq Composite at new all-time high for the first time since 2021
The Nasdaq 100 tracks the 100 stocks with the highest market capitalization on the Nasdaq technology exchange (excluding financial companies). More than 3000 companies are listed on the Nasdaq and the Nasdaq 100 therefore only represents a small part of the Nasdaq. A positive sign of a bull market is when not only the heavyweights (companies with a high market capitalization) rise, but also the broad market, i.e. the mass of all shares. The Nasdaq Composite Index reflects the performance of all companies traded on the Nasdaq. The following weekly chart shows that the Nasdaq Composite Index generated a new all-time high last week for the first time since 2021.
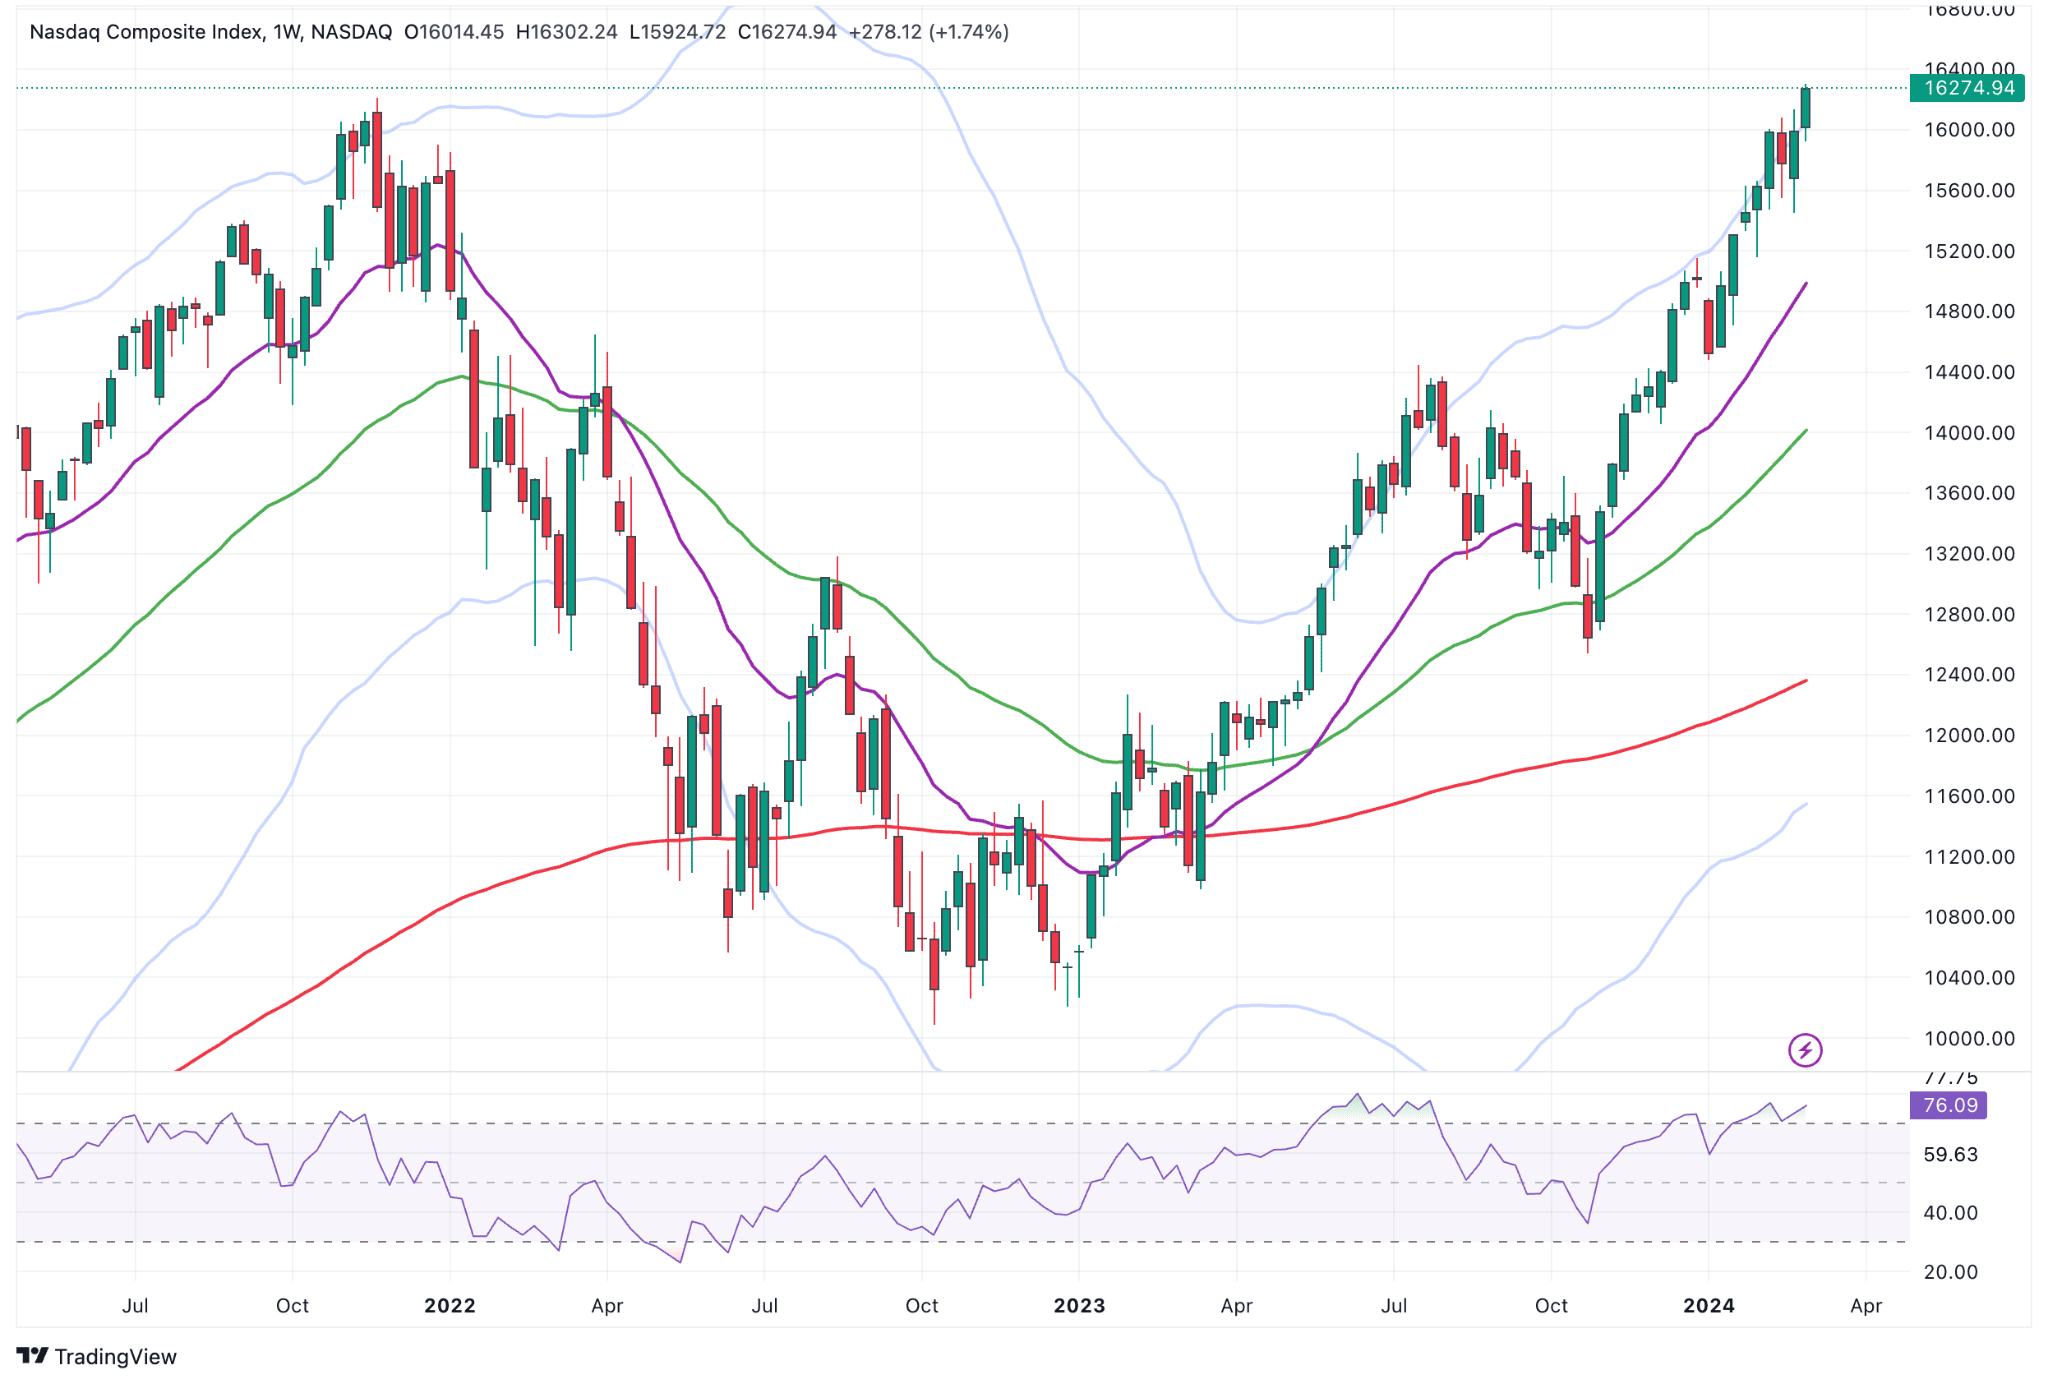 Nasdaq Composite Index (weekly chart) with new all-time high
Many setups in individual securities
In addition to trades or investments at index level, there are currently many individual stocks included in the Nasdaq 100 that are in stable upward trends. Here, too, it is a promising strategy to trade stocks with relative strength at chart breakouts, or at the second attempt if a correction to the breakout level occurs after the breakout. The sale of put options (cash-secured puts) can also be interesting in precisely such situations, with the aim of buying 100 shares per option in the event of a correction if the option is in the money on the expiry date.
Advanced Micro Devices (AMD) was one of the five strongest stocks last week, gaining around 15 %. On Thursday and Friday, the share broke above the resistance level of around USD 180 amid high volumes.
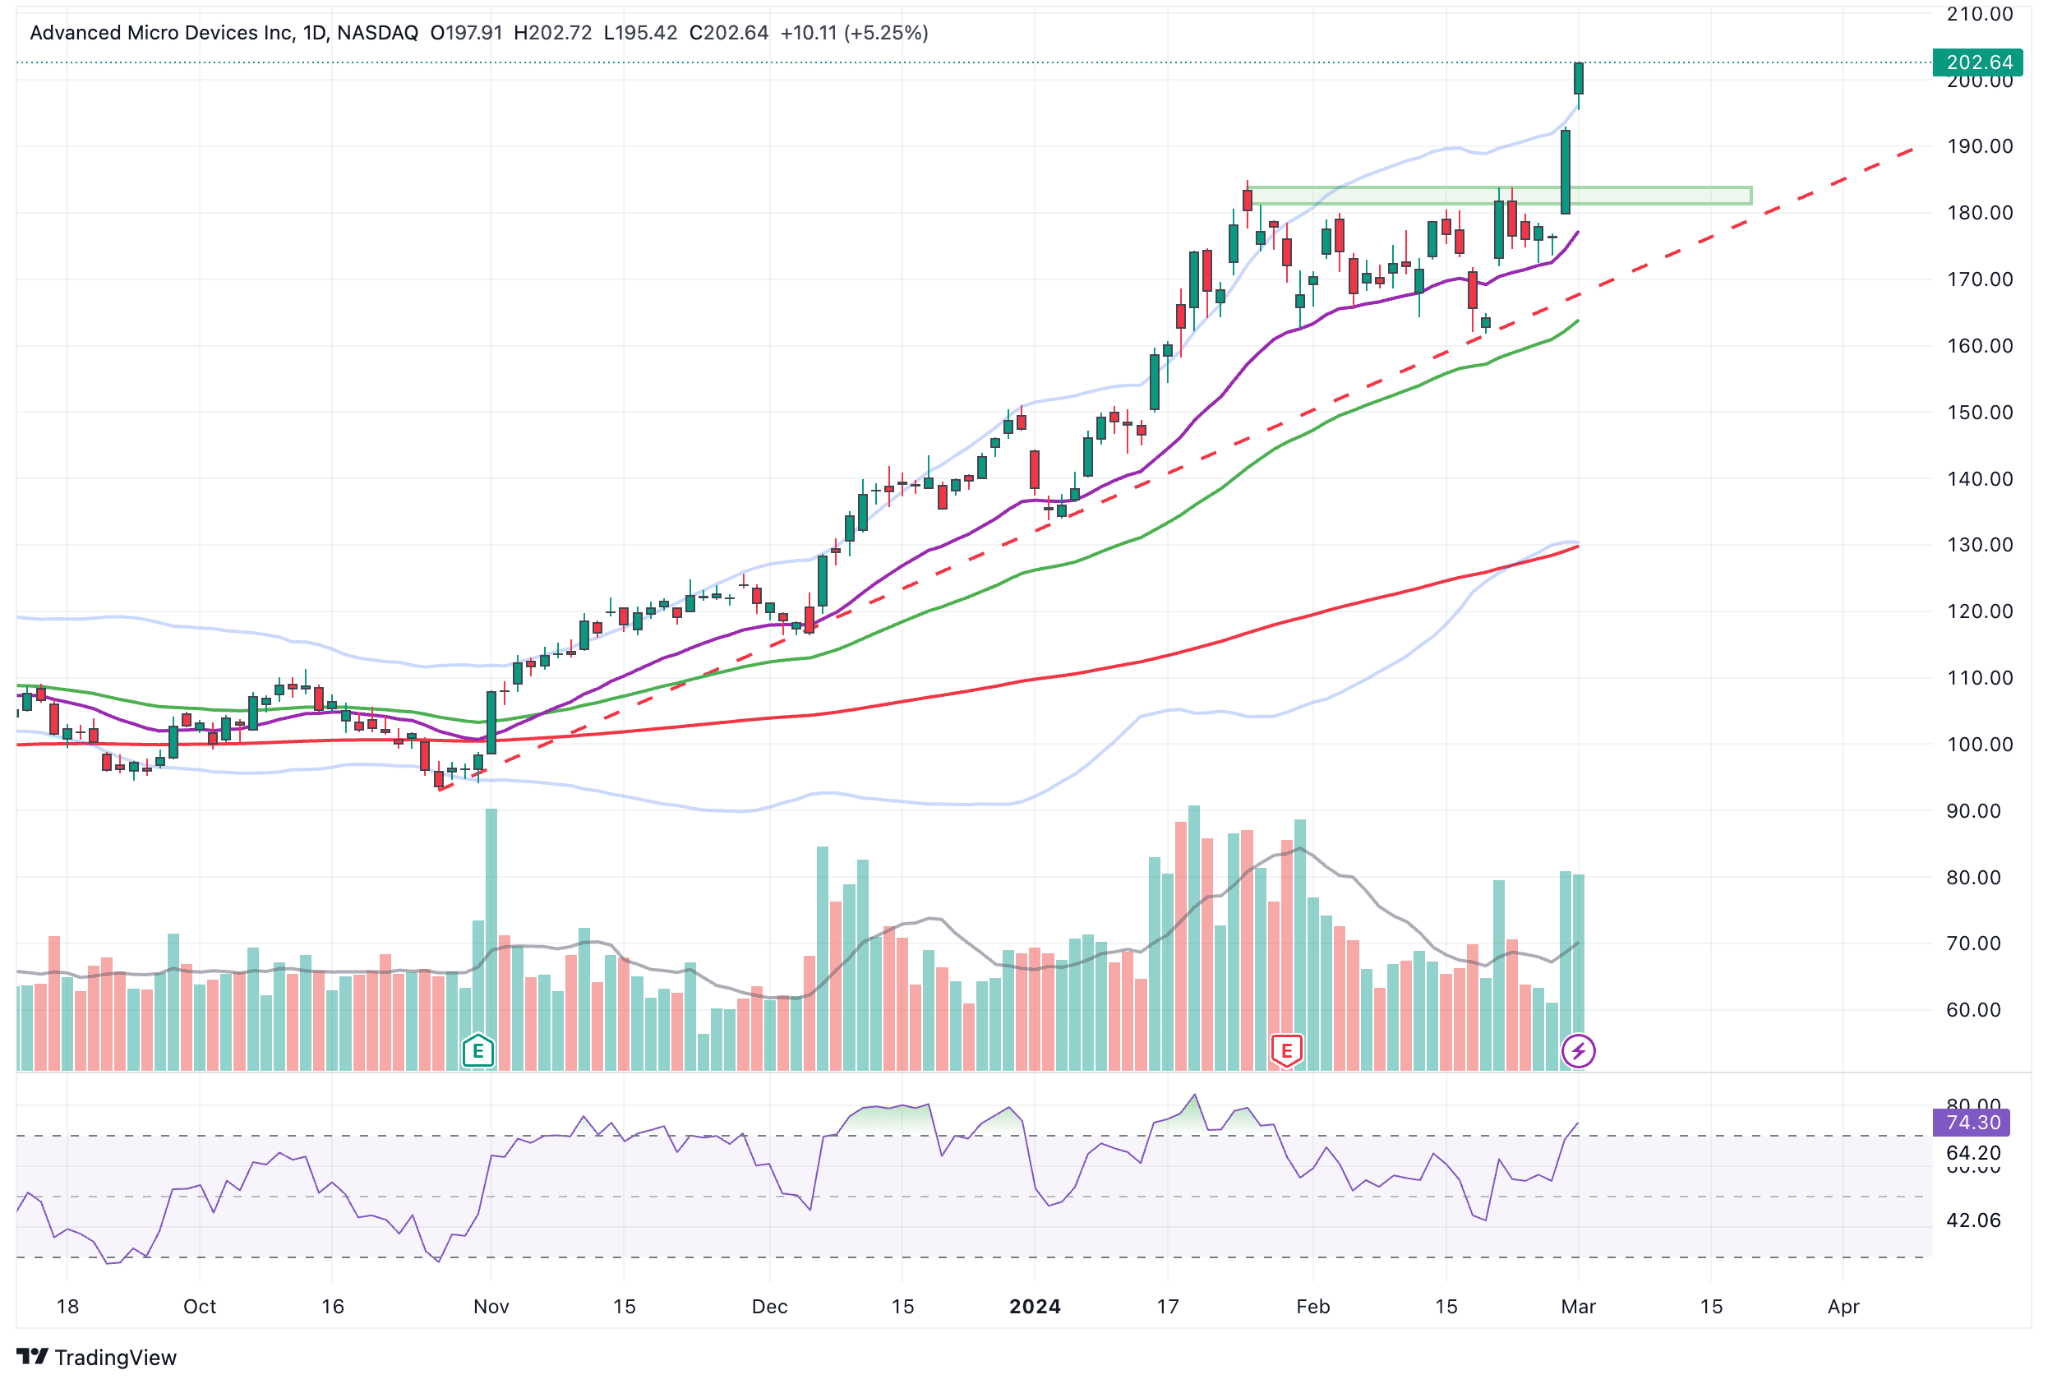 AMD daily chart
A similar setup can be found in Marvell Technology (MRVL). The stock also broke out above the resistance area on heavy volume and was one of the strongest stocks in the Nasdaq 100 last week, gaining about 15 %. Note, however, that the company releases quarterly results this week on Thursday, March 7.
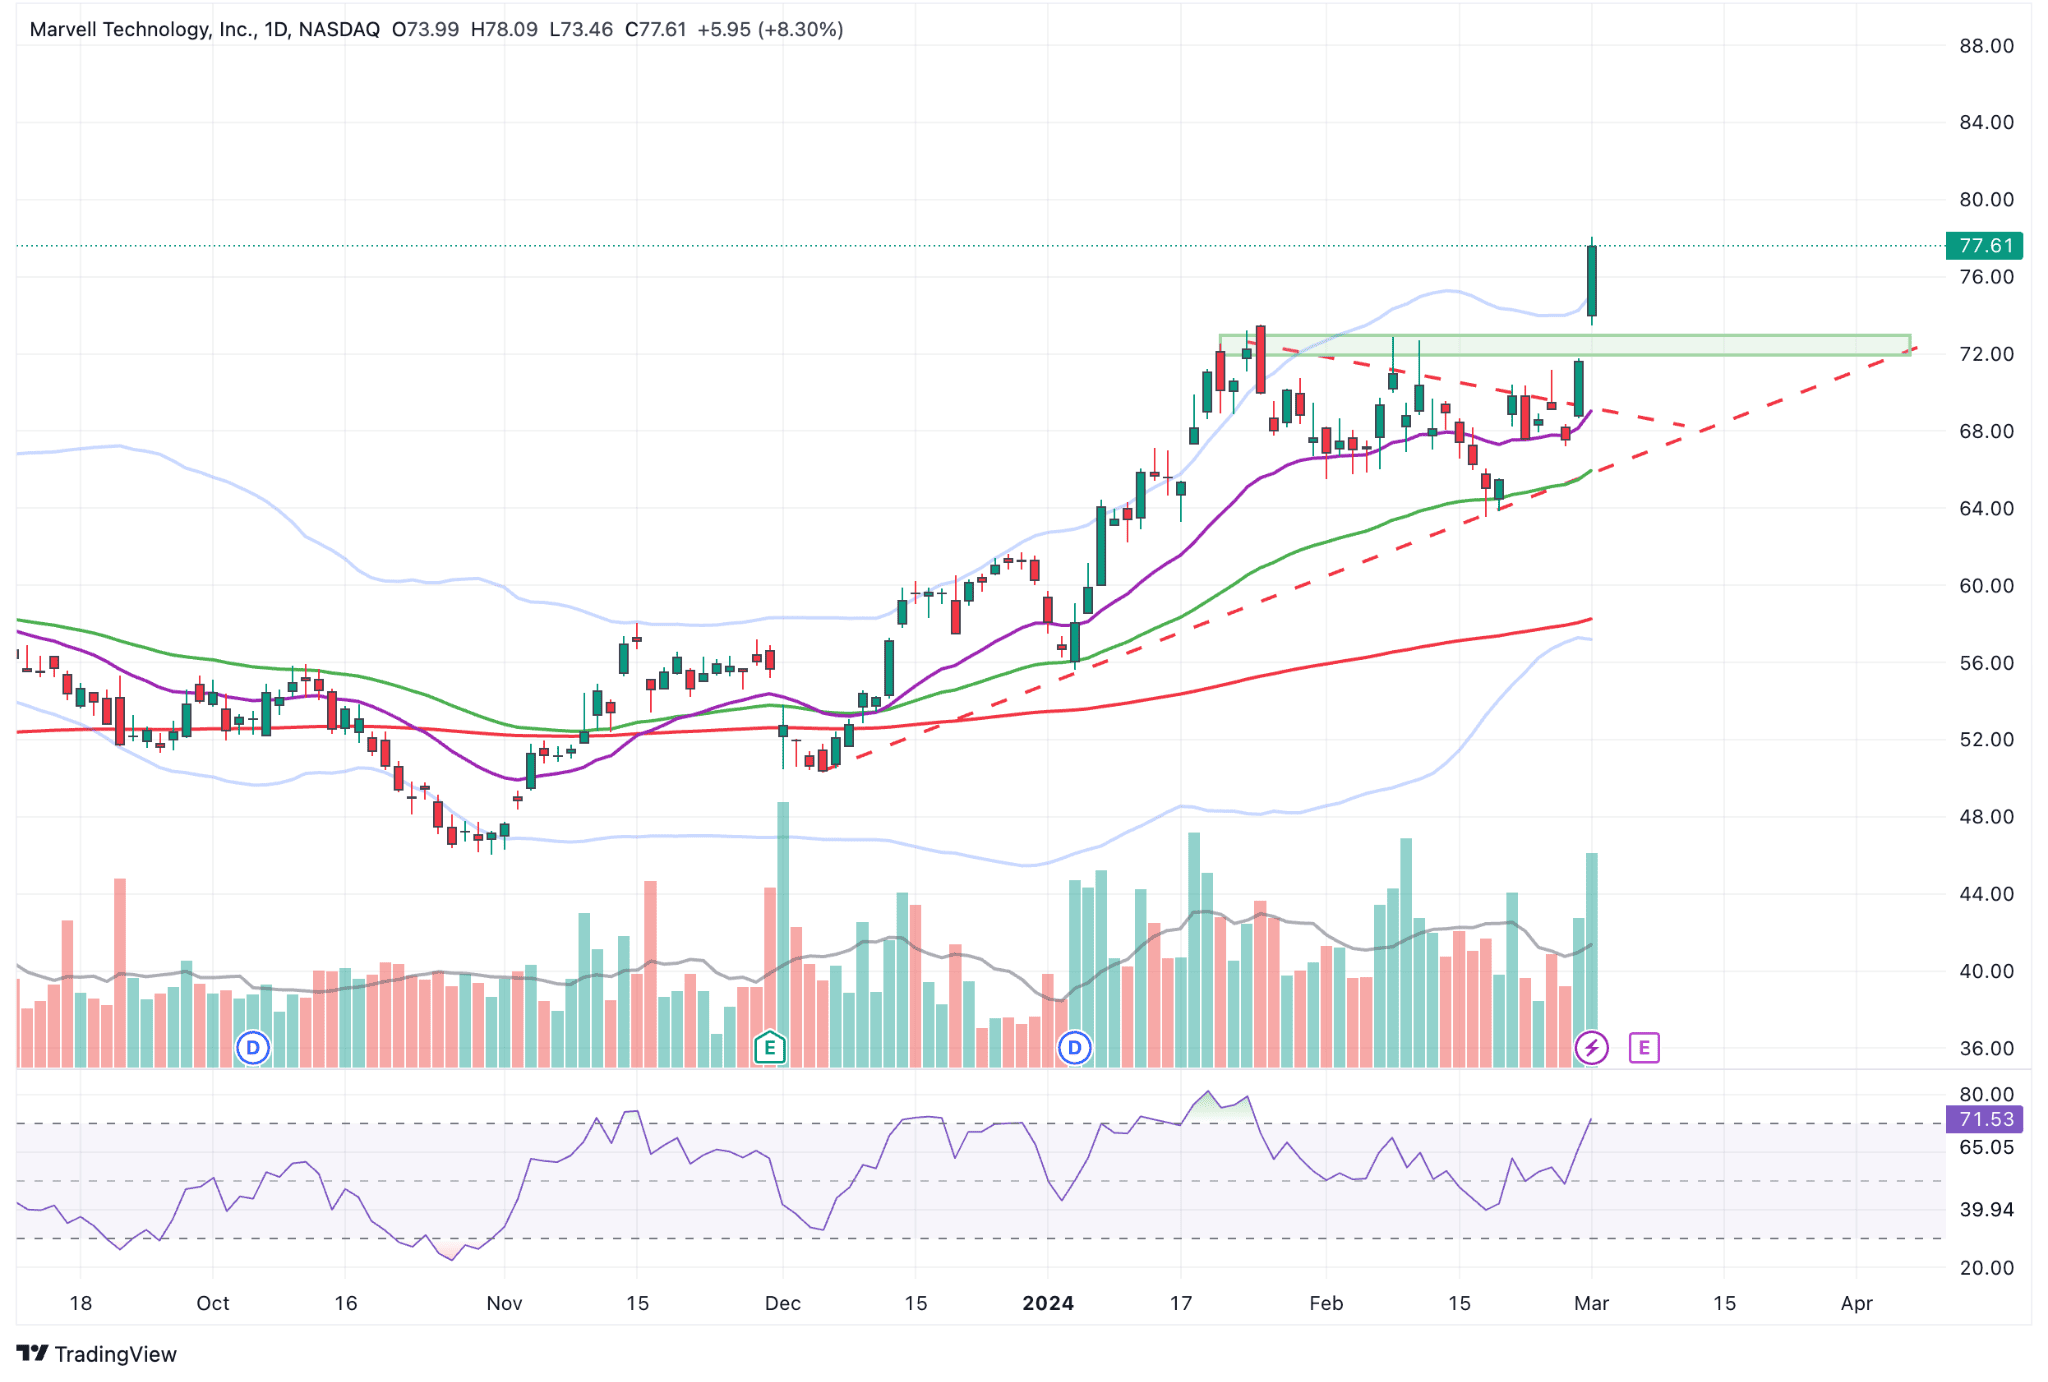 MRVL daily chart
Author: Tobias Schmid
Date: 04.03.2024