Dear traders, dear stock market friends.
The S&P 500 ended the past trading week virtually unchanged after a significant recovery in the previous week. Due to Donald Trump's backpedalling in the trade dispute, the stock market was able to form a short-term bottom. However, the ongoing political and economic uncertainties remain a negative factor that is causing a great deal of uncertainty. Volatility is also still at an elevated level compared to the long-term averages, which on the one hand reflects the ongoing uncertainty, but on the other hand also opens up opportunities for traders.
Cautious signs of easing
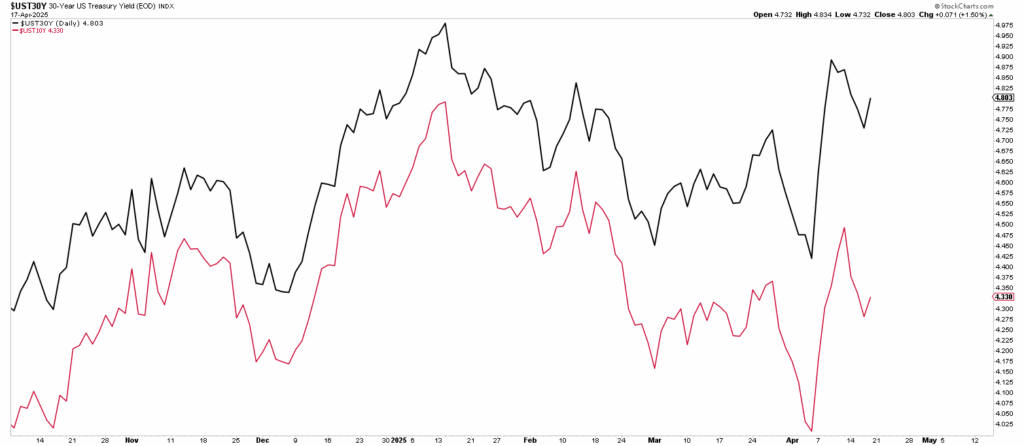
In addition to the price declines on the global equity markets, we have also seen some very volatile movements in many other markets in recent weeks. The sharp rise in yields on US government bonds was very likely a factor that caused the US government to become very nervous and may even have been the decisive reason for the rhetorical signs of relaxation and the pause in the previously announced tariffs.
There are also increasing reports that the Fed is ready to intervene with quantitative easing measures if the rise in yields continues. Although there is no official confirmation of this, it is clear that a further explosive rise in interest rates could significantly destabilize the financial markets. Despite speculation about possible quantitative easing (QE) measures, Fed Chairman Jerome Powell recently emphasized that the markets are currently functioning in an orderly fashion and that no immediate intervention is necessary. Meanwhile, yields on 10-year and 30-year US government bonds have fallen moderately in the last two weeks, signaling an easing of the situation, at least in the short term, which in turn is also a positive signal for the equity markets.
Copper and oil prices recover
The slump on the stock markets was accompanied by sharp falls in some commodity prices. The price of crude oil (light sweet crude oil) fell from around USD 72 per barrel to below USD 56 within a few days. In the last few days, the price of crude oil has already recovered half of the previous price losses, which can also be seen as a sign of easing (at least for a short time).
The copper price, which is regarded as a kind of global economic indicator and is therefore also referred to as "Dr. Copper", has already shown a clear recovery in the past two weeks, which gives rise to hopes that the feared global downturn can still be averted.
Death Cross confirms downward trend
In view of the ongoing uncertainties, the S&P 500 Index performed comparatively well last week. However, even though there was no renewed sell-off, the technical picture remains bleak. A clear downward trend has now emerged and the S&P 500 is trading below the 200-day line (red in the chart below), which is an indicator of the long-term trend.
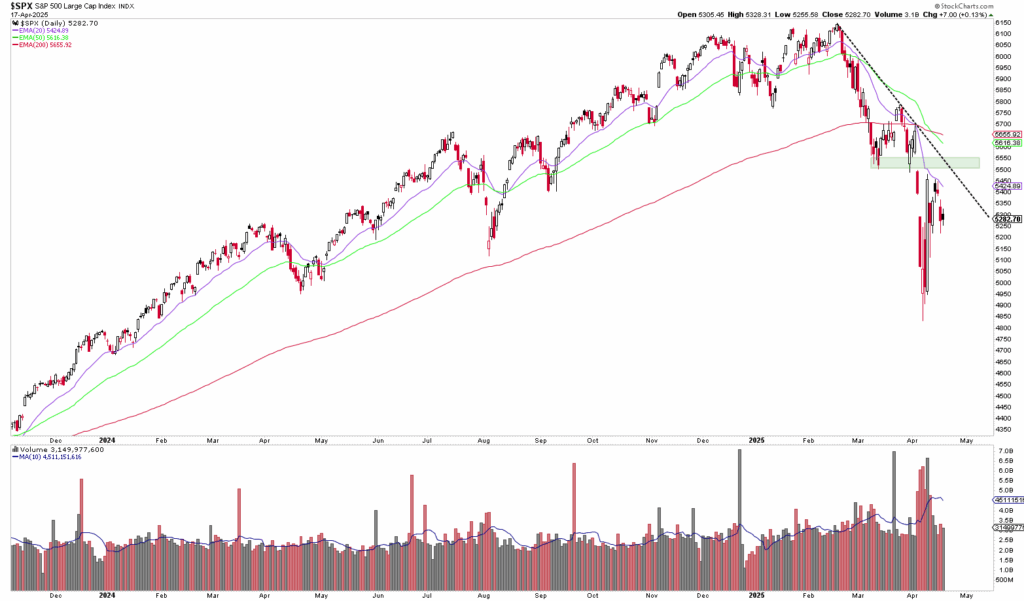
In addition, another signal dreaded by chart technicians was generated last week: The so-called death cross. This is when the 50-day line falls below the 200-day line. Moving averages are a "lagging indicator", i.e. they need some time to confirm a trend. In addition to the mere price decline, the death cross is therefore also a signal that takes the time factor into account and expresses that prices are trending weakly over a longer period of time.
The last time a death cross occurred in the S&P 500 was at the beginning of the bear market in March 2022. However, the long-term statistics of the death cross are not very promising, as the signal often occurs too late.
According to a Article from TheStreet of April 15, 2025, the S&P 500 has experienced a total of 24 death crosses since 1950. In 72 % of these cases, the index was higher twelve months after the signal than at the time of the death cross, with an average return of 10.5 %.
Long-term support at 4,800 points
The most recent decline in the S&P 500 ended at 4835 points. The horizontal support area, which is generated by the all-time highs from December 2021 and January 2022, is located at precisely this price level. The support area is also reinforced by the long-term upward trend line and the weekly EMA 200 (red). In addition, the 50% retracement lies here, starting from the low at the end of the bear market in October 2022.

Risk Off mode continues
Investors are currently avoiding risky investments and capital is increasingly flowing into less risky assets. On the stock market, this can be seen in the underperformance or relative weakness of offensive sectors and the relative strength of defensive sectors. This pattern is typical of bear markets. Only as soon as we see a rotation back into offensive sectors would this indicate a sustained recovery or an increased probability of rising prices.
Defensive sectors such as utilities, consumer staples and the healthcare sector have significantly outperformed the broad market since the start of the year. The first two of these sectors are even up on a YTD basis. Offensive sectors such as cyclicals and technology, on the other hand, are showing clear weakness. This picture has been somewhat more mixed in recent days. Should there be short-term relative strength or relative weakness in the offensive market sectors in the coming days, this would be an important signal for the broad market.
Author: Tobias Schmid
Date: 21.04.2025