Dear traders, dear stock market friends.
Following the 10% correction between February and March, the S&P 500 attempted a recovery on Friday, March 14. Although the recovery continued in the past trading week, a sustained rise has not yet been achieved and the fundamental and technical situation remains uncertain. On a weekly basis, the S&P 500 Index closed almost unchanged compared to the previous week (+0.1 %).
Industrial production at an all-time high - recession canceled?
In recent weeks, it has become clear that fears of an economic downturn or even a recession are circulating and causing uncertainty among investors. Many of the major US banks have revised their forecasts for the probability of a recession upwards. Depending on the bank, these are usually between 20 - 40 %. The economic concerns were and are triggered by the announcement of new US tariffs.
Last Monday, March 17, the Industrial Production Index (IPI) was published. This important economic indicator measures overall economic production in the industrial sector. This primarily includes:
- Manufacturing industry (e.g. mechanical engineering, automotive industry)
- Mining and raw materials extraction
- Energy generation (electricity, gas, etc.)
As the industry reacts sensitively to changes in demand, the IPI often indicates at an early stage whether an economic recovery or slowdown is on the horizon.
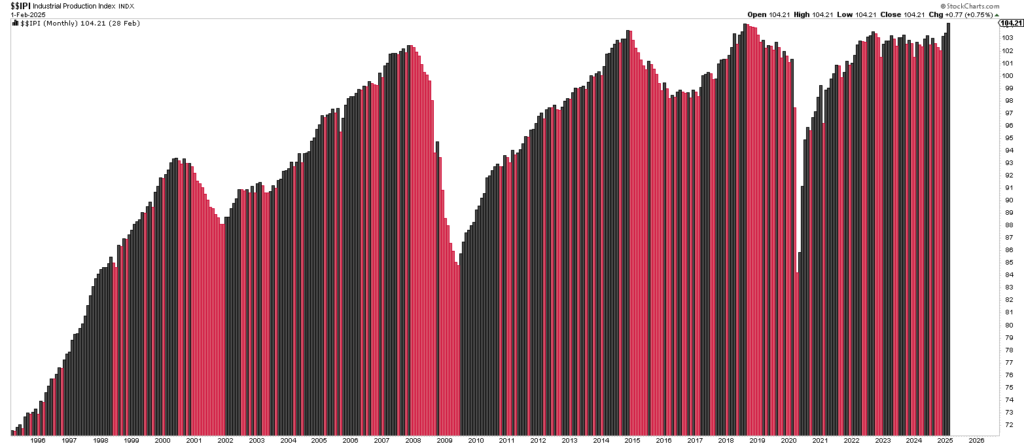
As you can see from the chart above, the IPI reached a new all-time high in February (publication date: March 17). This means:
- The industry is producing more than ever
- There is high demand for goods
- Capacities are utilized and investments are often made
- Companies are confident
The likelihood of the US going into an immediate recession cannot therefore be ruled out, but it is comparatively unlikely.
New tariffs come into force on April 2
The tariffs announced by Donald Trump, which are due to come into force on April 2, remain another major source of uncertainty. On the one hand, it is difficult to assess whether these are actually "only" reciprocal tariffs for trading partners that currently levy higher tariffs on US products than vice versa, or whether the US government intends to escalate further, or whether it may row back again in the coming weeks and reach an agreement. As long as this uncertainty factor remains unresolved, the current recovery in the S&P 500 appears to be on shaky ground.
US government tries to force interest rate cut
Some people are wondering what the real reason for the current escalation in the trade dispute is. It is very likely that Donald Trump wants to remain unpredictable and prove that he means business and is prepared to go to extremes.
Furthermore, it is reasonable to conclude that a temporary uncertainty on the markets and a moderate cooling of the economy would not be inconvenient for the US administration or that it may even be trying to deliberately bring this about. The following must not be forgotten: One of the USA's biggest medium to long-term problems is its immense national debt. Both Trump and Treasury Secretary Scott Bessent have previously declared the reduction of high government spending and budget deficits to be one of their most important goals. Uncertainty on the stock market and an economic downturn would therefore mean that not only could the Fed cut interest rates faster than previously expected, but yields at the long end in particular could also fall.
According to a recent article in the Wall Street Journal from March 2025, the refinancing requirement of the USA this year is around 7.6 trillion (=7600 billion) US dollars. This sum includes:
- Maturing existing debt that must be replaced by new bonds (refinancing)
- New deficits that have to be covered by additional borrowing
However, there may only be a fine line between a moderate slowdown and a recession.
S&P 500 between weekly EMA 50 and daily EMA 200
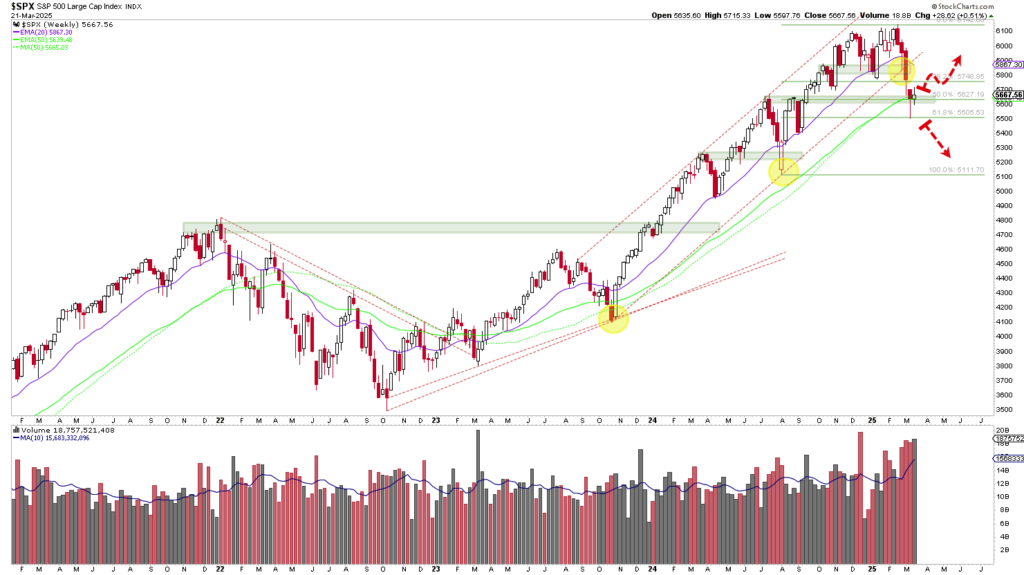
As far as the technical chart is concerned, significant damage has already been done in recent weeks. The S&P 500 Index fell for four weeks in a row and broke out of the trend channel that has been in place since the end of 2023. On a positive note, the index found support at 5650 points and was able to defend this important price zone on a weekly closing price basis. There is horizontal support here, generated by the last important local high of the long-term uptrend; in addition, the weekly EMA 50 and the weekly SMA 50 run exactly at this price level. In addition, 5650 points is exactly the 50% retracement of the last major upward movement. Incidentally, the weekly low of the previous week ran exactly to the 61.8 Fibonacci retracement at around 5500 points. If this support level is breached on a sustained downward trend, further losses are imminent.
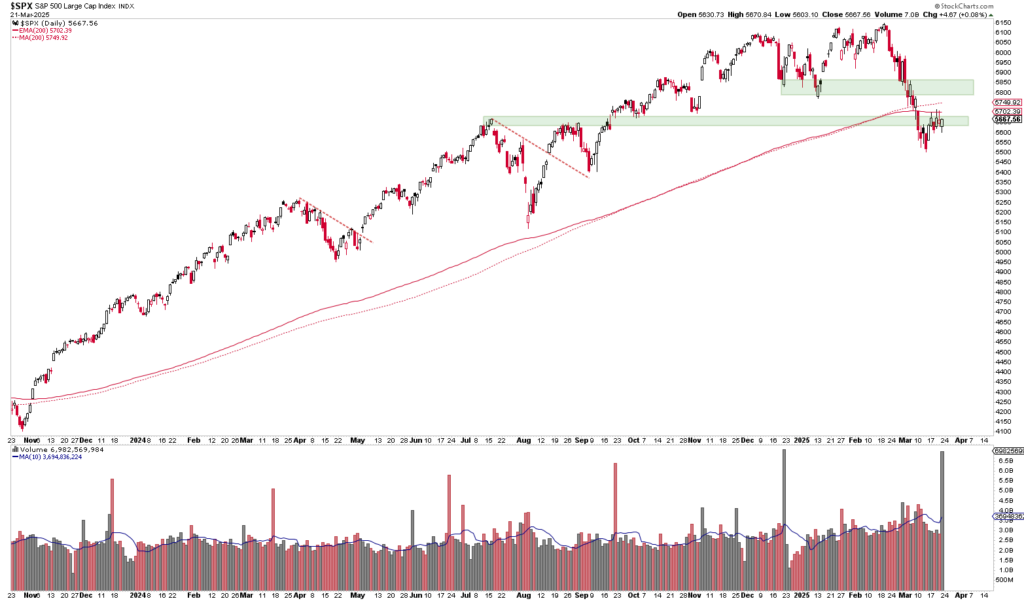
The daily chart shows that the current upward movement stopped exactly at the daily EMA 200. For the chart picture to brighten in the short term, at least the EMA and SMA 200 should be overcome, ideally accompanied by strong volume.
Author: Tobias Schmid
Date: 24.03.2025