
Dear trader, dear stock market friends.
Just in time for the weekend, the S&P 500 broke out to a new all-time high last Friday. With a closing price of 4839.81 points, the index reached its highest level since January 3, 2022. In this analysis, you can find out what to watch out for now.
Technology stocks lead the rally
The broad equity market is in a bull market. After the Dow Jones and the Nasdaq 100 had already generated new all-time highs, the S&P 500, probably the most important share index in the world, also managed to do so last week. The rally was led by the positive sentiment in the technology sector. The technology sector ETF, XLK, was the strongest of the 11 market sectors, rising 2.31 % on Friday. The chart below shows the breakout to a new high under heavy volume. In addition, the upper Bollinger band was broken through and the moving averages also signal an upward trend.

Technology Sector ETF (XLK) Daily Chart
Relative strength of the offensive sectors
In addition to the technology sector, the other offensive sectors are also showing relative strength. On Friday, the sectors XLF (Financials), XLC (Communication Services), and XLY (Consumer Discretionary) were among the biggest gainers, whereas the defensive sectors XLV (Health Care), XLU (Utilities) and XLP (Consumer Staples) were the three weakest sectors. This is a clear sign of a growing risk appetite among investors.
Over the course of the week, the offensive sectors continue to lead the way, while the defensive sectors bring up the rear. The technology sector XLK ended the week with a plus of 4.13 %, XLC rose 1.38 %, XLF gained 0.88 % and XLY achieved a performance of + 0.55 %. Defensive utilities were the weakest sector, down 3.7 %. Consumer staples (XLP) was also one of the weak sectors with - 1.03 %.
Market breadth not keeping pace
For a bull market to be stable, it should be supported by the broad market, i.e. by the broad mass of all shares. We can use market breadth indicators such as the Advance Decline Line for this purpose. Since the beginning of the price rally in November, the AD line has risen significantly and is currently in a clear uptrend. This is a confirming signal for the long-term uptrend. However, the signals (especially divergences of the AD Line with the S&P 500) in the primary and secondary trend lines are also highly informative and have a high hit rate. If the S&P 500 breaks out to a new local high in the trend, this should be confirmed by a breakout of the Advance Decline Line
However, last week's breakout was not confirmed. In the last few days, the AD line had even fallen below the local low of January 4. There is currently a bearish divergence here, which could be a sign that the index will enter correction mode again in the short term. In any case, the AD line should continue to be watched closely to see whether this is just a short-term weakness or whether there will be sustained weakness in market breadth.
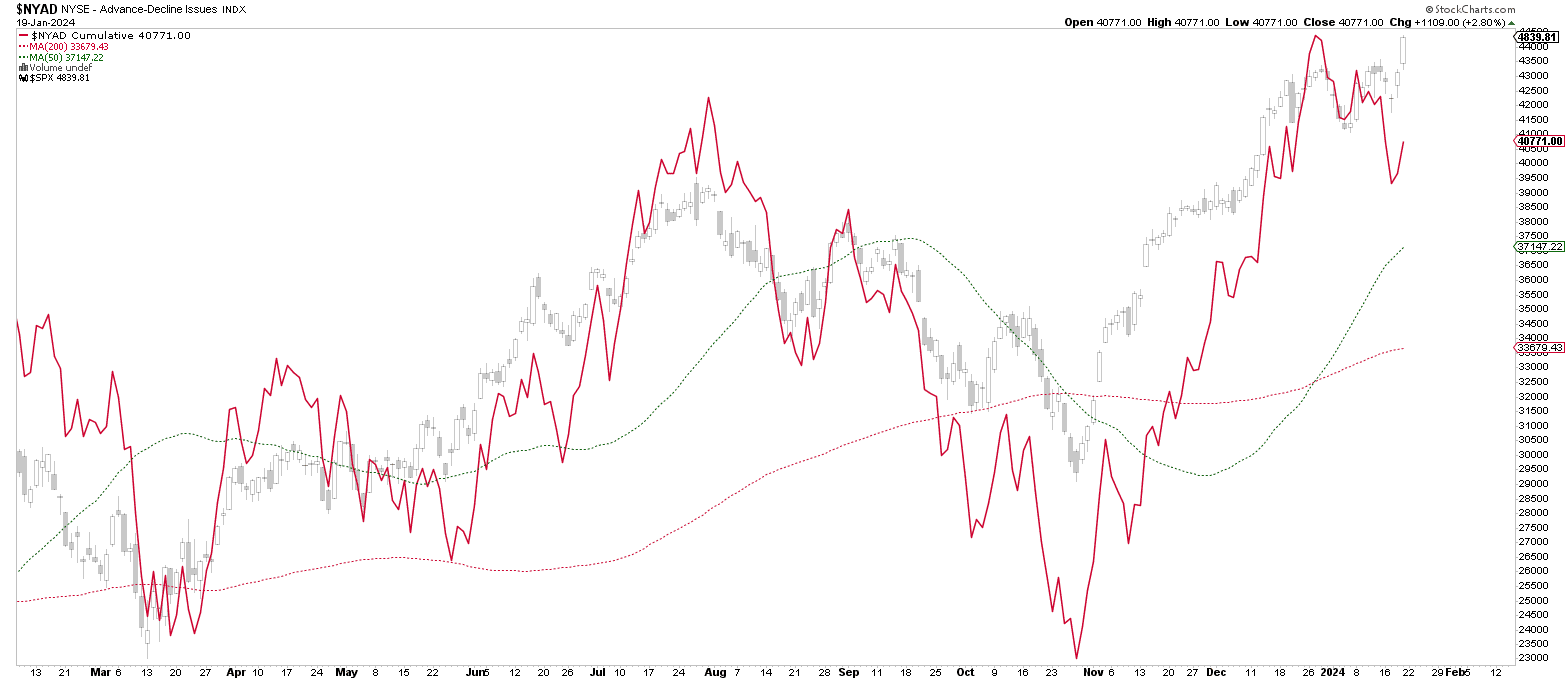
Advance-Decline-Line cannot confirm breakout in the S&P 500
Textbook chart technique
Sector rotation and market breadth analysis are important tools, but should be seen as secondary indicators. If warning signals arise here, this is a reason for caution, but one should not position oneself against such a strong trend as we are currently still seeing. Rather, it makes sense to wait for a correction in the event of warning signals and use this to re-enter the market in the direction of the overriding trend.
Both the primary and secondary trends in the S&P 500 Index are currently clearly bullish. The upward trend is also confirmed by the moving averages. These are moving upwards and are in the "correct" order, from short to long. The most recent correction ran up to the daily EMA 20 (purple), which served as support. The fact that the S&P 500 did not correct further than the EMA 20 is a signal of strength. In the event of another correction, the moving average should again provide support. The moment the EMA 20 is breached to the downside, we can assume that the correction will continue to the EMA 50.
With the breakout to a new all-time high on Friday, the sideways consolidation formation was broken at the same time. In addition, the volume increased significantly on Thursday and Friday, which is also a positive or trend-confirming signal. In addition, the upper Bollinger band was broken and we see an opening of both the upper and the lower Bollinger band, which is a signal that the breakout will hold. If the index corrects to the breakout level at around 4800 points in the short term, we can assume that there is technical support. Should the support level not hold, the breakout would have to be interpreted - at least in the short term - as a false breakout, which would significantly increase the probability of an extension of the correction.
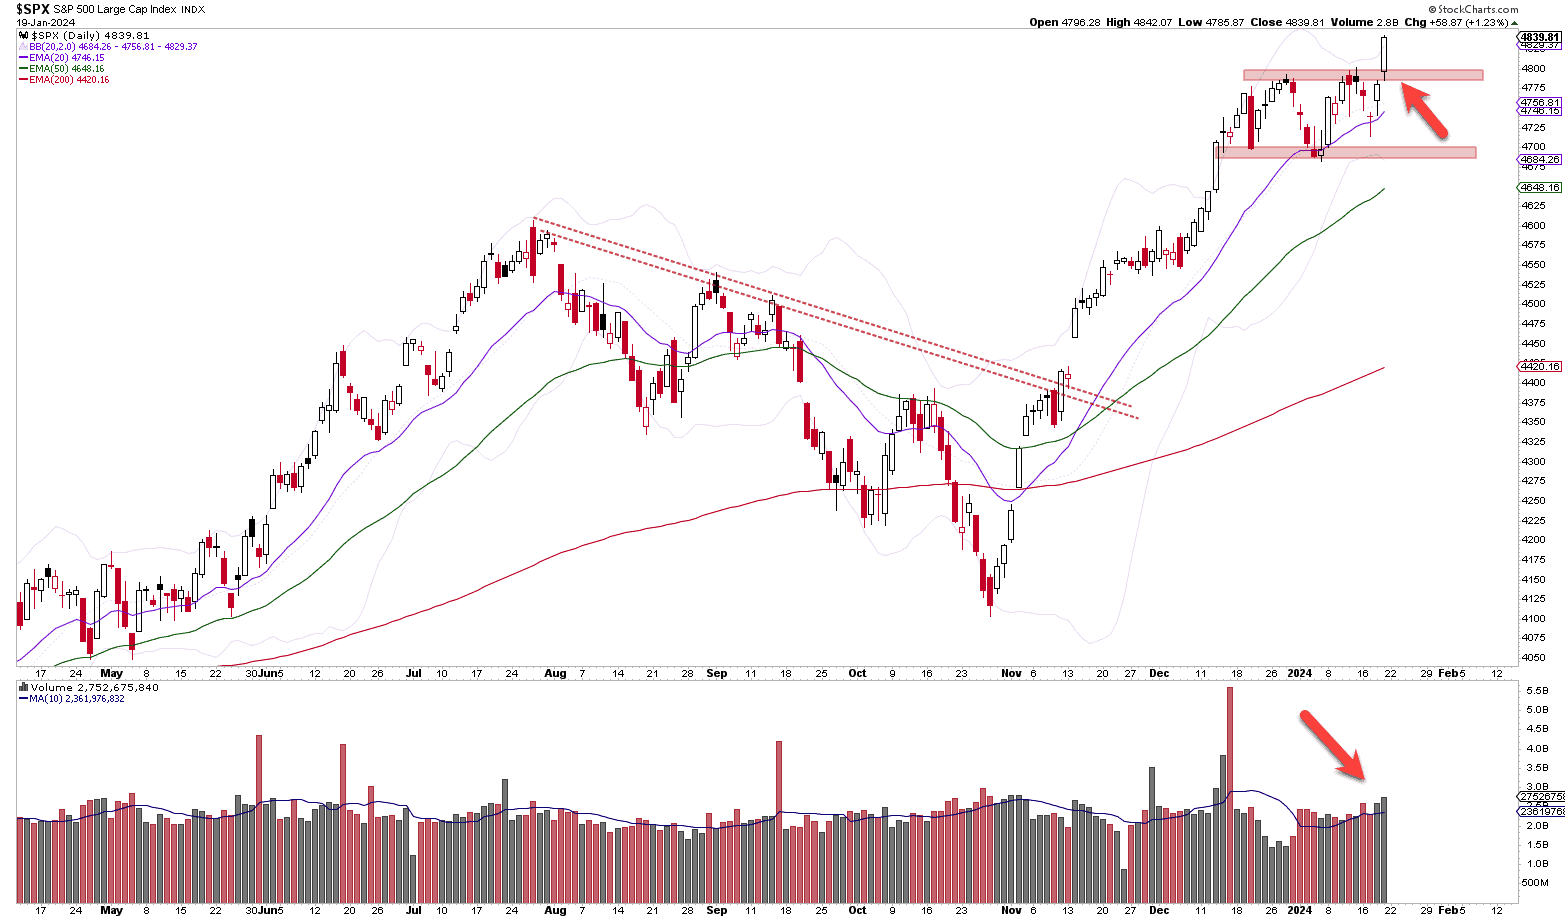
S&P 500 Index Daily Chart
Author: Tobias Schmid
Date: 22.01.2024