


TradingView has become one of the most widely used analysis platforms for traders and investors in recent years. The software combines charting, technical and fundamental analysis as well as community functions in a cloud-based environment. Thanks to the Connection to brokers such as CapTrader platform becomes the central trading environment for beginners and professionals.
In this article we present TradingView structured and neutral - from the central functions to use in conjunction with a CapTrader custody account.

The most important in a nutshell
- TradingView is a cloud-based platform for market analysis and charting
- Comprehensive tools for technical and fundamental analysis
- Can be used via browser, desktop app and mobile app
- Direct broker connection to CapTrader for order execution
- Free entry, expandable through paid subscriptions
What is TradingView?
TradingView is a web-based platform for analyzing financial markets. It is used by traders and investors to evaluate price trends, compare markets and develop and optimize trading ideas. The focus is on analysis - regardless of whether a trade is actually executed later.
Charts, indicators, watchlists and market data can be individually configured and used across all devices. This makes TradingView suitable as a central analysis interface for different trading and investment approaches.
Key features of TradingView:
- Cloud-based use without local installation
- Synchronization of charts, watchlists and settings
- Combination of technical analysis, fundamental data and market overviews
- Use as a stand-alone analysis tool or in conjunction with a broker
The modular structure allows TradingView to be used for both simple market observations and more complex analysis processes. It is therefore suitable for both Trading for beginners as well as for advanced and professional traders.

Company foundation and development of TradingView
TradingView was founded in the USA in 2011. From the outset, the aim was to provide professional analysis tools for financial markets via a browser-based application and thus supplement traditional, locally installed trading software.
In the course of further development, the platform was gradually expanded to include additional analysis functions and community elements.
Important key data on the development of TradingView:
- Founded in 2011 in the USA
- Original focus on web-based charting
- Expansion to include technical and fundamental analysis functions
- Expansion into a platform with an integrated trading community
- Over 100 million active users worldwide, according to the company
The growth of TradingView is primarily due to its flexible use, broad market coverage and continuous functional development.
What functions does TradingView offer?
TradingView provides a variety of analysis and organizational functions that cover different requirements in the trading and investment process. The range of functions extends from basic market observation to advanced analysis and automation tools.
Many central functions can already be used in the free model. Extended analysis, layout and automation functions can be activated via paid subscriptions, so that TradingView can be gradually adapted to your own level of experience.
In the following sections, we present the most important functions of TradingView in a structured way and show how they are typically used in practice.
1. TradingView on desktop, web and mobile
TradingView can be used via various end devices and thus adapts to different working methods in everyday trading. Regardless of whether analyses are prepared on the desktop or markets are monitored on the move, the platform accesses a central, cloud-based environment. Settings, charts and watchlists remain available across all devices.
Its use is deliberately kept low-threshold. TradingView can be accessed directly in the browser; alternatively, native applications are available for desktop and mobile devices.
Available versions of TradingView
- Web versionUse directly in the browser without installation
- Desktop appStand-alone application for Windows, macOS and Linux
- Mobile app: Apps for iOS and Android on the road for market observation
All versions access the same account and synchronize layouts, watchlists, indicators and alarms automatically.
Everyday use: TradingView Web vs. desktop app
The web version is particularly suitable for quick access to charts and analyses and is therefore ideal for spontaneous analyses. As it does not require prior installation, traders can use it conveniently from different devices.
The desktop app is primarily aimed at users who use TradingView regularly and intensively. It offers an independent working environment that is particularly suitable for structured analysis processes.
Typical areas of application for the desktop version:
- Use on multiple monitors
- Parallel working with multiple chart layouts
- Fixed analysis environment without browser dependency
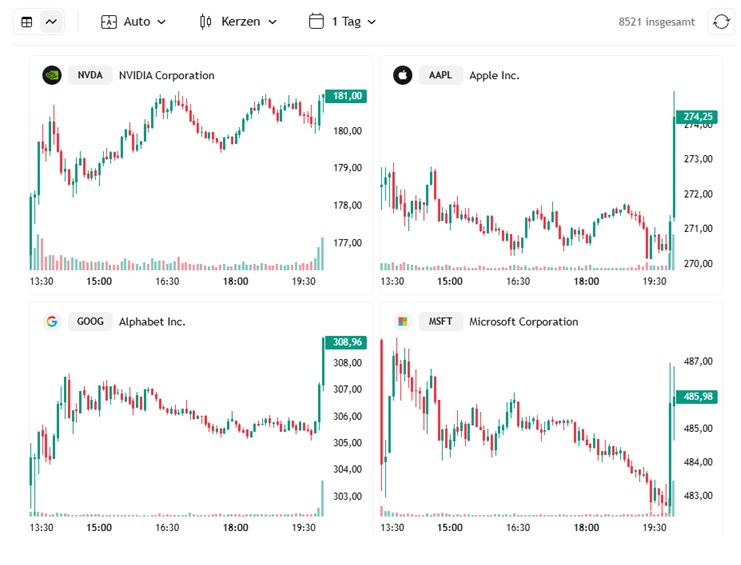
The TradingView mobile app is primarily designed for market monitoring and notifications. It allows you to access watchlists, charts and alerts on the go.
Typical use cases of the mobile app:
- Monitoring prices and markets
- Receiving alarms and notifications
- Short chart checks outside the workplace
Setup and initial access
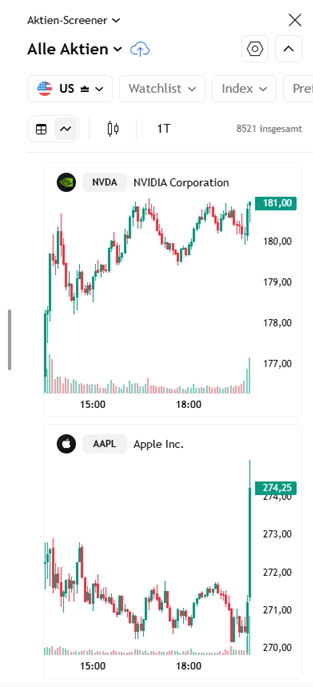
You can start using TradingView by creating a free user account. After logging in, basic analysis functions are immediately available. Many users set up a personal basic setup at the beginning to simplify recurring work steps.
Typical initial adjustments are:
- Creating watchlists for preferred markets or strategies
- Selection of a chart type and time interval
- Saving indicator and chart templates
- Activating initial price or time alarms
Basically, the software is intended as a central analysis environment; however, thanks to the quick setup and extensive personalization, TradingView is also very well suited as a supplement to other programs.
2. charting and presentation of price trends
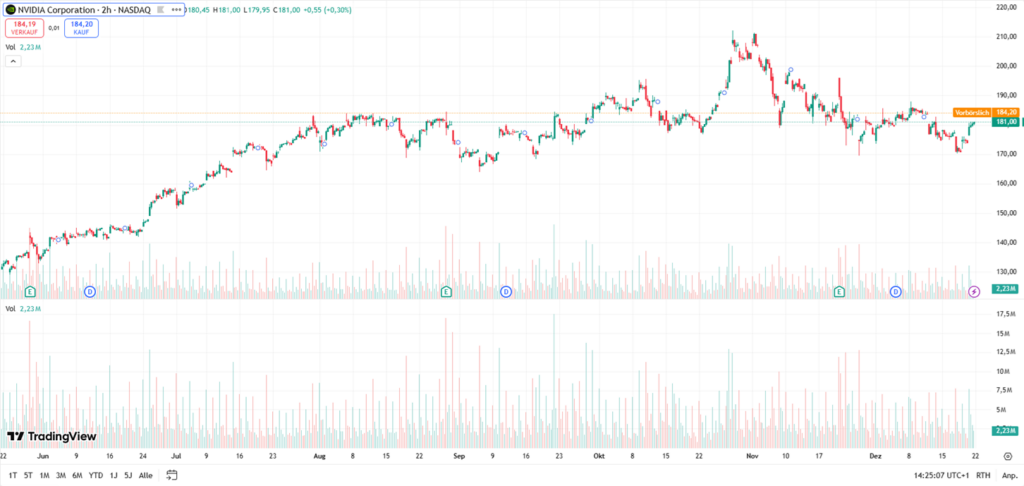
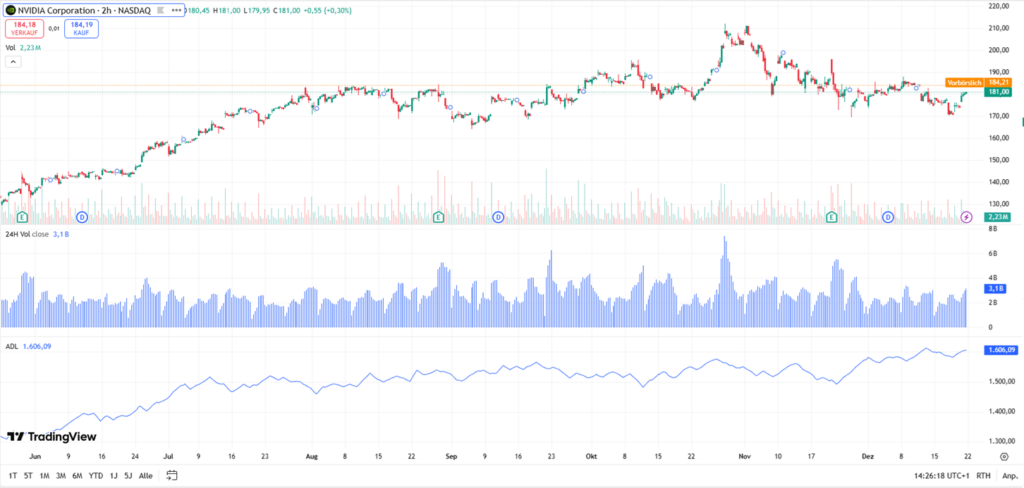
The Chart analysis is the central functional area of TradingView. Users can visually analyze price trends and depict different market situations using various display formats and time intervals. The charts can be flexibly adapted and individually configured.
The software provides a variety of chart types and layouts that are suitable for different analysis approaches.
Important chart functions at a glance:
- Various chart types (e.g. candles, lines, Heikin Ashi, Renko)
- Flexible time intervals from seconds to multi-year views
- Multiple charts simultaneously in freely combinable layouts
- Drawing tools for trend lines, supports and zones
Saving and reusing charts, drawings and layouts is of course also possible. This allows recurring analysis processes to be optimized.
3. technical indicators and analysis tools
In addition to the visual representation of charts and prices, an extensive selection of technical indicators is also available. They are used to analyze trends, momentum, volatility or possible support and resistance areas.
Users can combine and customize the indicators individually and thus Technical analysis perfect.
Examples of available indicators:
- Classic indicators such as RSI, MACD and moving averages
- Volume and volatility indicators
- Community-based indicators from the TradingView library
You can save your personal indicator combinations as templates and apply them to different charts. This facilitates recurring analysis over several markets or days.
4. fundamental analysis and company key figures
Extensive fundamental data provides further analysis options. This function is aimed in particular at investors who want to evaluate shares or ETFs on the basis of economic key figures.
The data can be displayed in tabular form or directly in the chart and compared with each other.
Typical available key figures:
- Price-earnings ratio (KGV)
- Sales and profit development
- Margins, growth and other company data
Fundamental data is used to compare companies within a sector or to better classify long-term developments.
5. watchlists and market overviews
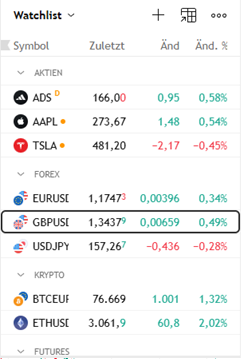
TradingView offers powerful watchlists and market overviews to monitor markets in a structured manner. They are individually adjustable and can be organized according to different criteria.
Such watchlists help to keep a permanent eye on relevant markets and react quickly to changes.
Functions of watchlists:
- Own watchlists for strategies or markets
- Sorting by price, performance or volume
- Quick access to charts and detailed views
Particularly useful: By combining several watchlists, traders can clearly structure their market observation.
6. screener and filter functions
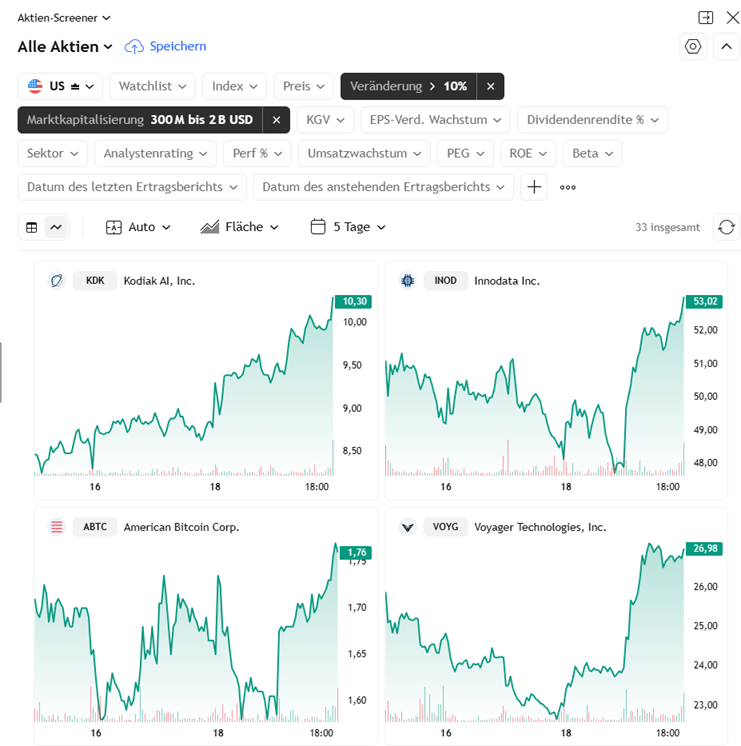
Integrated screeners are available to keep track of the large number of key figures and analysis tools. Users can use them to search individual markets according to specific criteria. This function is particularly suitable for finding ideas and preselecting trading instruments.
The filters can be flexibly adapted and combined.
Examples of filter criteria:
- Market capitalization and volume
- Price performance and volatility
- Fundamental key figures
Once you have discovered a suitable asset in this way, you can transfer it directly to a watchlist or analyze it with other tools.
7. economic calendar and news feed
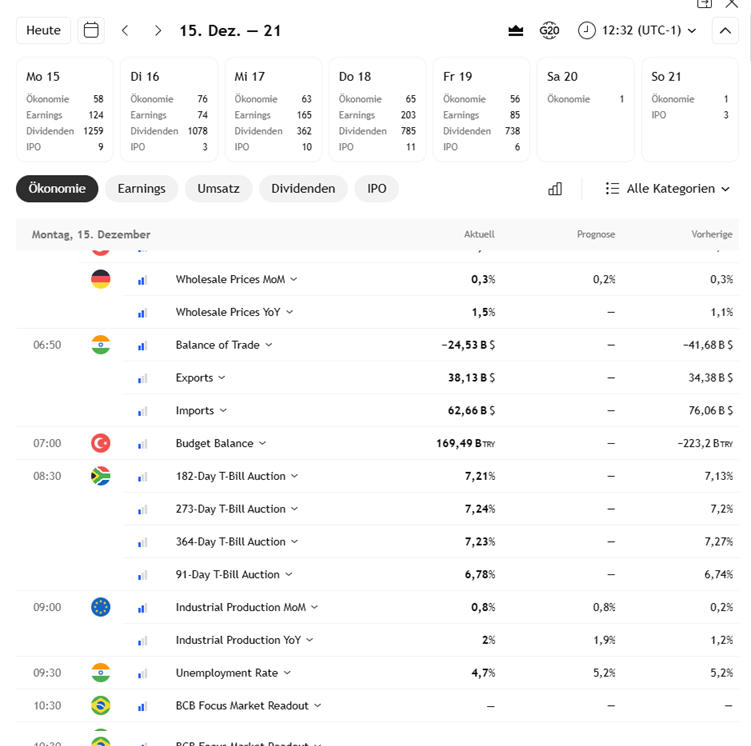
An integrated economic calendar and a news feed are available for classifying market movements. TradingView is therefore also very suitable for Newstrading and other strategies that focus on the latest news.
The calendar shows, among other things:
- Economic data
- Interest rate decisions
- Other relevant dates
The news feed bundles current financial news and is integrated directly into the analysis interface.
8. alarms and notifications
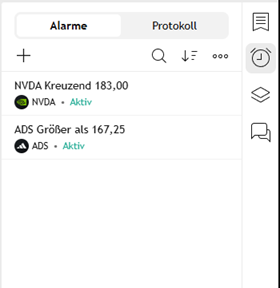
TradingView allows you to set up automatic alerts that draw attention to market movements. These notifications also work when the platform is not being actively used.
Possible alarm types:
- Price-based alarms
- Time-based memories
- Indicator or condition alarms
Notifications can be received via app or email and support continuous market monitoring.
9. community, ideas and public analysis
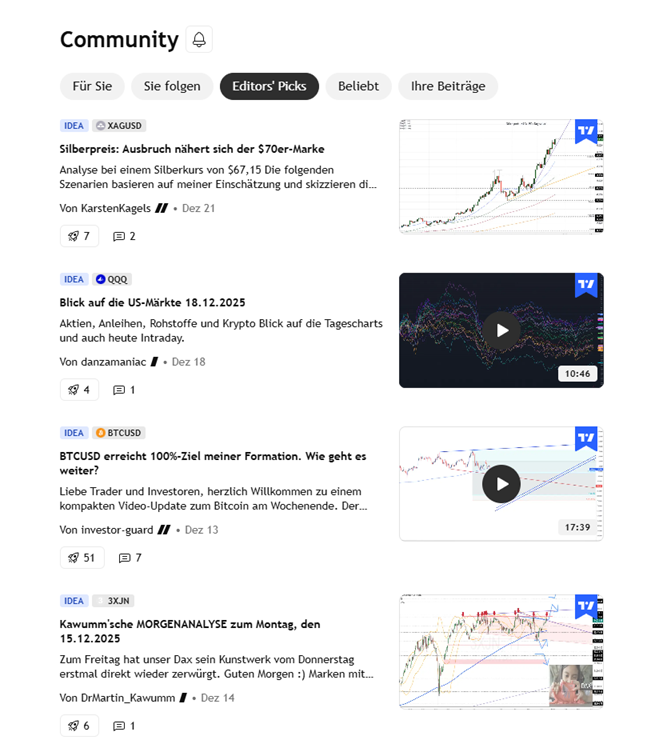
Another component is the integrated community. This is where users publish their own ideas, analyses or discuss with other participants. In addition to exchange and inspiration, this aspect of TradingView is also ideal for further training!
Community functions include:
- Public trading ideas
- Commentary and discussion of analyses
- Access to learning content and examples
Automation and Pine Script
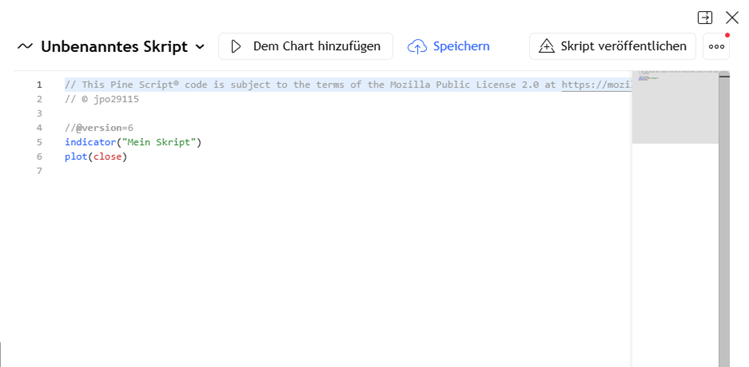
Pine Script is TradingVew's proprietary scripting language that allows users to develop customized analysis tools. It is directly integrated into the platform and enables users to create and test their own indicators, trading signals and strategies based on historical market data.
In contrast to traditional programming languages, Pine Script is specially designed to meet the requirements of technical analysis. The focus is not on general software development, but on the description of market conditions, indicators and fixed trading rules. This makes it suitable for users without in-depth programming knowledge.
Typical areas of application for Pine Script:
- Development of own technical indicators
- Creation of rule-based trading signals
- Mapping of fixed trading logics (e.g. trend or breakout approaches)
- Backtesting of strategies on historical price data
A key advantage of Pine Script is the ability to systematically check analysis ideas. Instead of interpreting signals manually, fixed rules can be defined and evaluated using historical data in order to better classify the behavior of certain approaches.
Advantages of TradingView
TradingView offers a range of features that make the platform interesting for different market participants. The advantages result primarily from the combination of analysis functions, technical flexibility and broad applicability across different markets and end devices.
- Broad coverage of markets and asset classes: TradingView supports almost all relevant financial markets - from shares and ETFs, indices and commodities to cryptocurrencies, futures and options. This allows different strategies to be mapped within one platform.
- Powerful and flexibly customizable charting: Users can configure charts individually, use different display formats and save their own layouts. This enables structured and repeatable market analysis.
- Combination of technical and fundamental analysis: In addition to technical indicators, extensive fundamental data is also available. This combination makes it possible to analyze markets in both the short and long term.
- Cloud-based use across all end devices: TradingView can be used in the browser, as a desktop application and as a mobile app. Watchlists, charts and settings are automatically synchronized and remain available at all times.
- Modular entry and scalable range of functions: Many basic functions can be used free of charge. Advanced analysis, layout and automation functions can be added via subscriptions if required.
- Integrated community and exchange of ideas: Public analyses, trading ideas and discussions provide insights into different market approaches and can contribute to your own further education.
This combination makes TradingView suitable for both simple market observation and structured analysis processes. The actual added value depends largely on how specifically the functions are used.
Who is TradingView suitable for?
TradingView is aimed at a broad target group of market participants and can be flexibly adapted to different levels of experience and trading approaches. The modular structure of the platform allows users to decide for themselves which functions they want to use and how complex their analysis environment should be.
The possible applications vary depending on prior knowledge, market understanding and objectives.
Typical user groups of TradingView are:
- Beginner, who want to monitor markets and perform basic chart analysis
- Advanced traders, who systematically use technical indicators, alarms and watchlists
- Investors, that combine technical and fundamental data
- Active market participants, that use recurring analysis processes or rule-based approaches
TradingView makes it comparatively easy for beginners to get started, as basic functions are available free of charge and can be used directly in the browser. Advanced users benefit above all from the high level of customizability and the ability to standardize analysis workflows.
The decisive factor for meaningful use is not so much the range of functions themselves, but rather the clear definition of the purpose of the application.
Possible disadvantages of using TradingView
The wide range of functions also comes with certain requirements that should be taken into account when using the platform. These result less from technical limitations than from the scope and structure of the platform.
Typical points that users should plan for:
- Very large range of functions can seem confusing at first
- Extended functions are linked to paid subscriptions
- Real-time market data is partly subject to a charge
- Analysis functions must be considered independently of subsequent order execution
New users in particular benefit from gradually developing TradingView and initially concentrating on a few predefined functions. Without a clear strategy, there is a risk that too many tools will be used in parallel.
TradingView should therefore be seen less as a „ready-made solution“ and more as a flexible analysis platform whose benefits depend heavily on individual use.
TradingView in conjunction with CapTrader
TradingView is first and foremost an analysis platform. However, the software can be connected to a broker for actual order execution. Such a connection exists with CapTrader, which allows analysis and trading to be combined in one interface.
By connecting a TradingView account with a CapTrader depot trading ideas that arise directly in the chart or via indicators can be implemented without media discontinuity. Analysis, signal recognition and order placement interlock without having to switch between different applications.
Typical applications of the TradingView-CapTrader connection:
- Direct order execution from TradingView
- Use of live trading and paper trading
- Connection of the TradingView analysis functions with the CapTrader trading offer
- Efficient workflow from market analysis to implementation
Please note that TradingView can only reflect the product and trading offer of the connected broker. Available markets, order types and trading venues therefore depend on the respective CapTrader account.
CapTrader provides a separate guide for users who would like to understand the setup and functionality of the connection in detail. This explains step by step how to connect TradingView to a CapTrader account and what requirements are necessary for this.
Connecting TradingView with CapTrader - instructions and details

Conclusion: TradingView as a versatile analysis platform
TradingView has established itself as a versatile platform for analyzing financial markets. The combination of powerful charting, technical and fundamental analysis functions and flexible use via web, desktop and mobile makes the software interesting for different types of investors.
The modular structure enables a step-by-step introduction and individual adaptation to your own analysis requirements. In conjunction with a broker such as CapTrader, TradingView can also be used not only for market observation but also for the direct implementation of trading decisions.
A clear objective remains decisive for the added value: TradingView unfolds its strengths above all when functions are used in a targeted and structured manner.
