


With the technical analysis retailers can use the Estimate movements in shares and other assets. Although the basics are quickly explained, there are few practical instructions.
We want to change that! In this guide, we will help you to learn technical analysis using shares as an example and put it into practice. To do this, we will look at the basic methodology, explain it using a few examples and give you additional tips and tricks along the way.

The most important in a nutshell
- Technical analysis is the study of prices and trading data using patterns and indicators
- Properly executed, it allows traders to predict price developments and trends as well as their strength with statistical evidence
- There are hundreds of calculation methods and patterns available - we will limit ourselves to the most important ones
Basics of technical analysis
The Technical analysis, also known as "chart analysis", is a generic term for various methods used by traders to analyze stock market prices. The aim is to, to derive useful information and use it for lucrative trades.
This involves looking at the prices of shares, indices, short-term bonds or other assets. This is a mainly visual examination, where traders use a variety of calculation methods and key figures that they compare with the chart.
The results can be used to Forecast movements (trends) on the stock market. The method is also very suitable for determining entry, exit and hedging points.
Because we have Access to a gigantic treasure trove of historical dataThe stock market prices for millions of shares, commodities, currencies and other investment classes from the last few decades can be viewed at any time.
All movements have "been there before" and repeat themselves regularly. If we discover such patterns that have already occurred in the past, we can assume that further developments will also similar in the present will proceed.
Technical analysis looks at several such patterns and key figures at the same time. If they point in a specific direction, the result is a forecast with a high degree of accuracy - provided the right numbers have been selected!
CapTrader can do that:
Millions of stocks and other assets are available for technical analysis - if you use the right broker! With CapTrader you have access to over 1.2 million shares, more than a million bonds, options, futures, 100 currency pairs and more!
Which and how many indicators should I look at?
The huge selection of possible indicators presents traders with a fundamental problem when it comes to technical analysis: How many key figures should I look at? One? Ten? One hundred?
It is not possible to give an exact figure, but a Approximate value! First of all, it can be said quite clearly that you do not rely on just one indicator should. Technical analysis is not an exact science (even if it can appear very mathematically-accurate)!
The various Calculation methods are therefore not one hundred percent accurate. In practice, this could look like this, for example: The "MACD" indicator clearly shows rising prices for a share, but the price still falls.
The result is by no means that the MACD is useless; it gives a correct signal in the majority of cases, but not 100 percent of the time. In addition, it can always happen that we get a Key figure determined incorrectly and, for example, have not set key points (high points, low points ...) correctly.
Now one could assume, the more indicators is used for technical analysis, the better will be the results. However, this would also be not correctbecause above a certain quantity, further key figures do not provide any additional insight.
In this case, the market is viewed from to many angles at the same time! This results in an unnecessary Complication - However, the aim of technical analysis is precisely the opposite, namely to simplify and deliberately ignore the numerous influences and disruptive factors.
The absolute Minimum should be around three numbers; with more than 20, "overkill" is clearly reached. Much more important than the number, however, is the quality: the most rewarding are the Key figures with the highest accuracy! You must also ensure that you can apply and interpret the indicators correctly.
For this reason, the "Standard key figures" particularly well proven: They are suitable for beginners easy to understandbut even for professional traders greatest importance. You also form the Basis for more complex calculations and are indispensable for this reason alone!


What you should bear in mind
The Technical analysis is considered Scientifically controversial: There is no evidence of general success, which is mainly due to the fact that there are No one, ultimate analysis method gives.
Different traders look at the charts with different objectives, use different key figures with different precision and achieve different results. often poor results, This means that they do not succeed in outperforming the market as a whole.
To make matters worse, not all of the many hundreds of possible key figures and analysis methods are suitable for all asset classes. With the right combination of indicators and patterns, however, conscientious traders may well be able to outstanding results achieve!
This ensures that the technical analysis from lots of trial-and-error exists. If you have developed a new hypothesis, you should not test it directly on the stock market! The probability of failure is high and the result is a corresponding financial loss.
We therefore strongly recommend, Your strategy on our Demo account to testThere you can use CapTrader's huge range in a real environment with "play money" without jeopardizing your real capital. If you are successful with a combination of different indicators, the Switch to a Regular depot quickly and easily.
Such a test account is still useful even if you have already found a suitable strategy! This is because changes in the markets and in the behavior of traders will adjustments are always necessary. So when it comes to chart analysis, you can't rest on your laurels for long!
If the Too much stress and effort is possibly a another strategy is more suitable for you - and does not necessarily go hand in hand with lower earnings! Long-term investors who, for example, have a Share savings plan for asset accumulation achieve very good returns on average!
CapTrader can do that:
We provide you with the right tools for your strategy, no matter what it looks like! With our professional trading programs such as TradingView, AgenaTrader or the Trader Workstation and our award-winning Trading App you are ideally equipped and can analyze the charts to your heart's content!
Practical application of technical analysis
In the following we want to Technical analysis based on practical examples demonstrate. To do this, we use four standard indicators that every trader should be familiar with, as well as a group of patterns in candlestick charts that can provide additional impetus.
To illustrate this, we analyze the prices of some well-known blue chip shares. The Technical analysis of shares is probably the most common application. Both private investors and traders who Shares for day trading or other strategies use these methods.
1. volume
One of the most fundamental aspects of technical analysis is the Trading volume. How many shares are bought and sold can make a big difference. about possible trends, changes of direction and more. The volume can also be recorded very easily.
Most trading programs, such as the popular "TradingView", offer Various display options for the volume on. One Simple bar chart in green (higher number of buy orders) and red (higher number of sell orders), where the bar height represents the respective volume, form the standard.
In practical application, the following in particular Increase or slump in trading volume interpret well. Typical signals for technical analysis are
- After a phase of prices moving sideways, the volume suddenly rises sharply. An imminent price movement (rise with high buying volume, slump with selling volume) can be assumed.
- During a strong price movement, the associated trading volume collapses. Traders could now assume that the trend will also stop and possibly even reverse.

The breakout in the candlestick chart is accompanied by a corresponding volume in the bar chart below.
In addition, the Volume particularly useful, to assess the strength of a movement. A higher trading volume indicates a correspondingly strong trend; low volumes or declines can indicate an equally weak trend.
The volume can be used to Determine further indicators. For example Volume-price trend indicator Useful information for confirming trends or determining a Stop-loss order. The VPT naturally needs the trading volume as a basis for this.
2. volatility
The Volatility presents the Fluctuation range of share prices and is also a standard value that traders examine in technical analysis. In contrast to volume, however No simple, clear key figure are available for measurement.
Specifically for equity trading in the S&P 500, the VIX an excellent opportunity. This Volatility index tracks the fluctuation range of the US indices and is particularly popular with options traders. This is because you cannot trade the volatility index itself, but you can use it as an underlying for VIX options available! Also a Hedge trading with VIX options is a popular form of application.
If you are interested in this exciting trading option, we recommend taking a look at our large "Trade options" guide!
But Equity investors can also use the volatility indexin order to fluctuations in the market. Such an index is also available for the German DAX in the form of the VVDAX.
Particularly popular for capturing volatility in technical analysis are the Bollinger bands. They are generated by calculating a simple moving average (period: 20 days), from which the standard deviation of the share is determined. The result is Corridor that encloses the share price.
In case of increasing volatility, the corridor widens/The bands move away from each other. With The reverse is true for falling vola. The tapes can be used flexibly and are not tied to a specific index. They are among the Standard indicators of technical analysis and are used in trading programs such as TradingView easy to find.
Other options for determining volatility, such as the Average True Range indicator, are also available. Regardless of how you determine the fluctuation margin: You need to define your Then interpret the results, to derive trading signals.
The typical interpretation reads:
- High volatility leads to higher riskas a position can quickly run into the loss zone due to the strong fluctuations and trigger your stop-loss order there. At the same time, however, high profits are also possible.
- Low volatility can be a warning signal for a sideways movement or a general phase of low movement. This is particularly the case when low values are accompanied by other signs, such as low trading volumes.
- If volatility increasesthis could indicate that the current trend comes to an end. At this point, it may make sense to place corresponding take profit orders in order not to lose your book profits.
3. EMA and MACD
The "Exponential moving average" (EMA) is a Variant of the moving averagewhich is very popular in technical analysis. More recent values have a greater influence, while prices further back lose importance. It is therefore also referred to as "weighted moving average".
The practical application of the EMA is versatile; one of the simplest ways is to view the value over a period of 200 days. If the share price crosses this long-term EMA, traders assume that the imminent trend reversal out. This would be the time to close positions or hedge the profits made.

Preparing for the reversal by taking new positions is also an option at this point. The weighted moving average is particularly useful to confirm assumptionsthat you have gained from other technical analysis indicators.
Because the value always lags somewhat behind the current share price and therefore offers the opportunity, hypotheses in retrospect. The indicator therefore explains "why the price is where it is" and thus provides background knowledge.
It is therefore not surprising that traders who Shares for day trading like to use the EMA. They use the indicator to determine the general direction of the respective day - for short-term trading decisions and the However, it is rather unsuitable for determining trends.
The EMA also forms the Basis for the MADC indicator. It is also one of the basics of technical analysis and can help to determine buy and sell signals.
We obtain it by subtracting an EMA with a duration of 26 days from another EMA with a duration of 12 days. To this we add another weighted moving average with a term of 9 days - the so-called "signal line".
Trading impulses are generated by the movements of the two lines in proportion. Especially the Crossing of MACD and signal line is considered important sign! If the MACD line crosses the signal line from bottom to top (i.e. is subsequently higher than the signal line), this is a buy signal.
An inverted crossover (MACD was above the signal line and is now crossing it to the downside) indicates in the technical analysis that price losses are imminent. At this point, it would be advisable to close long positions or Short sale meaningful.


4. relative strength index
The Relative Strength Index (RSI) should not be missing from the "toolbox" of technical analysis! It is ideally suited for Assessing the strength of a trend movement and at the same time can reveal exaggerated - and therefore risky - trading figures.
The presentation is made as Oscillator that fluctuates between the extreme values 0 and 100. Put simply, it increases the stronger and longer the share price rises and decreases the stronger and longer the share price falls.
An RSI of over 70 is generally regarded as a sign of a "overbought" market, while values under 30 as "oversold" apply. However, these guide values may shift somewhat in times of major trends (e.g. recessions, stock market rallies, etc.).
These signals can play an important role if you want to buy the share in question: In many cases, the Purchase of a security with an RSI above 70 (overbought) did not lead to the desired successes. Here would be a low value (below 30) is desirable.
Conversely, most traders would advise against investing in a fund with an RSI of 30. Short sale as prices could rise soon.
Longer high and low phases are certainly possible; if you discover such extreme values of the RSI during technical analysis, caution is advised: The The probability of a trend reversal is then considerable!
5. candlestick chart pattern
Technical analysis repeatedly shows that simple, optical patterns, which, despite their small size, can be astonishingly informative! For this the View as candlestick chart necessary, as this form conveys more information than a line or bar chart, for example.

Candlestick charts provide a wealth of information and are therefore particularly useful for technical analysis.
In the following, we will take a look at some simple candle formations that only from two to three candlesticks exist:
- "Three-part reversal/three-corner reversal": A particularly clear formation, which Trend reversal indicated. A candlestick with a pronounced body is followed by a second candlestick that continues in the same direction but already has a smaller candlestick body. This is followed by a candlestick in the opposite direction, which clearly identifies the new trend.
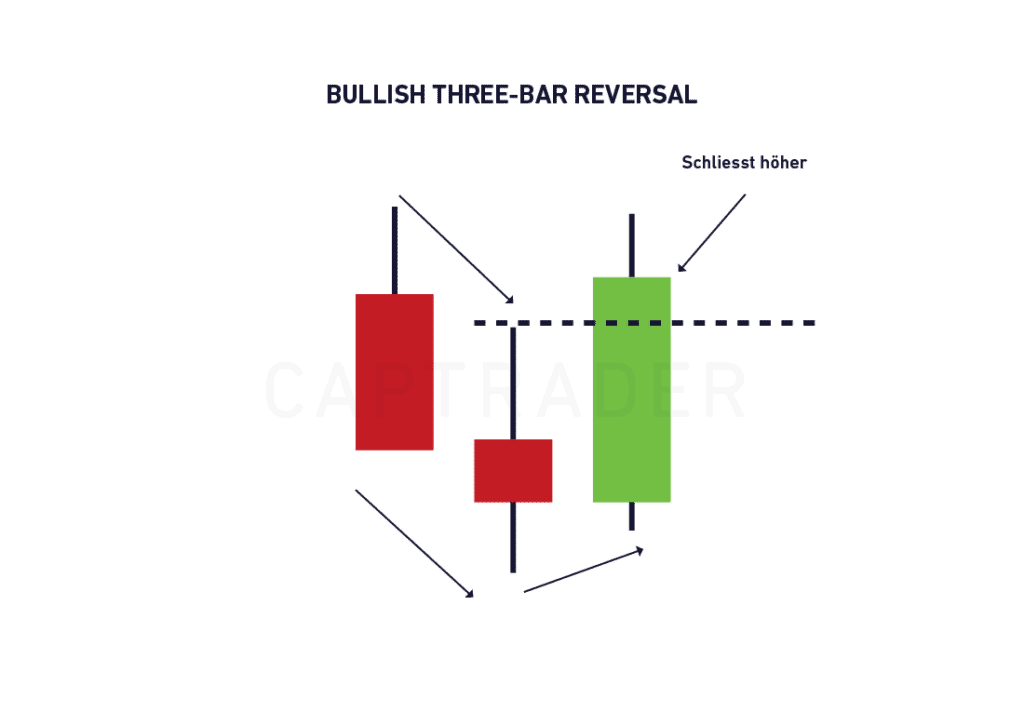
Traders can use such a formation to Buy above the last candleif it is a bullish variant (downward trend turns into an upward trend) or sell below the last candle, when a Bearish shape is available.
- "Exhaustion candle": In this pattern, we first encounter a gap between two candles, where the second candle closes close to the high/low. The formation shows that the respective direction (bullish/bearish) is exhausted and a trend change is imminent. In practice, you can now buy above the bullish exhaustion candle or sell below the bearish exhaustion candle.

- "Reverse candle"It occurs in a bullish variant when the low of the subsequent candle is below the previous one, but the closing price is higher at the same time. With the bearish reversal candle, the situation is exactly the opposite. Both forms are a possible Signal for an imminent trend reversalto which you can react by taking appropriate positions.

Conclusion: technical analysis is also suitable for beginners
With the technical analysis we consider the courses of an asset in order to identify trends and find suitable entry and exit points. This method is also helpful for risk management, as it allows us to determine the right position for a stop-loss order, for example.
This works through the Comparison of prices with special patterns, the Creating different calculation methods and the consideration of additional data such as trading volume. If several such indicators point to a price movement, we can place a suitable trade and profit if the forecast is correct.
The correct application of the key figures is much more important than their mere number! At the same time, however, you should not rely on a single value alone.
In practice, it is above all the "Default values" such as the weighted moving average, MACD and the relative strength index. They are considered easy to master and allow useful assessments of trends, changes in direction and the strength of movements.
In addition, some simple candlestick chart patternwhich also indicate movements and changes. In combination, this provides a relatively reliable picture of the possible price trend.
Traders are well advised, also pay attention to values such as trading volume and price volatility. These obvious indicators say a lot about market sentiment and the strength of trends.
With a sensible mix of indicators and key figures, technical analysis can deliver good results. In our article Trading signals we present further interesting possibilities.
