


In volume trading, traders take a close look at the volumes traded on the stock exchange. Several key figures and derivations help to predict market movements. Often underestimated, analyzing trading volume can be an important component of successful trading strategies.
Below we present the most important key figures and show you how you can use trading volume as an indicator.

The most important in a nutshell
- Volume trading describes the analysis of trading volumes with the aim of deriving trading signals, confirming trends or simply gaining an insight into market sentiment
- The volume alone provides interesting data. Key figures derived from this provide further insights
- On Balance Volume (OBV), Chaikin Money Flow (CMF), Klinger Oscillator, and Accumulation/Distribution (A/D) are the most important volume indicators
- It is important never to use such indicators in isolation and, as with all forms of technical analysis, to exercise healthy caution
What is volume trading?
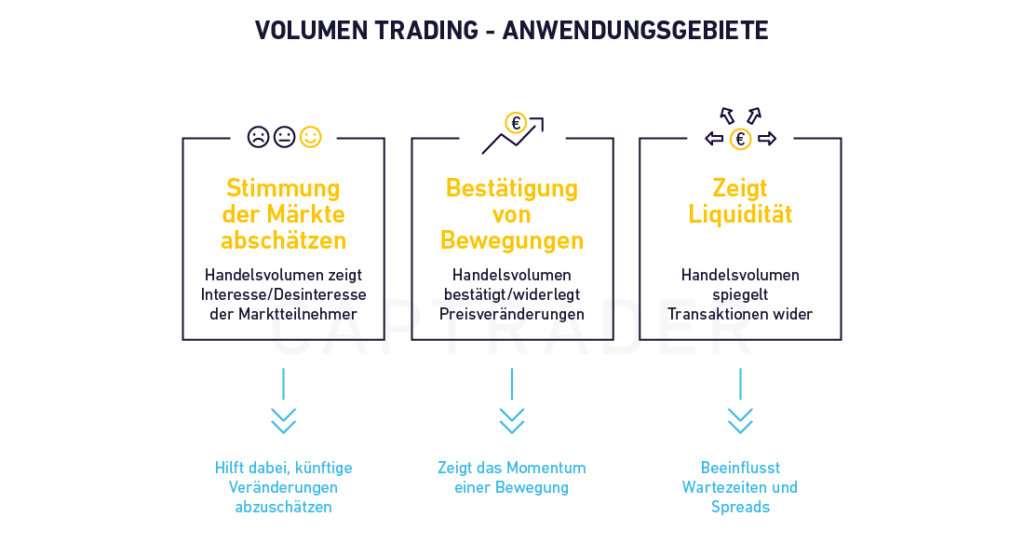
Volume trading is based on the assumption that a high or low trading volume could be an indicator of future market developments. It helps traders to estimate the buying or selling pressure acting on an asset.
- Through volume chart analysis, we try to determine where capital is flowing on the stock markets.
- Stock market prices are created by supply and demand. If many shares, futures or other assets are bought, their price rises.
- If, on the other hand, only a few assets change hands, the price remains low.
- By recognizing high or low demand, we can, at least in theory, also estimate the coming price trend.
- The number of transactions should also help to estimate the strength of a price movement and determine how much momentum it has.
Trading volume is particularly important for traders: Most key figures of the Chart analysis are derived from the price of an asset. They are therefore rather self-referential and lag behind the market. However, the volume is independent of price developments and thus offers a new and direct dimension.
Important:
If we look at volume in isolation, it has only limited informative value. We first have to put it into context with other values (time, price of the asset, development of the market as a whole...).
Traders use a variety of calculation methods, additional data and powerful charting programs such as Trader Workstationto evaluate the volume in a meaningful way.

Trading volumes also indicate how liquid the market is and how quickly we can buy or sell an asset. This also influences the bid-ask spread, i.e. the price difference between the buy and sell price on the stock exchange.
Volume trading is a sub-category of Chart analysis (technical analysis): As with other forms, for example the Day trading charts or trend analysis, is an attempt to predict the price development by looking at past prices. If the trading volume is high, it is likely that the price will soon return to the starting range.
Attention!
Volume trading, like all forms of chart analysis/technical analysis, is controversial. There is no scientific evidence that price trends can be predicted on the basis of past or current prices.
Trading with the volume trading strategy
Looking at the trading volume of an asset is part of the standard repertoire for active traders. In addition, volume analysis has a very different significance for different approaches:
- Those following a breakout strategy, for example, will look particularly closely at the trading volume: a continuous rise over several days could indicate an imminent breakout to the upside.
- Falling volumes, on the other hand, indicate reduced market interest. The result could be a price slump (especially after a longer upward trend) or a longer phase of sideways movement.
- Shorter observation periods can also provide exciting insights: For example, if a share always records a high volume at the start of trading, this can form an ideal entry point for an opening range breakout strategy.
- Especially for high-speed transactions, such as Scalping strategieschanges in volume are important signals.
- Some traders prefer periods of low trading volume, as low volume is usually associated with low volatility, which in turn is beneficial for some strategies.
Good to know:
For long-term investors who, for example, want to build up a portfolio of high-dividend shares or similar, the volume of trading is of little importance.
The use of volume trading, just like other technical indicators, requires a certain amount of expertise and experience. Ideally, the various volume indicators are combined with other indicators such as moving averages or trend lines.
Using these tools correctly and in combination is not easy for beginners. We therefore recommend volume trading on a Paper Trading Account before you use it to trade your actual assets.


Special case Forex
For shares, futures and similar products, the trading volume is very easy to understand: The number of transactions is recorded centrally and we can easily retrieve the data. However, the situation is somewhat different with forex trading:
- Currency transactions are conducted over-the-counter (OTC) and not centrally at a trading center.
- Information on the total trading volume of a currency pair worldwide is therefore not available.
- Nevertheless, high-quality trading programs such as TradingView a volume for currencies.
- However, this is only the amount that has been traded with your broker by other clients!
In order to use volume figures successfully for forex strategies, you should therefore pay attention to the following points:
- The size of your broker is crucial: Small, regional brokers manage smaller assets, of which only a fraction is invested in currencies. The volume figures are therefore often highly distorted and do not reflect the actual interest of the markets. Many seemingly larger providers (e.g. house banks, neobrokers) are also out of the question, as their customers hardly ever trade forex. CapTrader, on the other hand, uses trading data from Interactive Brokers, one of the largest providers of currency pairs worldwide. As a result, we have a broad database and can offer accurate volume data.
- Pay attention to time aspects when using regional brokers: You can trade currencies around the clock, i.e. even at times when other traders are inactive. This is not a problem with international providers such as CapTrader, but a broker that is only active in one time zone (for example, only in Germany) is subject to strong time fluctuations. When trading at night, in the early morning and at some other times, the trading volume can be particularly low. Be careful not to falsely attribute low/high volumes to market interest when they are actually just time variances. Or avoid this problem completely by using a Depot with CapTrader.
- Tick as volume indicatorIn forex trading, the "tick" is the more common liquidity indicator. This smallest possible change in the currency price allows indirect conclusions to be drawn about the trading volume. The assumption here is that a larger quantity of ticks stands for greater trading activity. Volume trading in currency transactions therefore usually combines the pure volume (according to the broker) with the ticks and other indicators.
Volume trading strategies: Which indicators are suitable?
The absolute trading volume over a certain period of time has only limited informative value. However, if it is put into context with other values, a large number of indicators can be formed. We would like to present the most popular and - in our opinion - most useful ones below.
1. on-balance volume (OBV)
The on-balance volume is an absolute value that is calculated from a simple formula every day at the close of trading:
- Price closes higher than the previous day: The trading volume of the day is added together.
- Price closes lower than the previous day: The trading volume of the day is subtracted.
This creates a Chart line that can help to forecast future movements. If the OBV rises, this indicates strong pressure from buyers and may herald an upward trend. Conversely, a falling OBV indicates disinterest on the part of market participants and suggests an imminent price slump.

It is possible to calculate the OBV at shorter intervals, for example half-dayly or hourly. However, this option is rarely used; the on-balance volume is usually calculated on a daily basis and is therefore not suitable for fast forms of trading such as the Scalping hardly suitable. With various Day trading strategies However, the key figure can play an important role in the case of
2nd Klinger volume oscillator
The Klinger Volume Oscillator (KVO) allows us to correlate actual price movements and trading volumes. The basic idea:
- A combination of price movement and corresponding volume should indicate a strong trend.
- However, if the volume contradicts the price trend, a reversal could be imminent.
- The KVO is an oscillator, which means that it moves between two fixed extreme values.
- The minimum is minus 600, the maximum is plus 600.
It is calculated by subtracting a longer-term exponential moving average (usually 55 days) from a medium-term exponential moving average of the trading volume (usually 34 days).

This compensates for short-term deviations and focuses more on the relationship between price and trading volume. At the same time, the time periods are selected in such a way that the KVO does not react too sluggishly and has a real, practical benefit.
In addition, a signal line is added to the oscillator, which consists of an exponential moving average of the KVO over the last 13 days. This line is used for interpretation and helps us to find interesting entry and exit points. Traders become particularly alert when the oscillator and signal line cross:
- If the oscillator crosses the signal line upwards (the KVO was previously below the signal line and is now rising above it), this indicates a bullish price trend.
- Conversely, a downward crossing is considered a bearish trend.
The calculation of the Klinger Volume Oscillator is quite complex. Fortunately, manual calculation is not necessary: you will find the KVO among the analysis tools in all professional trading programs.


3. chaikin money flow
The Chaikin Money Flow (CMF) indicator, named after the successful trader Marc Chaikin, measures whether buying or selling pressure prevails for an asset. To do this, it relates the closing price to the price range (difference between the highest and lowest price of the day).
It is usually calculated for a period of 21 days, but other periods are also possible on request. The formula is: agen, but different periods are also possible on request. The formula is

This figure is multiplied by the volume of the respective interval (usually one trading day).
Repeat this process for every 21 days (or desired period) and divide the total result by the sum of the trading volume for all 21 days.
The result is a value between +1 and -1, with extreme values occurring rather rarely. Typical values are between +0.50 and -0.50.
Here too, the effort required for manual calculation is enormous, but fortunately not necessary: Trading programs offer the CMF by default and without manual calculation.
In practice, the CMF is a useful indicator for confirming an existing forecast. Values above zero indicate buying pressure and can underpin an upward trend. Negative results, on the other hand, indicate selling pressure and confirm a downward trend.
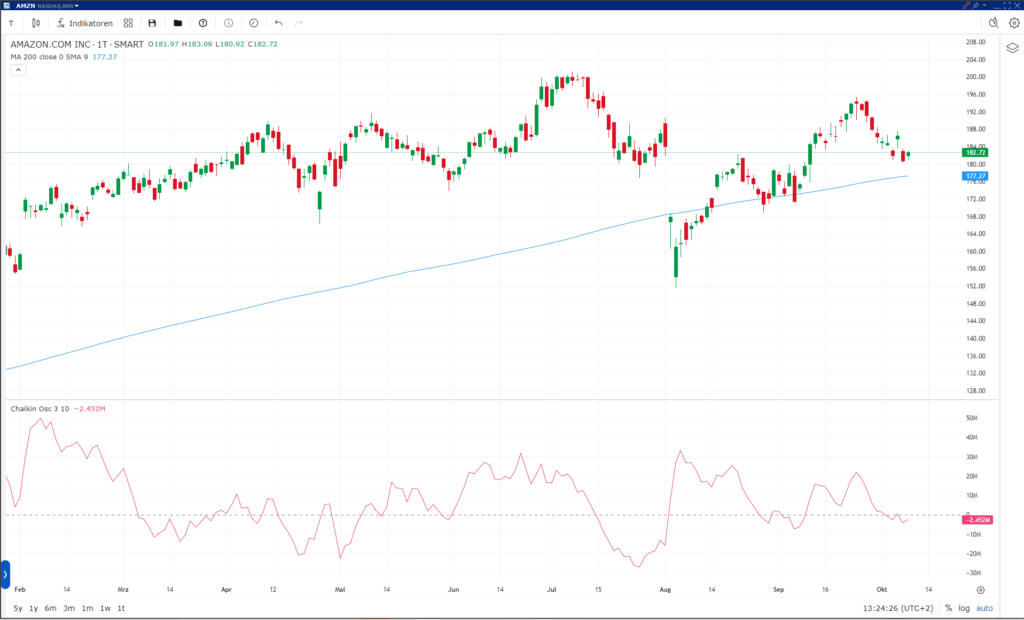
If Chaikin Money Flow and the current price movement do not coincide, this indicates an imminent change in direction. In addition, the CMF can also represent the strength of a trend: The closer the result is to one of the extreme values, the more pronounced the interest/disinterest of the markets is likely to be.
Accumulation/Distribution
The accumulation/distribution indicator shows whether an asset is accumulated or distributed.
- This is done by comparing the closing price of an asset with the price range of the trading day.
- If the closing price is closer to the highest price of the day, this indicates buying pressure - market participants want to own the asset and accumulation occurs.
- If the price at the close of trading is closer to the low point of the day, investors are more likely to want to sell the asset - there is a distribution.
- The calculation is carried out by a trading program and results in a line graph, which is traditionally displayed below the price.
Like almost all key figures in volume chart analysis, the A/D indicator is also intended to help us estimate and confirm/refute the strength of a trend. The steeper its line, the stronger the current movement. Due to its rather short-term nature, it is very well suited to recognizing a trend reversal.
It is similar to the on-balance volume, as it also links volume and price. In contrast to the OBV, however, the Accumulation/Distribution indicator does not look at the previous day's prices. This special feature can be both an advantage and a disadvantage!
Attention!
The A/D reacts very quickly to changes and is therefore also suitable for rather fast trading strategies. However, false signals can easily occur if it is viewed in isolation, as large jumps between trading days, for example, are not included in the result.
As with all volume trading indicators, it can therefore best realize its potential in combination with other indicators.


Conclusion: Volume trading strategies for recognizing trend strengths and reversals
Trading volume is an important indicator for traders: it shows how high the demand for an asset is and should therefore allow conclusions to be drawn about trends and their strength. Volume trading strategies rely on the information provided by the trading volume.
When trading, looking at the trading volume should bring three advantages:
- better assess the mood of the markets.
- Finding good entry/exit points in trading and confirming or refuting theories.
- Shows the trading volume and thus allows waiting times and spreads to be estimated.
Please note: There is no clear evidence that volume trading (or other forms of chart analysis/technical analysis) can predict price movements!
Only point 3, the estimation of waiting times and spreads, is verifiable. For all other uses of volume trading strategies, healthy caution is therefore required. You should never consider such key figures in isolation, but always put them into context with other information.
A variety of indicators are used to develop useful forecasts from the volume. On-balance volume, the Klinger volume oscillator, Chaikin money flow and the accumulation/distribution indicator have proved particularly useful.
Experienced traders use them primarily to assess the strength of an existing trend and to confirm or refute their own theories. Do the signals from the trading volume coincide with other Trading signalssuch as changes in the VIXThere are opportunities for attractive profits. However, there are no guaranteed successes even with volume trading strategies.
