


The Nasdaq 100 Index is a stock market index that reflects the performance of 100 of the largest non-financial companies listed on the Nasdaq Stock Market. It mainly comprises technology companies and is regarded as an important indicator for the development of the technology sector on the stock market.
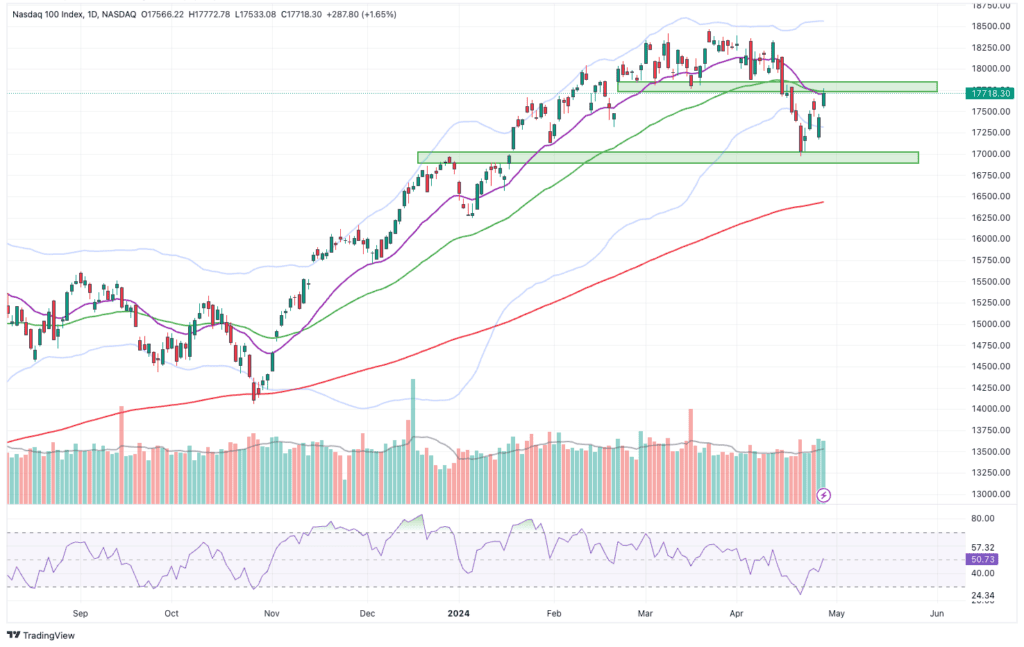
Lieber Trader, liebe Börsenfreunde. Nach drei Wochen mit Kursverlusten in Folge, gelang dem Nasdaq 100 in der letzten Woche das…

Dear trader, dear stock market friends. Since the last analysis on March 4, at least the technical chart situation on the Nasdaq has...
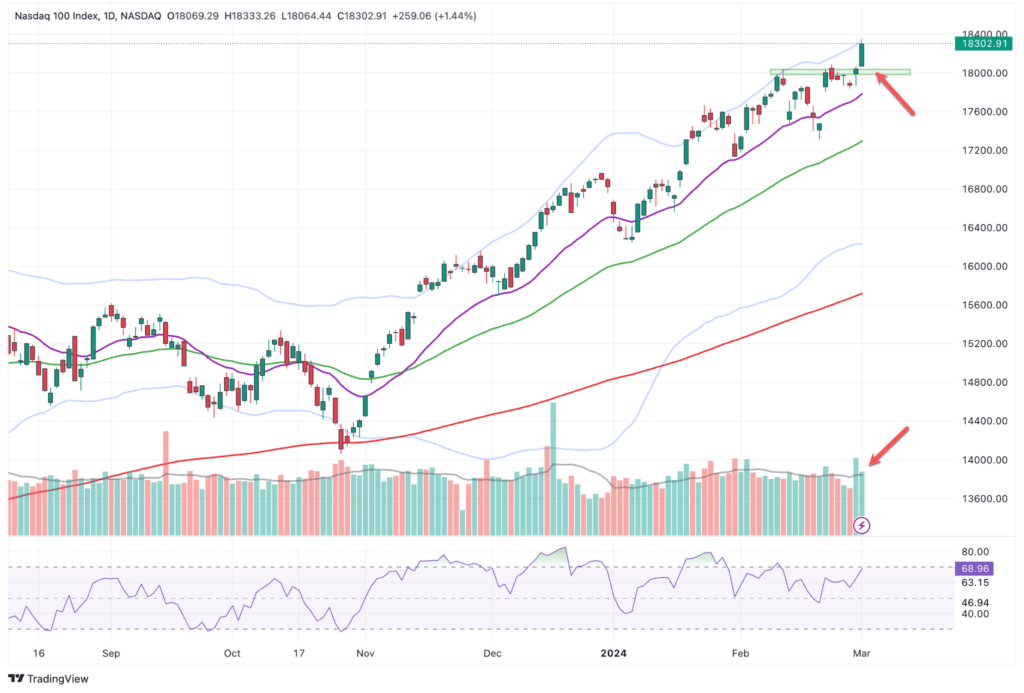
Dear trader, dear stock market friends. Last week, the Nasdaq 100 Index reached another all-time high below a slightly higher...

Dear trader, dear stock market friends. We are currently in the middle of the reporting season again and the publication of the quarterly figures is...

Dear trader, dear stock market friends, with a minus of 1.7 % on the first trading day and a minus of 3.1 % in...