


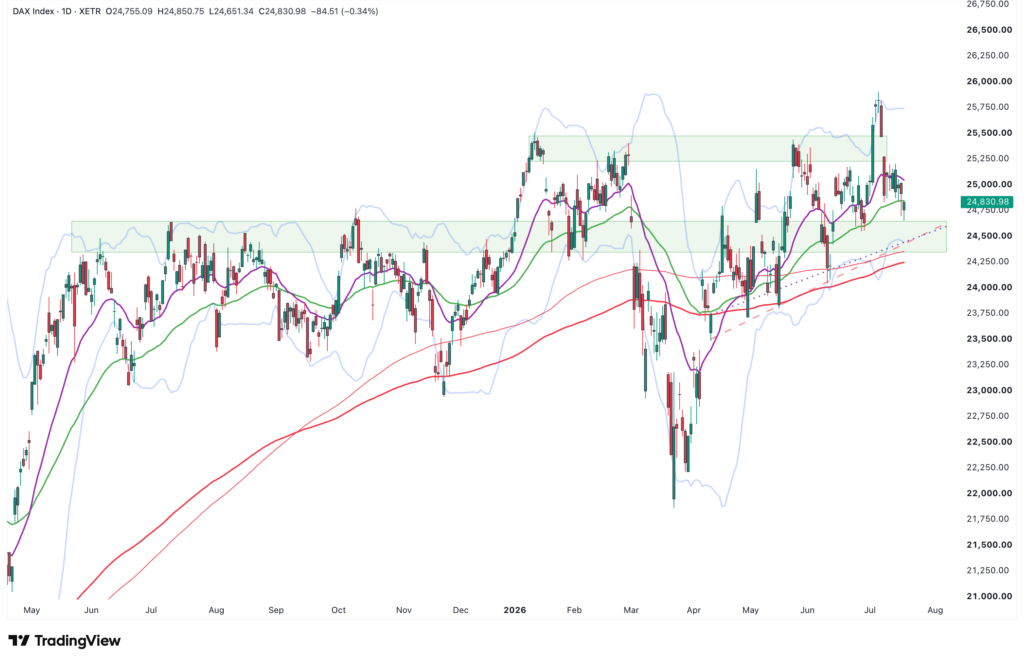
Dear traders, dear stock market friends. After the recent all-time high at the beginning of July, last trading week saw the DAX's record-breaking run take a palpable...
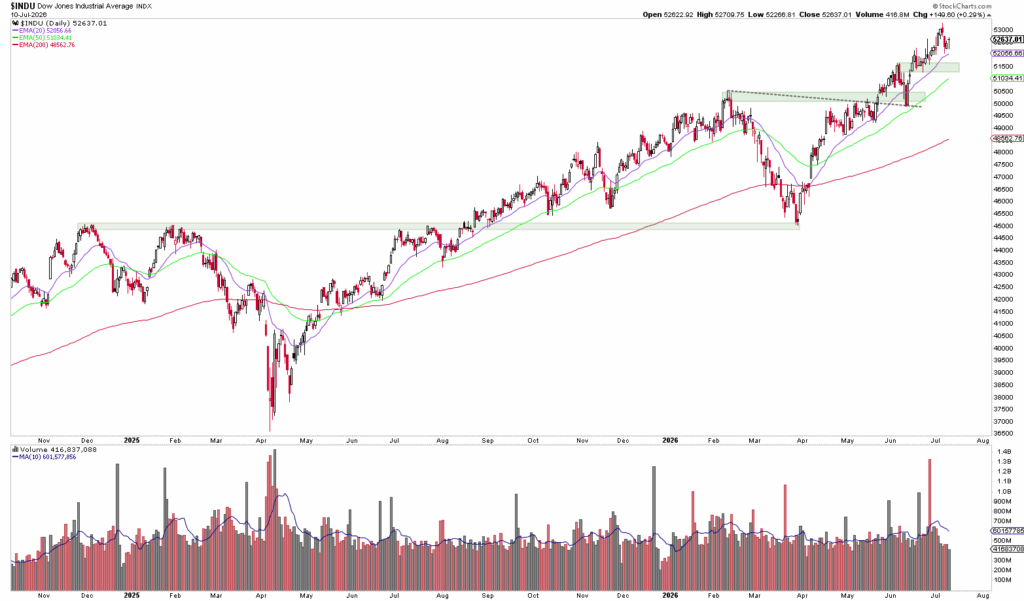
Dear traders, dear stock market friends. Last week, the Dow Jones made history and surpassed the 53,000 mark for the first time…
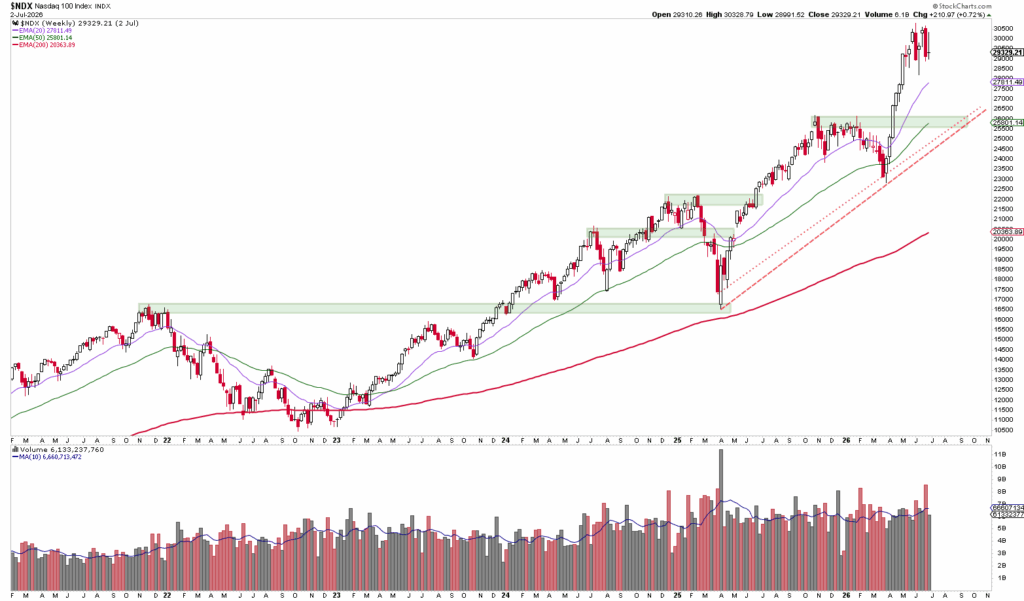
Dear traders, dear stock market friends. After the record-breaking rally in the Nasdaq 100 in the first five months of the year,…
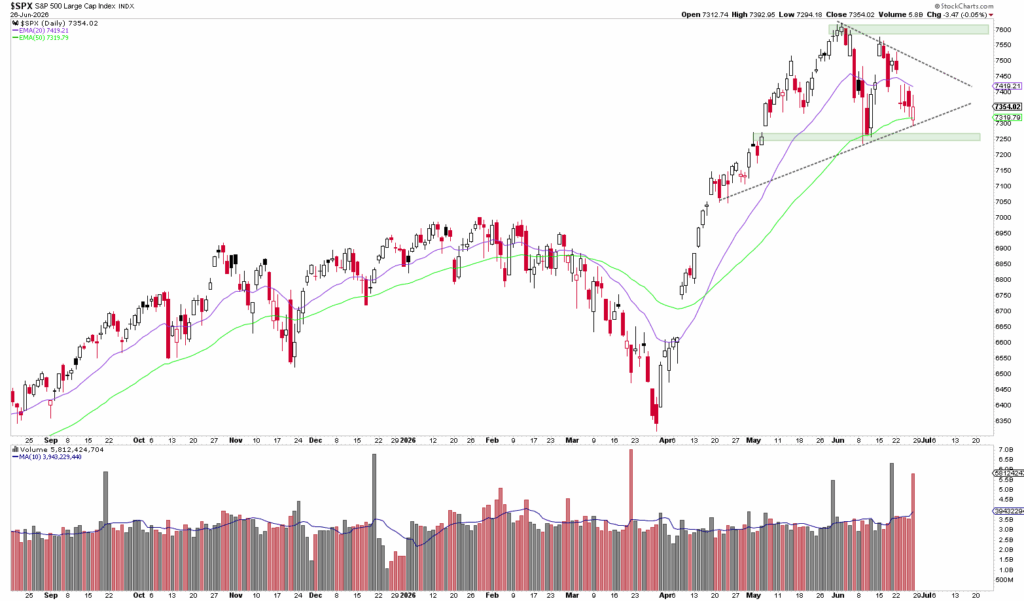
Dear traders and stock market enthusiasts. The S&P 500 continued its correction last trading week, losing about 2 %.…
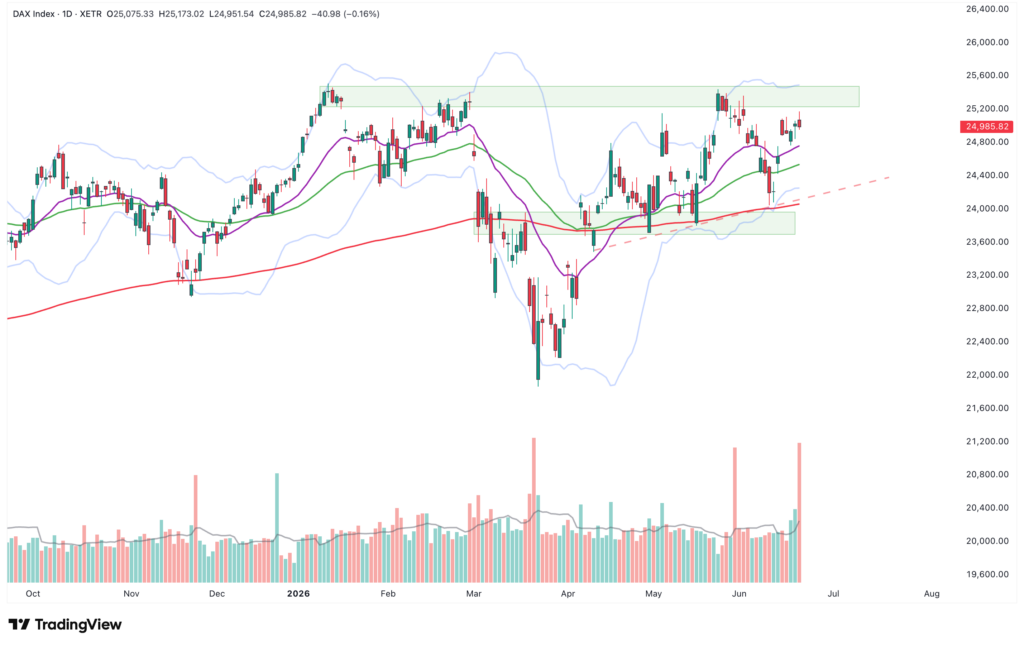
Dear traders, dear stock market friends. The DAX has had a friendly, but by no means euphoric, trading week. After a strong start to the week on...
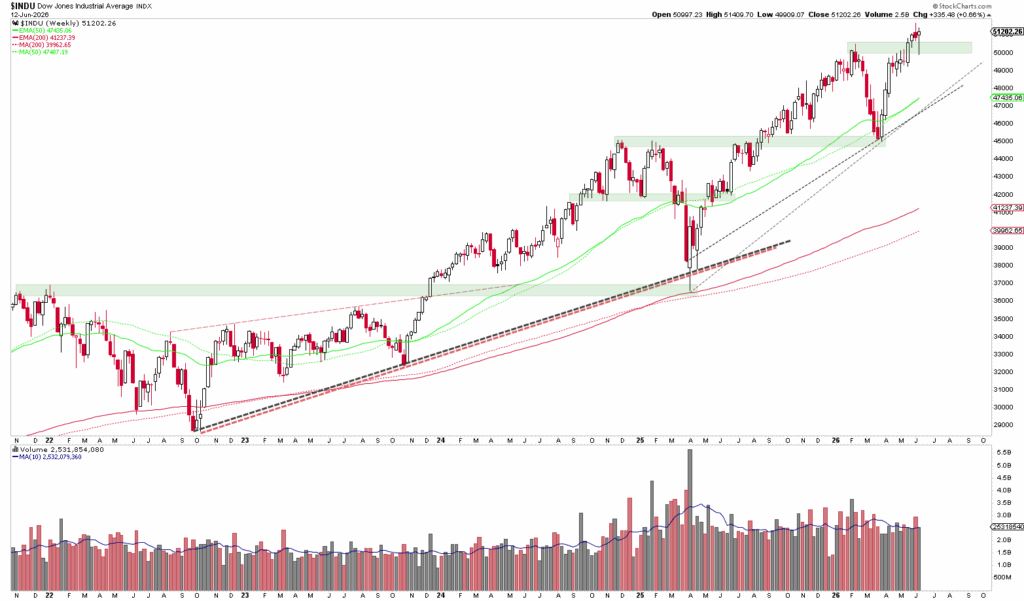
Dear traders, dear stock market friends. The Dow Jones ended a volatile trading week with a gain last Friday. In the meantime…
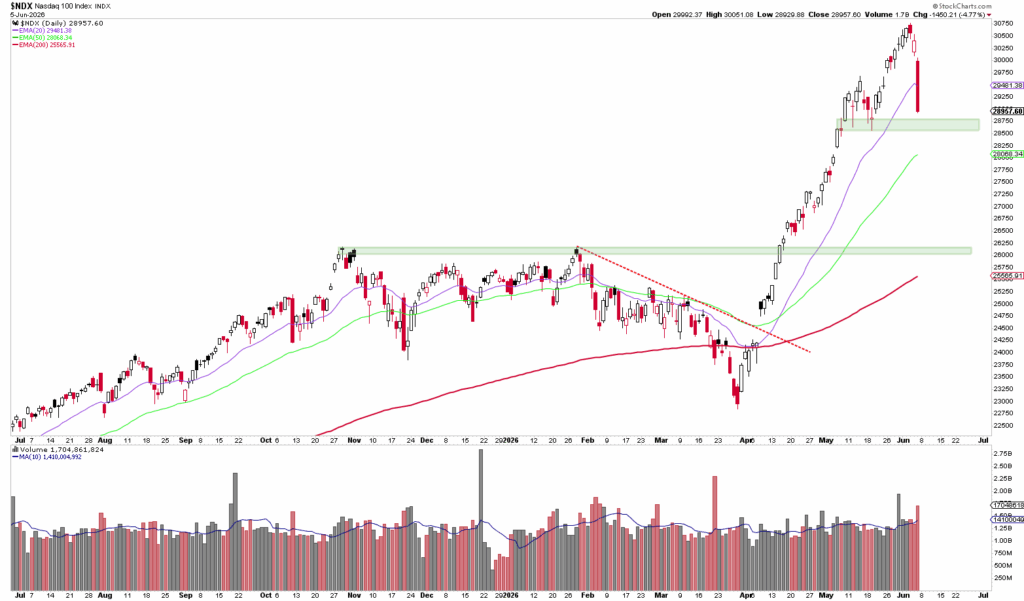
Dear traders and stock market enthusiasts. The Nasdaq 100 experienced a full-blown mini-crash on Friday. The tech index plummeted by 4.77%…
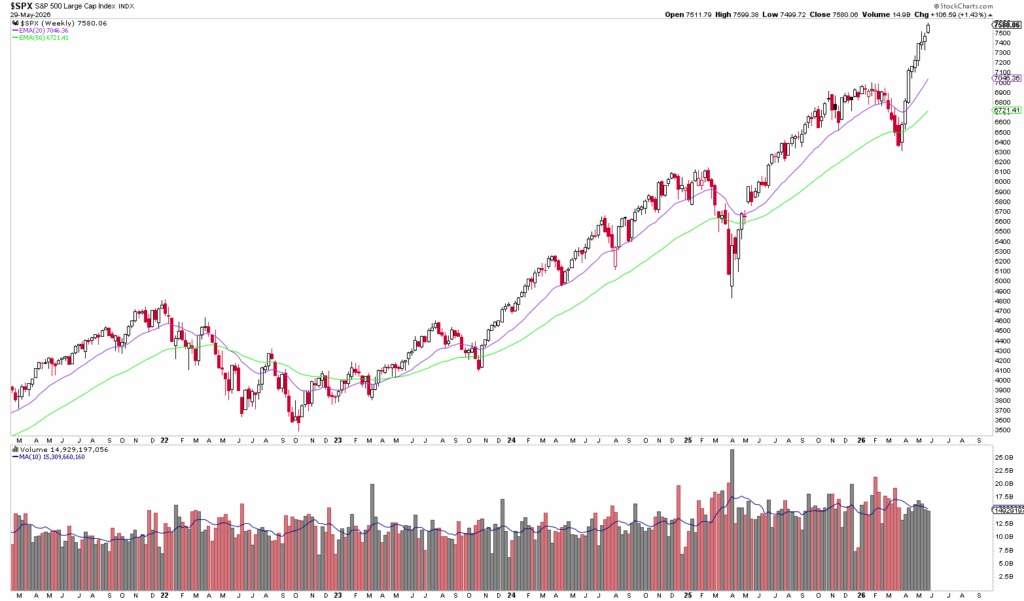
Dear traders, dear stock market friends. The S&P 500 ended the ninth consecutive week with a price gain and has now been...
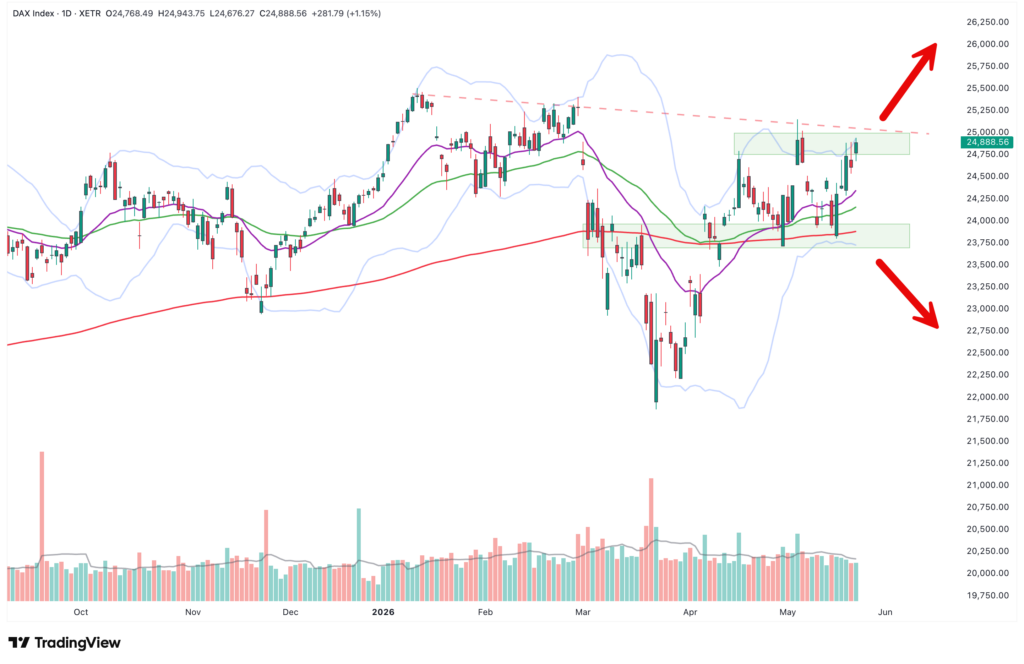
Dear traders, dear stock market friends. The DAX ended the past trading week with a gain of 3.9 percent. The main driver was signals of easing tensions in...

Dear traders, dear stock market friends. While the S&P 500 and the Nasdaq 100 have already reached several new all-time highs in recent weeks...