


The stock market is a complex system that is constantly in flux and evolving due to global economic, political and technological changes. For investors who want to be successful in the long term, it is crucial to recognize the trends that have the potential to significantly influence market developments.
This comprehensive guide shows which share trends are important for 2026 and how you as an investor can use them to your advantage.

The most important in a nutshell
- Technology trends such as artificial intelligence (AI), 5G and blockchain technologies will continue to dominate and create new investment opportunities.
- Trend tradingSuccessful trading is based on the ability to recognize upward and downward trends. Long-term trends offer opportunities for more stable profits.
- Technical analysisImportant tools such as trend lines, moving averages and indicators such as RSI help to identify trends and make well-founded decisions.
Important share trends in 2026 and their influencing factors
The year 2026 will bring a number of significant trends that will shape global markets and offer investors numerous opportunities. The developments range from technological innovations and the expansion of sustainable investments to geopolitical changes.
These trends not only determine the performance of shares, but also influence the strategic decisions of investors who wish to align themselves with these long-term changes.
Technology trends and growth factors
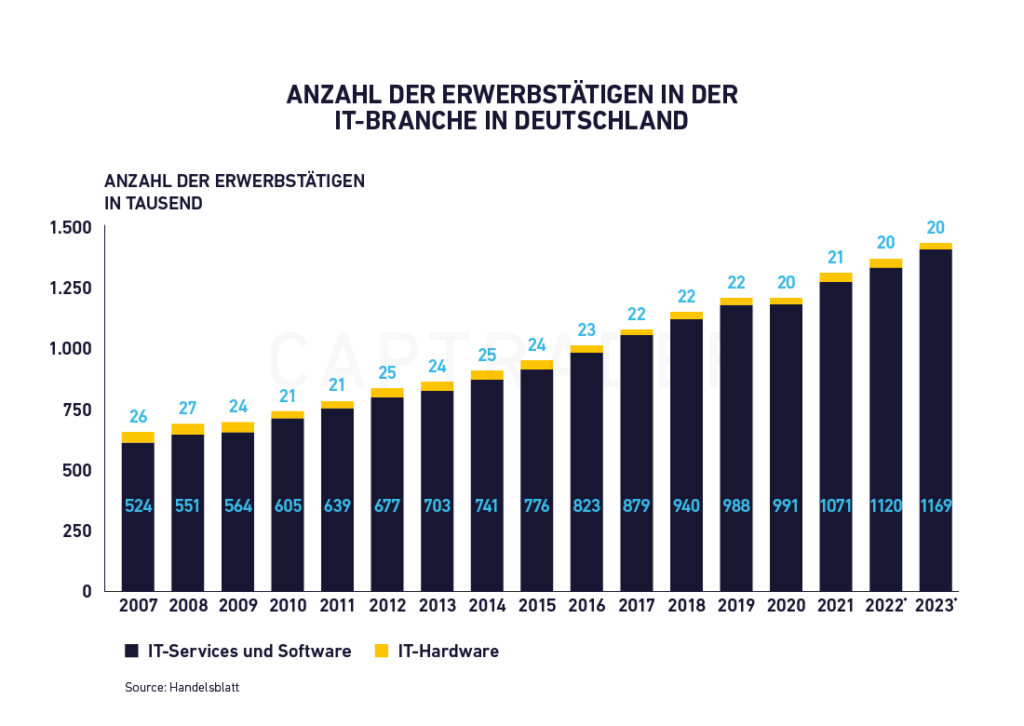
Technological innovations will remain a key driver for the financial markets in 2026. Companies that specialize in areas such as Artificial intelligence (AI), the Internet of Things (IoT), 5G and Blockchain technologies offer investors great potential.
The further development of IoT and 5G enables the creation of smart cities and the further development of autonomous vehicles. AI is leading to greater automation and increased efficiency in various industries, while blockchain technology is improving security in financial transactions and supply chain management.
Quantum computing is also in focus as a ground-breaking technology that could revolutionize complex calculations in the coming years. In addition, autonomous driving is being driven forward by the combination of AI, 5G and edge computing. These developments promise to disrupt the technology industry to change more in the next ten yearsthan has been the case in the last 100 years.
Sustainability and ESG investments
Sustainability continues to grow in importance and is a long-term trend that is being driven by both consumers and governments. ESG criteria (Environmental, Social, Governance) play a central role in the valuation of companies by investors.
Companies that focus on climate change solutions such as renewable energies or the circular economy are attracting more and more capital. Both consumers and investors are paying increasing attention to ethical and ecological standards.
This trend is reinforced by government regulations aimed at reducing CO₂ emissions and forcing companies to introduce more sustainable business practices.
The focus on sustainable investments is supported by a growing Consumer demand for environmentally friendly products and services. Companies that invest in renewable energies, such as solar and wind power or battery technology, are at the forefront of benefiting from these changes.


Developments in the healthcare sector
The healthcare sector remains a rapidly growing field, driven by demographic change and technological innovations. The increasing ageing of the population is leading to rising demand for healthcare services.
New technologies, such as telemedicine, and advances in personalized Medicine and biotechnology, make the sector particularly attractive for investors. Companies that offer innovative healthcare solutions, such as digital healthcare platforms, are benefiting from this growing market.
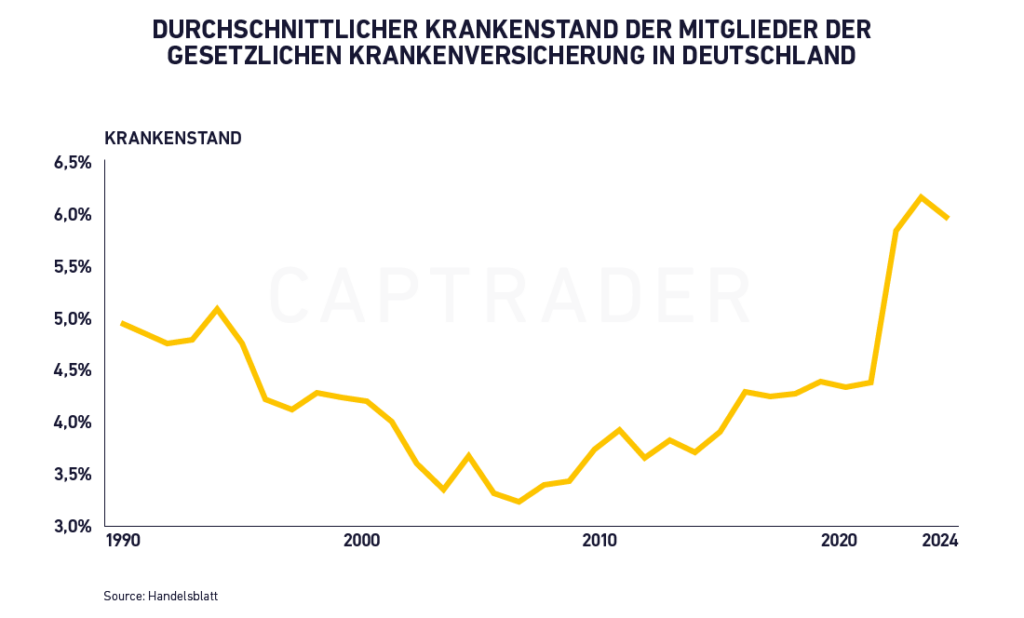
However, there is a worrying trend in the area of sick leave. In Germany, this reached a new record of around 6.8 percent in 2024.
Mental illness and respiratory diseases are major contributors to this development, which further underlines the importance of investing in the healthcare sector. These trends increase the importance of companies that deal with healthcare services and medical technologies.
Geopolitical influences and risks
Geopolitical factors will continue to have a significant impact on the markets in 2026. Trade conflicts, particularly between the US, China and the EU, could intensify and lead to uncertainty.
Sanctions and regulations in areas such as climate policy or trade policy have the potential to influence global markets and force companies to adapt their strategies.
It is crucial for investors to factor geopolitical risks into their investment decisions, as these are particularly important for export-oriented sectors.
The geopolitical landscape is characterized by growing tensions between major economies. China's increasing influence, Europe's political realignment, the war in Ukraine and the USA's focus on the Indo-Pacific are leading to a profound reorganization of the global balance of power.
Diese Geopolitical developments influence markets and supply chains and require companies to analyze their dependencies and value chains in detail.
Outlook for the long-term forecasts
The coming years will be characterized by profound technological, ecological and geopolitical changes. Companies that are able to adapt to these long-term trends will be able to exploit the greatest opportunities for growth.
Investors who strategically invest in companies that focus on technology, sustainability and health innovations are likely to benefit from these changes.
In summary, the markets in 2026 will be characterized by a combination of technological progress, sustainable developments and geopolitical upheaval. Investors should integrate these factors into their investment strategies in order to benefit from the emerging opportunities in the long term.
Technical analysis of stock trends
The Technical analysis is an indispensable tool for investors to make precise predictions about future price developments and to make well-founded trading decisions.
It is based on the analysis of historical price data, trading volumes and patterns in price fluctuations. While fundamental analysis assesses the intrinsic value of a company based on financial ratios, technical analysis focuses exclusively on price history and market behavior.
This enables you to identify stock trends and forecast market behavior.
The importance of trend lines and resistance zones
A key element of technical analysis is trend lines and resistance zones, which help investors to recognize the general direction of the market. These visual aids indicate whether the market is in an upward, downward or sideways trend. Correctly identifying these trends is crucial for planning trading strategies.
- Trend lines: Trend lines are fundamental tools that help investors understand market dynamics. They are drawn by connecting significant lows or highs on a chart. An upward trend line indicates a sustained upward trend characterized by rising highs and lows.
A downward trend line, on the other hand, indicates a downward trend in which prices are continuously falling. It is essential for traders to recognize these lines in order to make buy or sell decisions. A break of these lines can indicate a possible trend reversal, which can be decisive for the timing of a trade.
- Resistance zones and support zones: Resistance zones are price points at which the price of an asset has struggled to rise further in the past. These zones signal that there will be increased selling at this level.
Conversely, support zones represent price points at which the price has not fallen further in the past, as buyers have increasingly entered the market. Knowledge of these zones is crucial for planning entries and exits in trading.
If a resistance or support zone is broken through, this can indicate a significant change in market behavior that traders can exploit in a targeted manner.
A good knowledge of trend lines and resistance zones significantly increases the accuracy of trading strategies, as you can optimize your buy and sell times here.
Technical indicators as decision support
In addition to trend lines and resistance zones, there are a number of technical indicators that offer deeper insights into market movements and provide important information about the strength of a stock trend. These indicators are used by investors to estimate the probability of a trend continuing or reversing.
- Moving average: The moving average is one of the most widely used indicators in technical analysis. It indicates the average price of a security over a certain period of time and thus smoothes out short-term price fluctuations.
Investors use the moving average to determine the direction of a stock trend and minimize bias from short-term movements. A long-term moving average, such as the 200-day moving average, is often used to determine the overall trend of a security, while short-term moving averages, such as the 50-day moving average, are used for short-term trends.
An intersection between a short-term and a long-term moving average is often regarded as a signal for a trend reversal.
- Relative Strength Index (RSI): The RSI is a momentum indicator that measures the ratio of upward movements to downward movements in a given period and provides a value between 0 and 100.
An RSI above 70 indicates that a market is overbought, while a value below 30 indicates that the market is oversold. This is particularly useful for traders speculating on short-term price movements.
- Average Directional Index (ADX): The ADX measures the strength of a trend, regardless of whether it is an upward or downward trend. An ADX value above 25 indicates a strong trend, while a value below 25 indicates a weak or non-existent trend.
The ADX is particularly useful for investors who want to determine not only the direction but also the strength of a stock trend. A strong trend is a signal that a position can be held longer, while a weak trend indicates that it may be time to close a position or exit the market.
The combination of these indicators allows investors to make informed decisions by assessing both the direction and strength of a trend. However, these indicators should not be considered in isolation, but in combination to get a more comprehensive picture of the market.
By analyzing multiple indicators, investors can minimize potential false signals and increase their chances of making profitable trades.


15-minute chart: short-term analysis and opportunities
For short-term traders and day traders, the 15-minute chart a valuable overview of short-term market movements. This chart shows the price trend in 15-minute intervals and is particularly useful for recognizing and reacting to rapid price changes.
- Short-term trends: The 15-minute chart helps to identify short-term entry and exit points, which are crucial for traders who trade within a day. This chart shows rapid price movements that can be triggered by short-term news or events.
- Trend reversals: As the 15-minute chart reflects rapid market changes, trend reversals can be recognized at an early stage. For traders looking for short-term profits, it is important to react quickly to these movements in order to minimize losses and secure profits.
However, the 15-minute chart is not only useful for short-term traders, but also for long-term investors who are looking for additional confirmation for their decisions. For example, if a long-term trend is confirmed by short-term data, investors can invest or adjust their positions with greater certainty.
| Range | Description |
| Basics of technical analysis | Analysis method for predicting price trends based on historical prices, trading volumes and price fluctuations, without taking company key figures into account. |
| Trend lines and market movements | - Trend lines mark upward or downward trends by connecting high or low points on a chart. - Resistance zones signal price levels at which the rise comes to a halt. - Support zones mark price levels at which the price will not fall any further. |
| Important technical indicators | - Moving average: Smoothes short-term fluctuations in order to recognize the direction of the trend. - RSI (Relative Strength Index): Evaluates momentum and indicates overbought (>70) or oversold (<30) market phases. - ADX (Average Directional Index): Indicates the strength of a trend; values above 25 indicate strong trends. |
| Short-term analysis with the 15-minute chart | - Used for short-term market observation and day trading - Shows rapid price movements in 15-minute increments. - Helps to recognize short-term trend reversals at an early stage. |
The table provides a clear summary of the most important aspects of technical analysis to help you make informed trading decisions. This overview provides a solid basis for better understanding the stock market and developing targeted trading strategies.
Trend trading strategies
Trend trading is a popular and effective trading strategy that aims to profit from ongoing market movements. It is based on the idea that markets follow stock trends and that these trends can be identified and exploited by analyzing price movements.
For investors and traders looking to make consistent profits, recognizing and understanding trends is crucial. Trend trading offers you the opportunity to profit from longer-lasting market movements while minimizing risk by adjusting your positions to market conditions.
Patterns and signals to confirm trends
Trends do not occur in isolation, but often form certain patterns that can predict their continuation or reversal. The most common patterns used in trend analysis include:
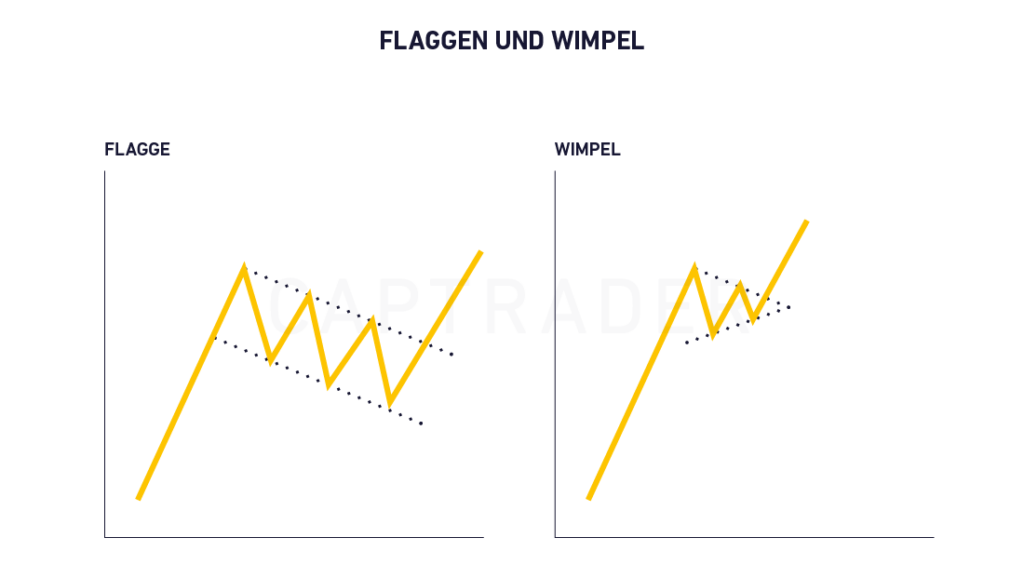
- Flags and pennants: These patterns often signal a short-term consolidation during a strong stock market trend and indicate that the market will continue in the original direction after a pause.
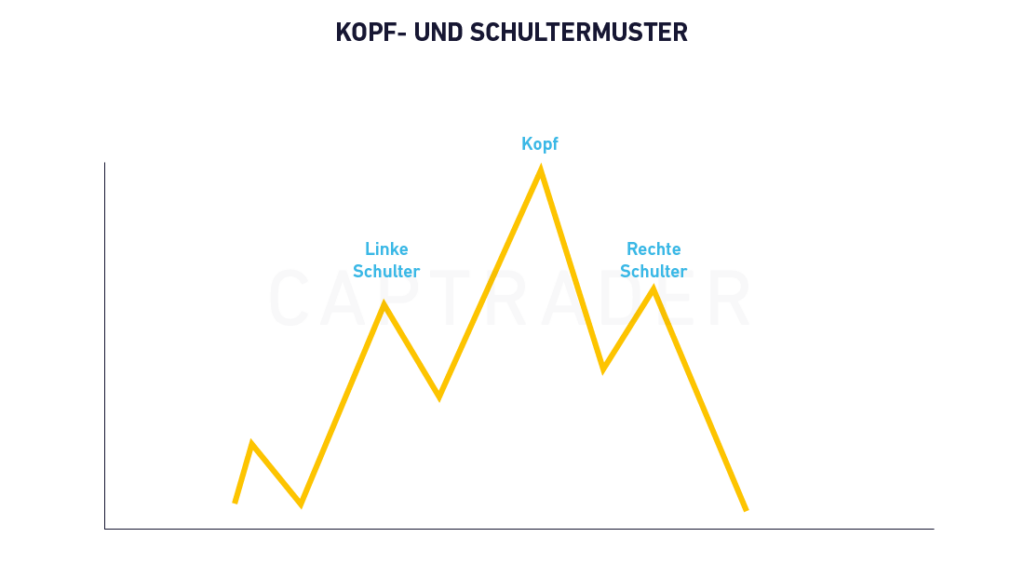
- Head and shoulder pattern: This is a typical reversal pattern that indicates the end of a trend. A "head and shoulders" pattern indicates an impending trend reversal, and traders can use this pattern to exit a position or take a counter-position in good time.
- Double tops and bottoms: A double top occurs when the price reaches a similar high twice before falling, while a double bottom signals the reversal point for a falling price.

If you recognize these patterns and interpret them correctly, you can time your trades better and increase the probability of being on the right side of the market.
The role of risk management in trend trading
While identifying stock trends is the foundation of trend trading, sound risk management is essential to minimize losses and maximize profits.
Trend trading can be risky due to market volatility and sudden reversals. As an investor, you should therefore take measures to protect yourself against unforeseen market movements.
- Stop-loss orders: A stop-loss order is a crucial risk management tool that protects the trader from suffering excessive losses.
This order automatically closes a position when the market reaches a predefined price that is below the current market price. This helps traders to avoid emotional decisions and stay disciplined by keeping losses within acceptable limits.
Especially in volatile markets, the use of stop-loss orders is crucial to reduce the risk of sudden price drops.
- Take profit orders: While stop-loss orders minimize losses, take-profit orders hedge profits. These orders are placed to close a position automatically as soon as a predetermined profit is reached.
By realizing profits before the market can reverse, traders protect their profits and prevent a positive trade from turning into a loss.
For you as a trader, the advantage of stop-loss and take-profit orders is that they bring a clear structure and discipline to the trading process. Instead of reacting to emotions or short-term impulses, decisions are made in advance, resulting in a consistent and well-thought-out strategy.


Position sizes and leverage
Another important element of risk management is position size. By setting an appropriate position size in relation to the overall portfolio, traders can precisely control the risk they take on each trade.
This helps to avoid extreme losses and protect the overall portfolio. A common rule in risk management is not to risk more than a certain percentage of the total capital per trade, often 1-2%.
While leverage can multiply the potential gains of a trade, it also carries a significant risk of increasing losses. Leverage must therefore be used with extreme caution and in combination with strict risk management measures.
As a trader, you should be aware of the risks of leverage and only use it if you see a high probability of a successful trade and are prepared to bear the potential losses.
Good to know:
Make sure that you choose the right position size for each trading decision and use leverage wisely to minimize risks and protect your portfolio.
The importance of psychological discipline
Trend trading requires not only technical knowledge and market understanding, but also a high degree of psychological discipline. The stock market can be volatile by nature and it is crucial for traders to remain emotionally stable and rational.
Emotions such as fear and greed are the biggest enemies of successful traders and often lead to rash decisions or hasty trades that are regretted afterwards.
- Patience and discipline: Successful trend trading requires patience. Traders often have to wait for a clear trend to emerge before trading and must not panic when the market experiences short-term fluctuations.
It is important to stick to your own strategy and not be overwhelmed by your own emotions.
- Avoidance of overtrading: Overtrading is a common mistake where traders trade too often because they feel they have to be constantly involved in the market.
This often leads to ill-considered and risky decisions. Successful traders know that less is often more and focus on high-quality trades based on sound analysis.
The ability to overcome psychological hurdles and keep a clear head is a key success factor in trend trading. Traders who are able to maintain discipline and patience have the best chances of making consistent profits in the long term.
CapTrader can do that:
CapTrader is characterized by a transparent and cost-effective fee structure. There are no custody fees and US stocks can be traded for as little as $0.01 per share (minimum $2 on US exchanges). Options on US options exchanges cost $3.50 per contract. There are no hidden costs.
Conclusion: Benefit from future share trends
Equity trends in 2026 offer investors a wide range of opportunities to optimize their portfolio and benefit from the dynamic developments on the financial markets. Technological innovations, sustainable investments and geopolitical influences play a key role here.
By using sound technical analysis and recognizing trends, investors can significantly increase their chances of long-term success. The key is to continuously monitor the markets, apply the right strategies and pursue strong risk management.
Those who recognize the trends early on and act accordingly can benefit from the many opportunities that 2026 offers.
